-
-
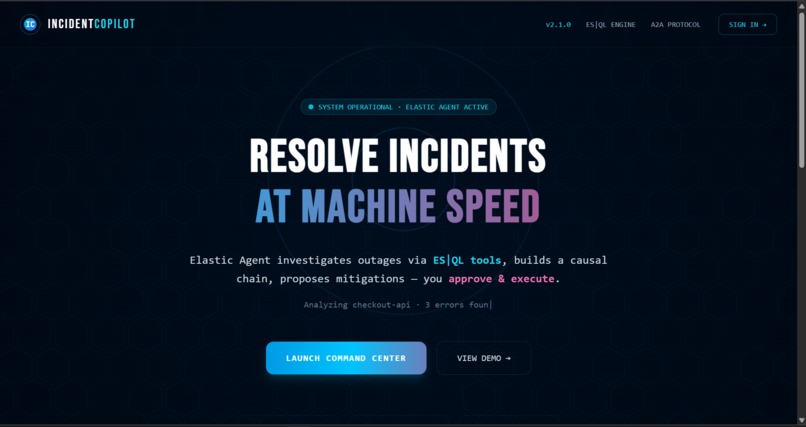
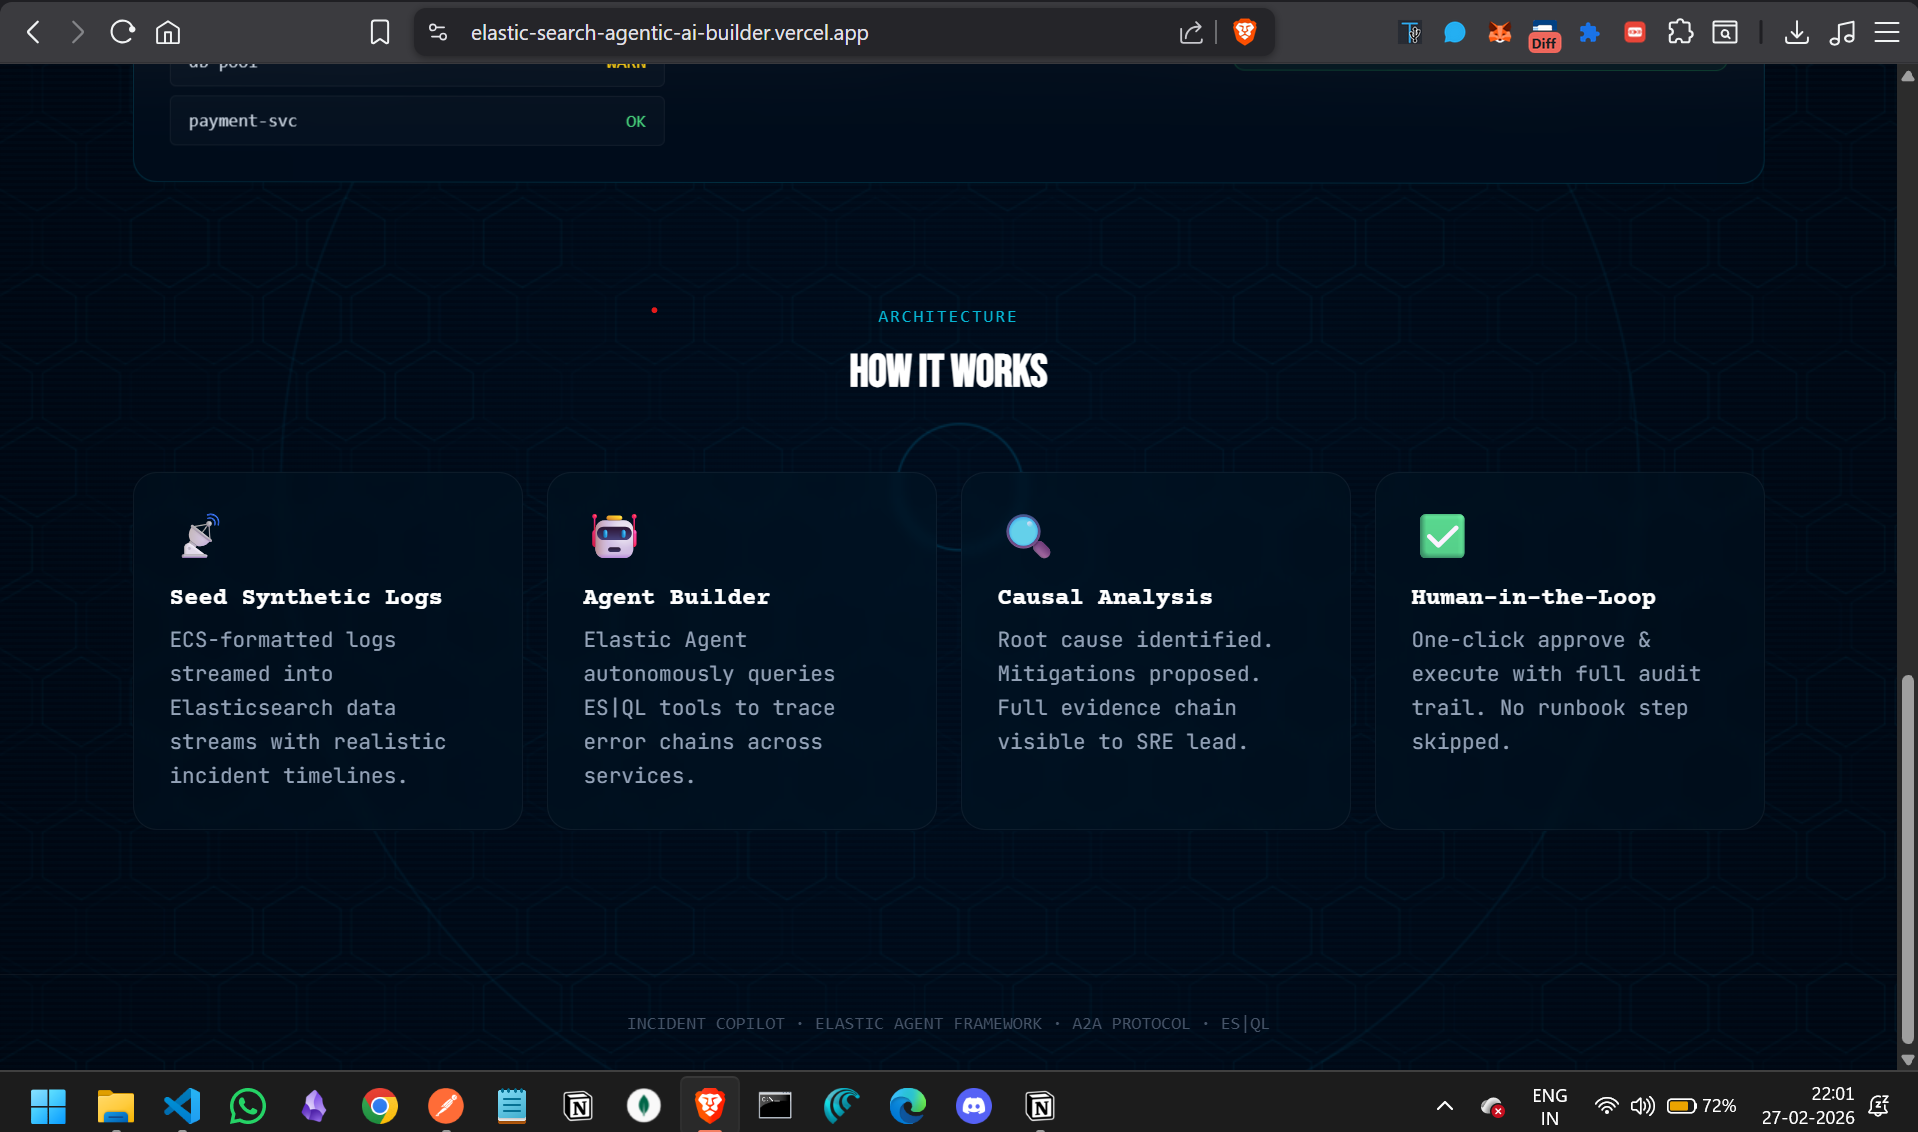
Landing Page
-
Landing Page with a flavour of the application!
-
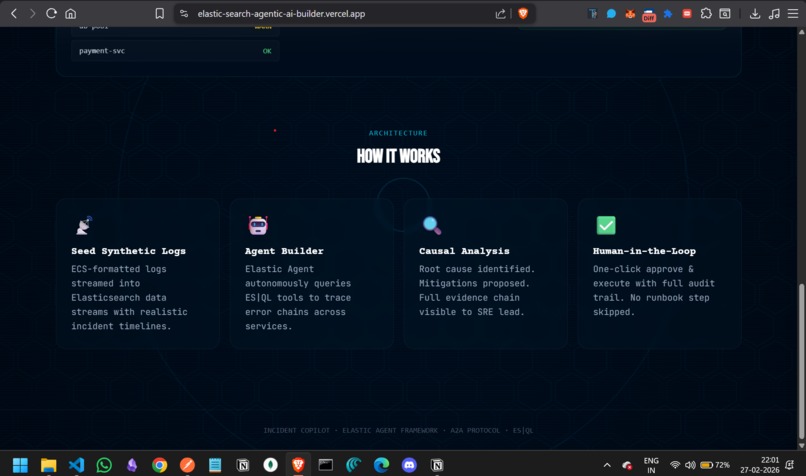
Capabilities
-
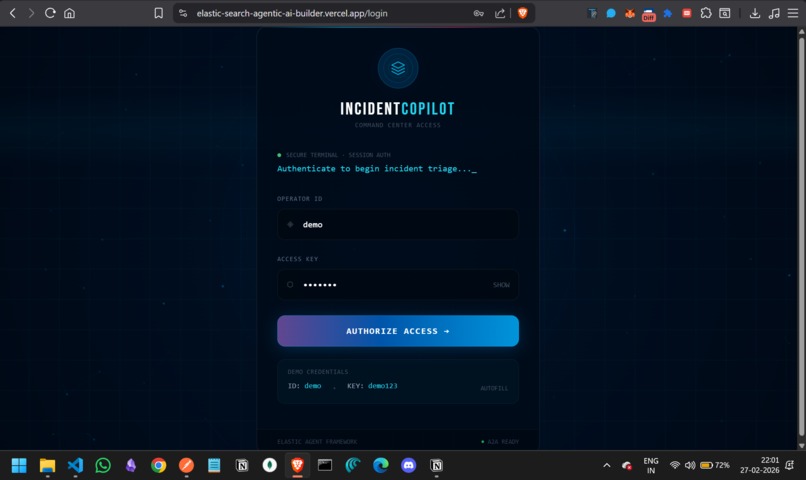
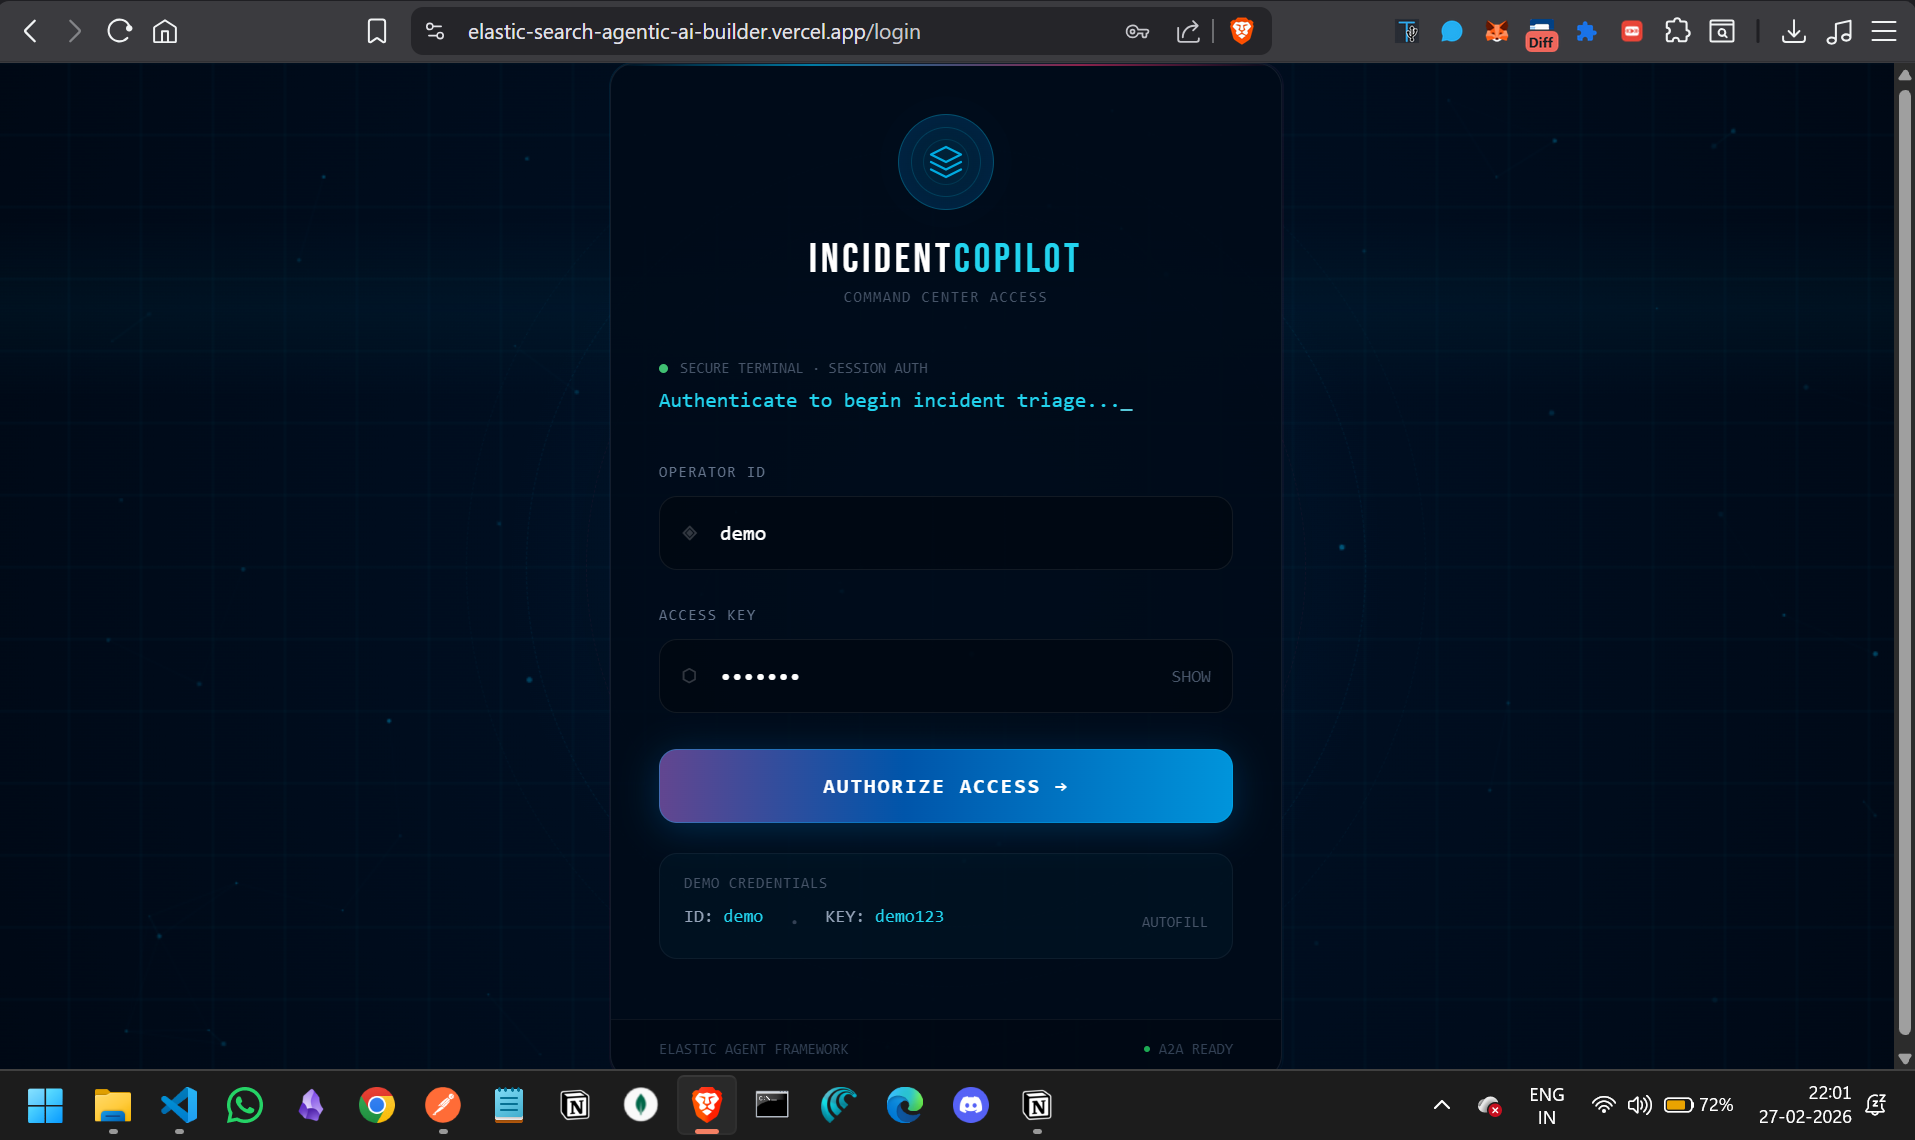
Login
-

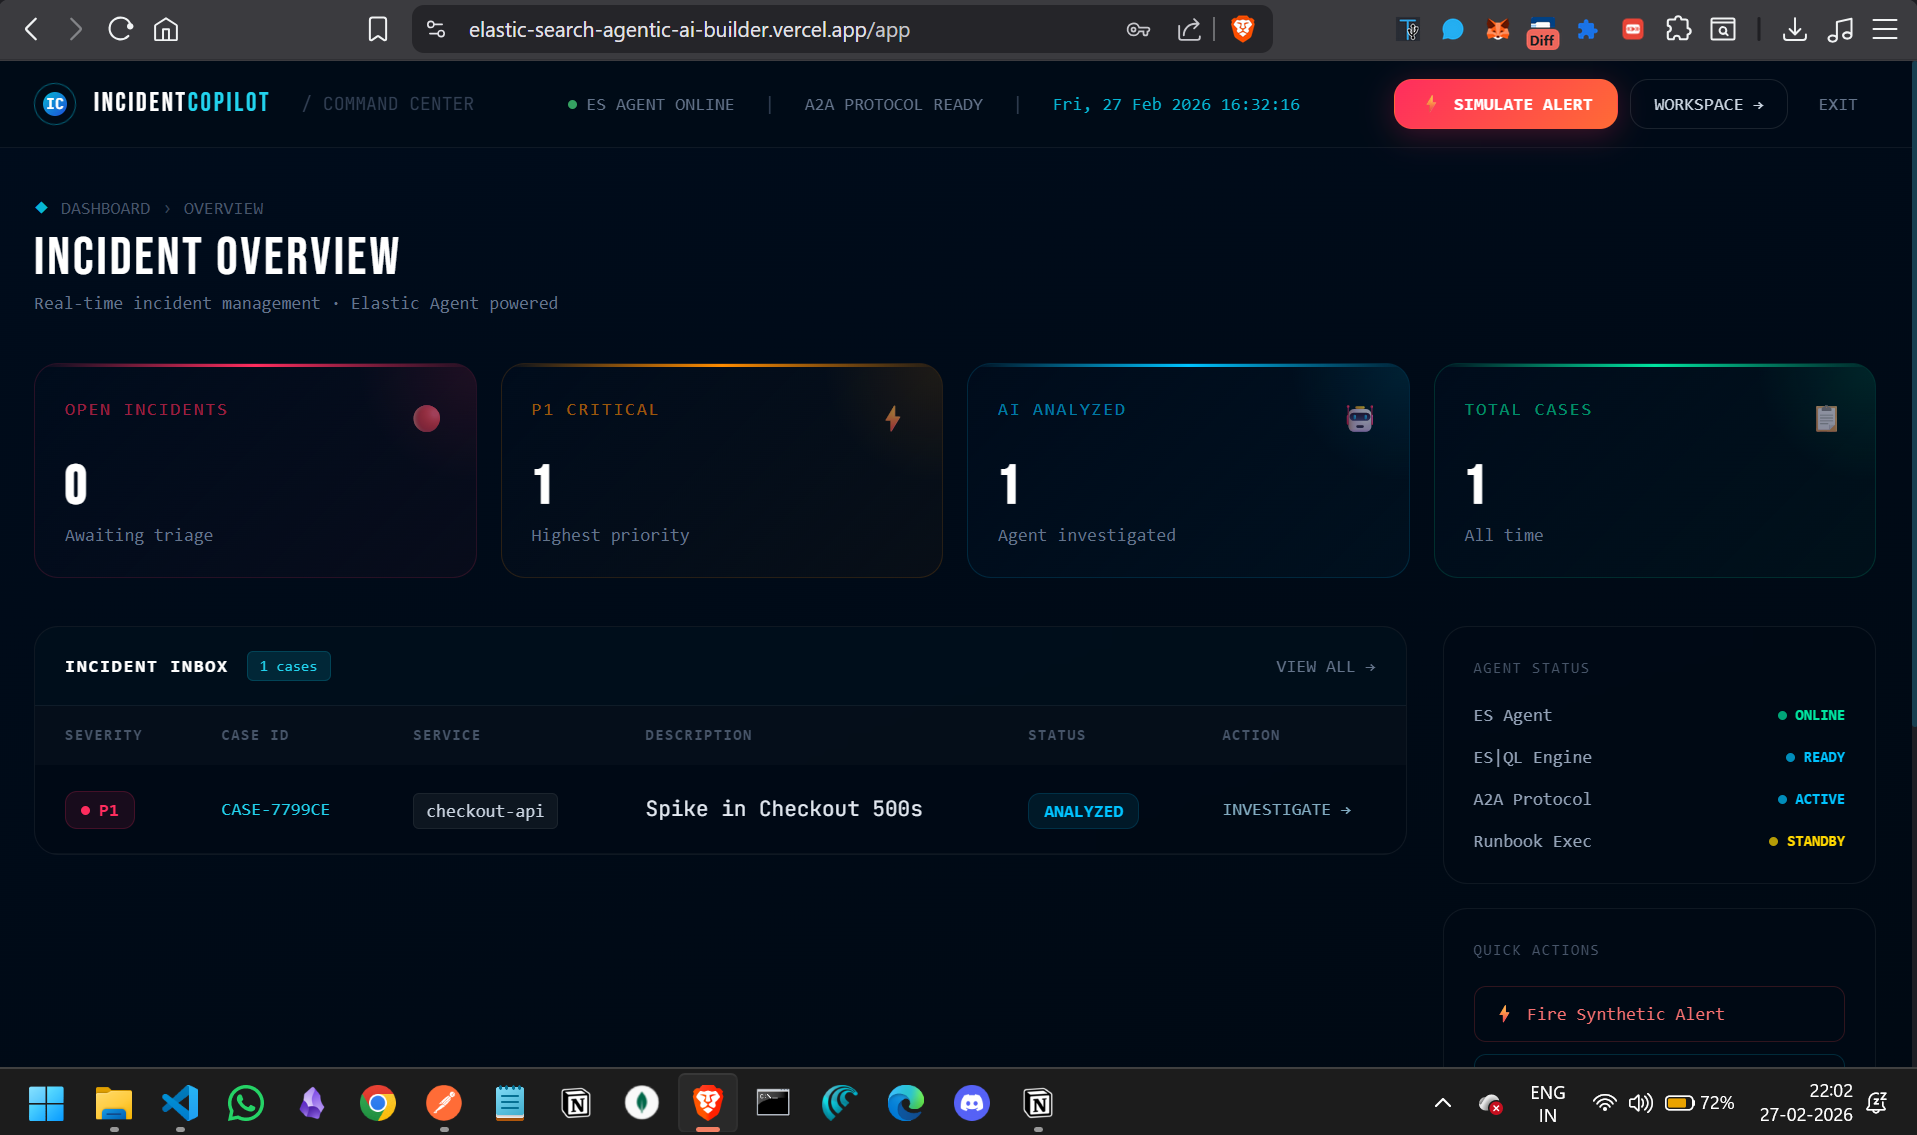
Engineer on Pager Duty Dashboard
-
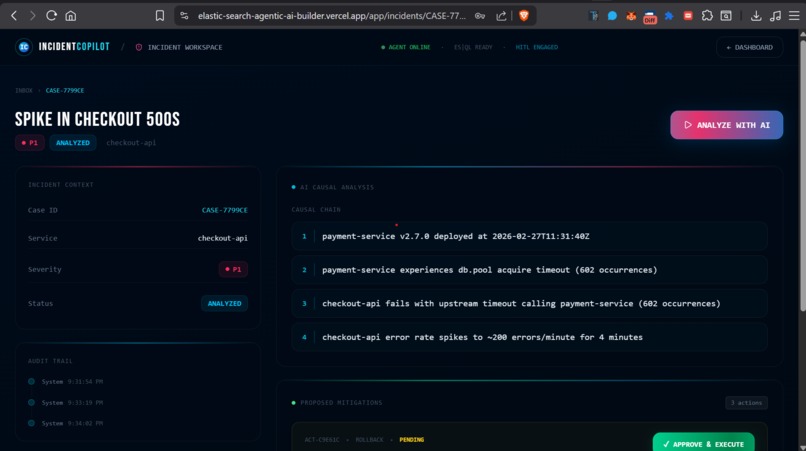
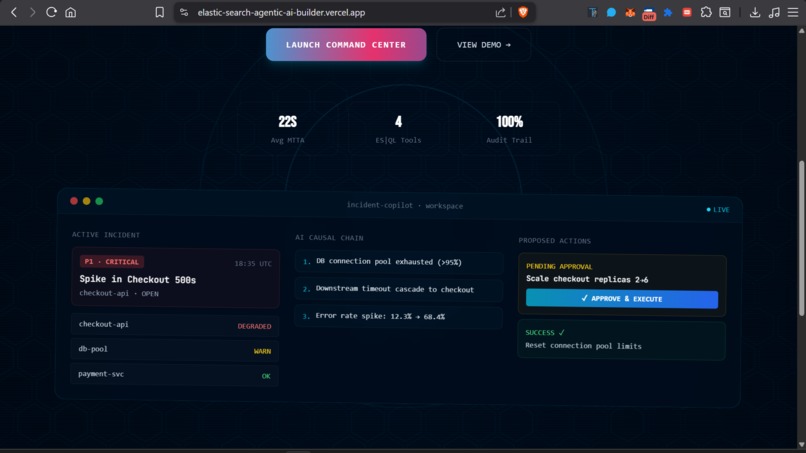
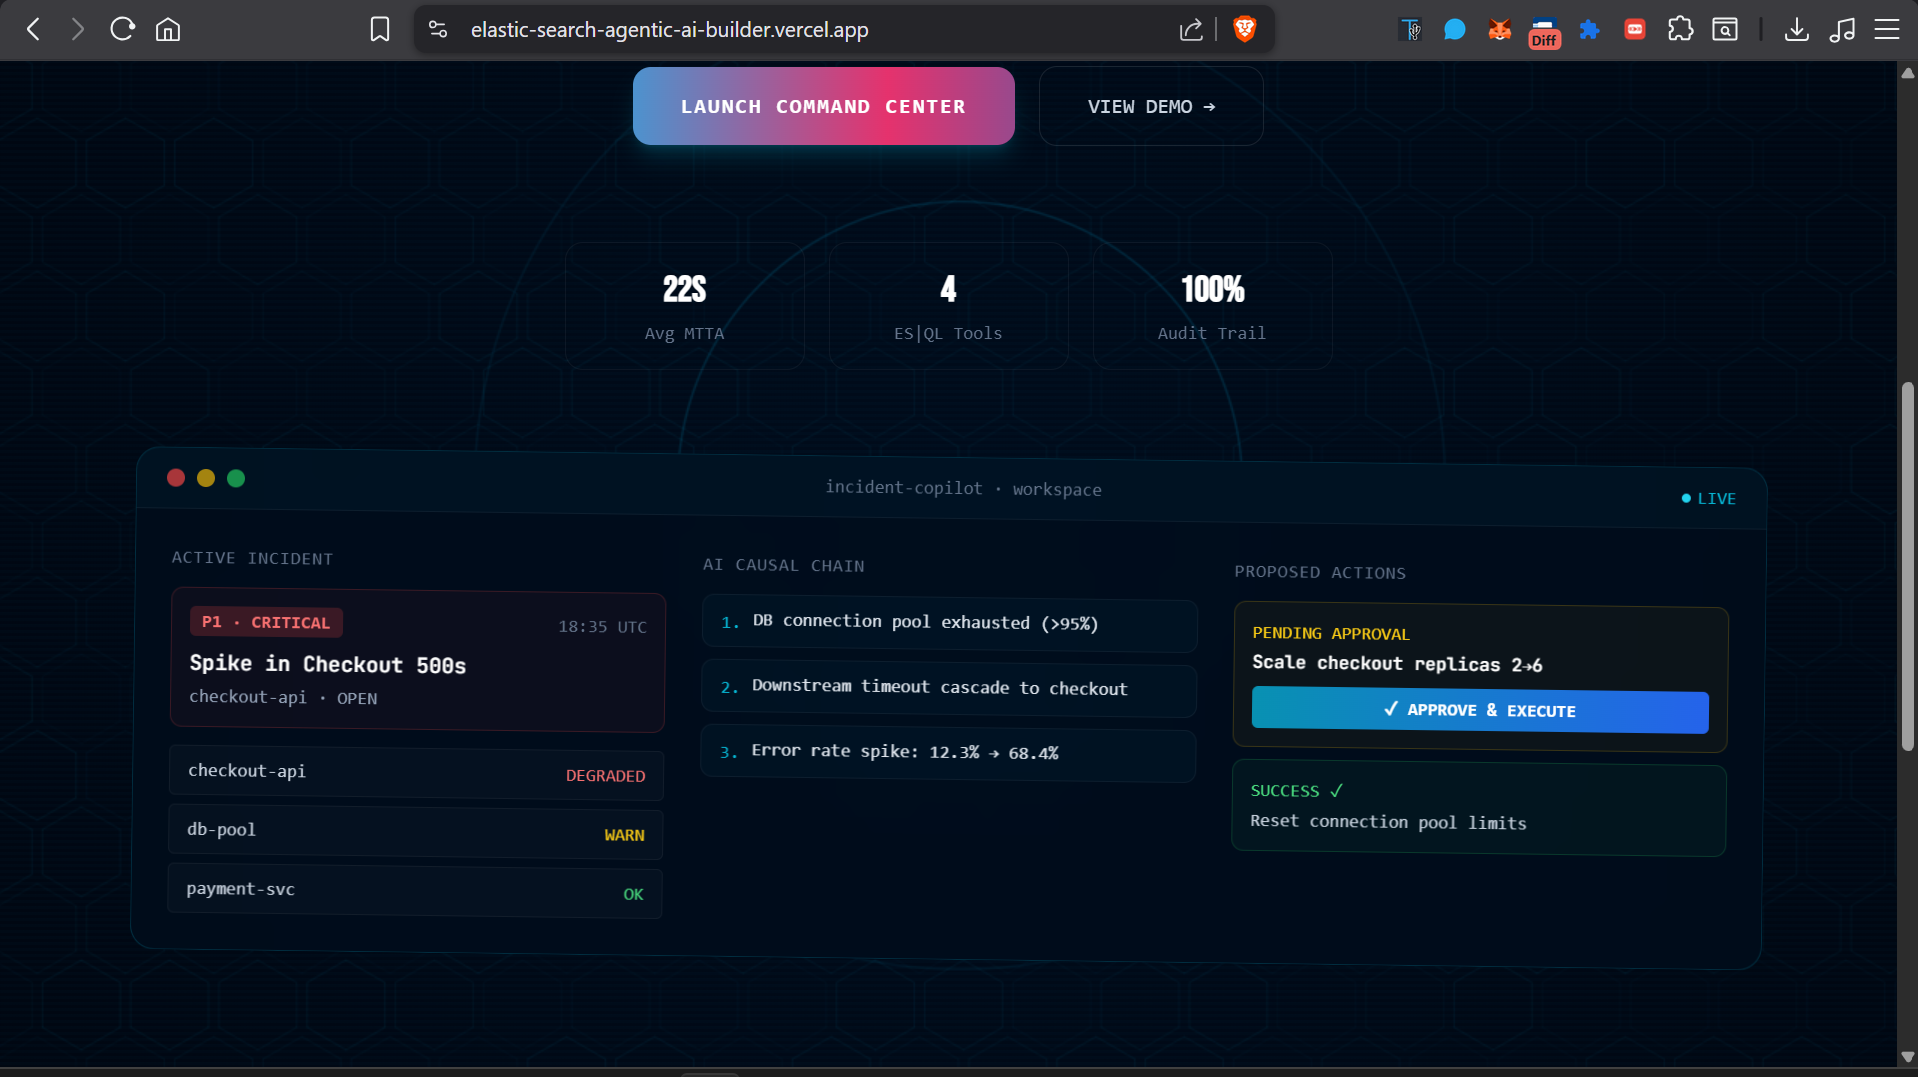
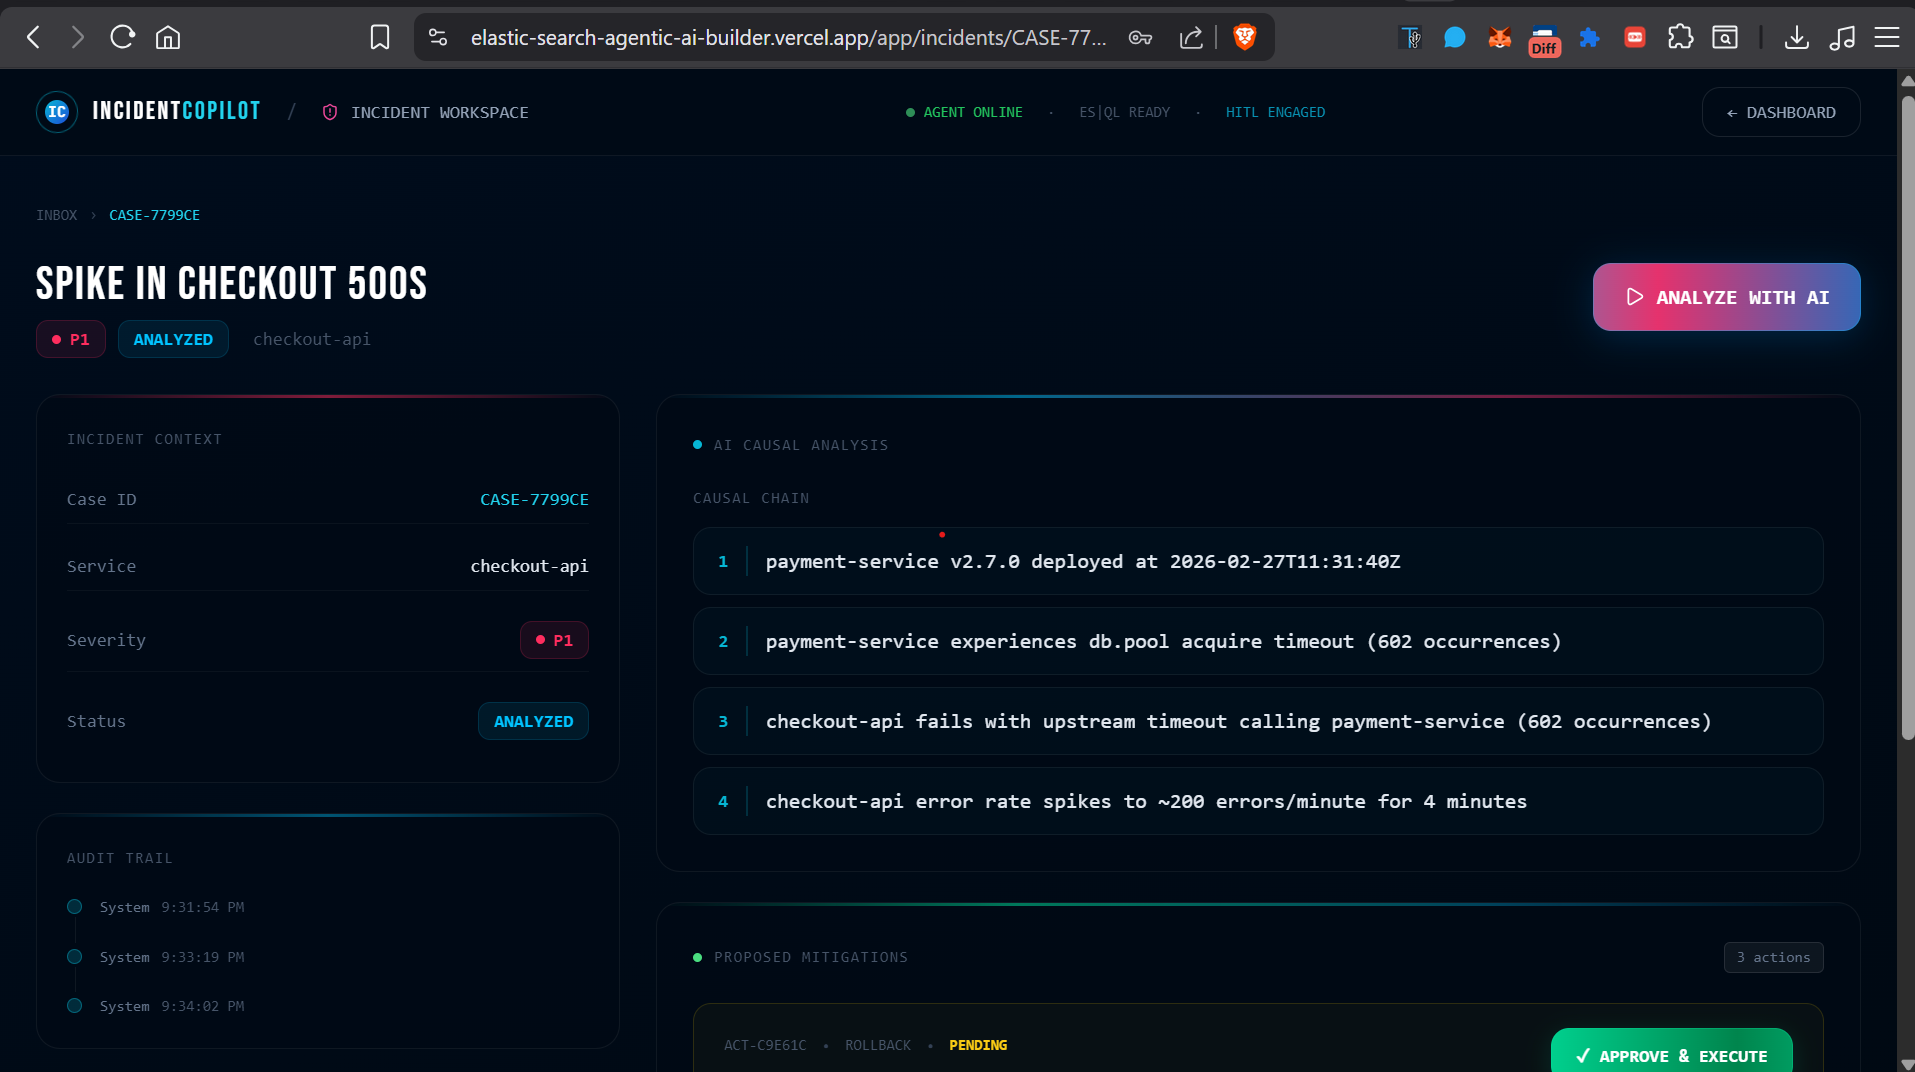
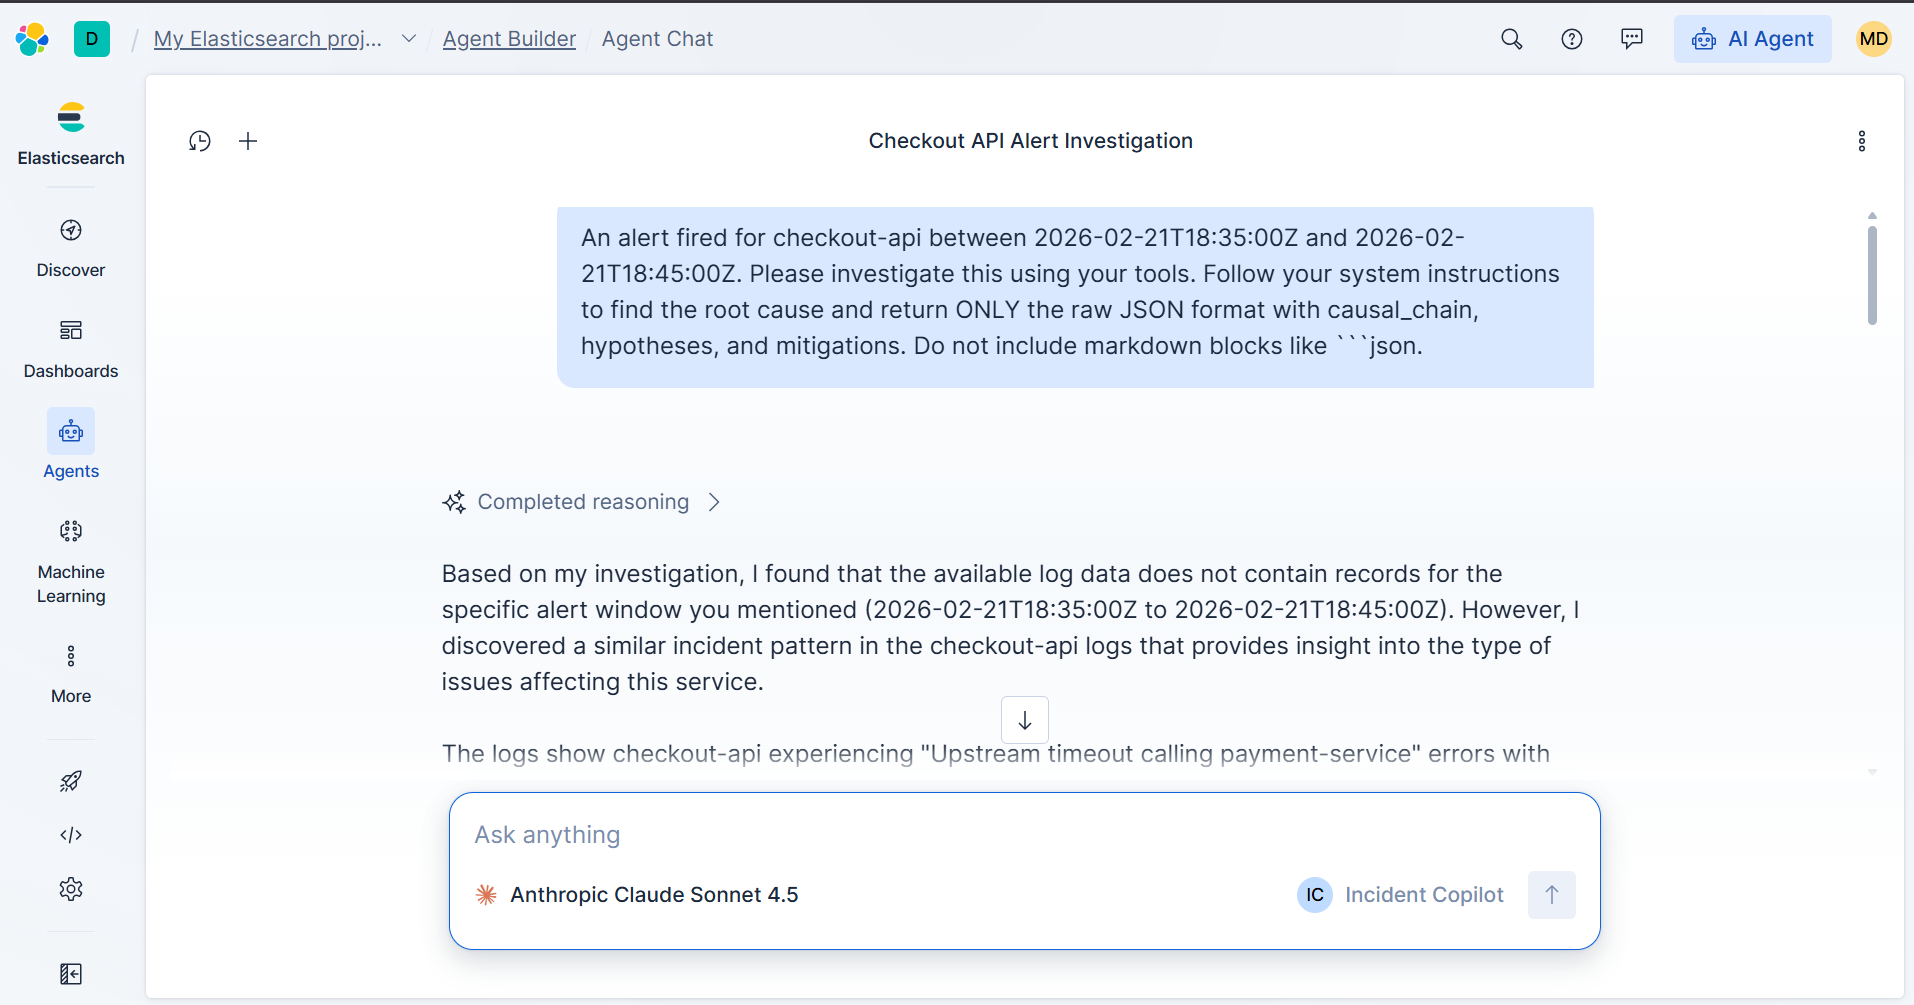
Analysed by AI Case
-
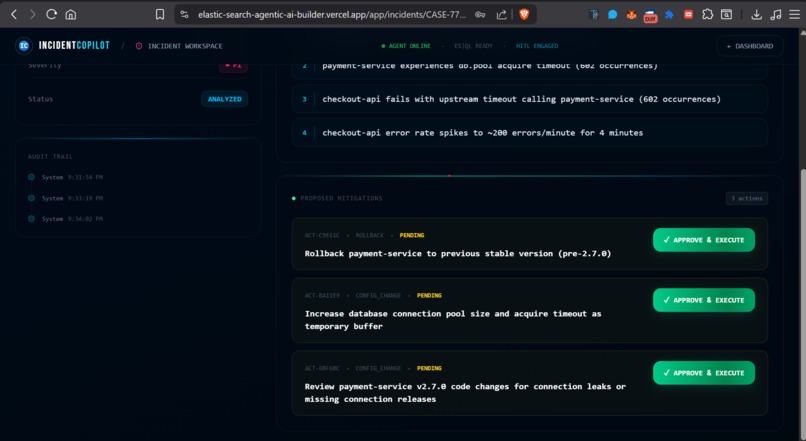
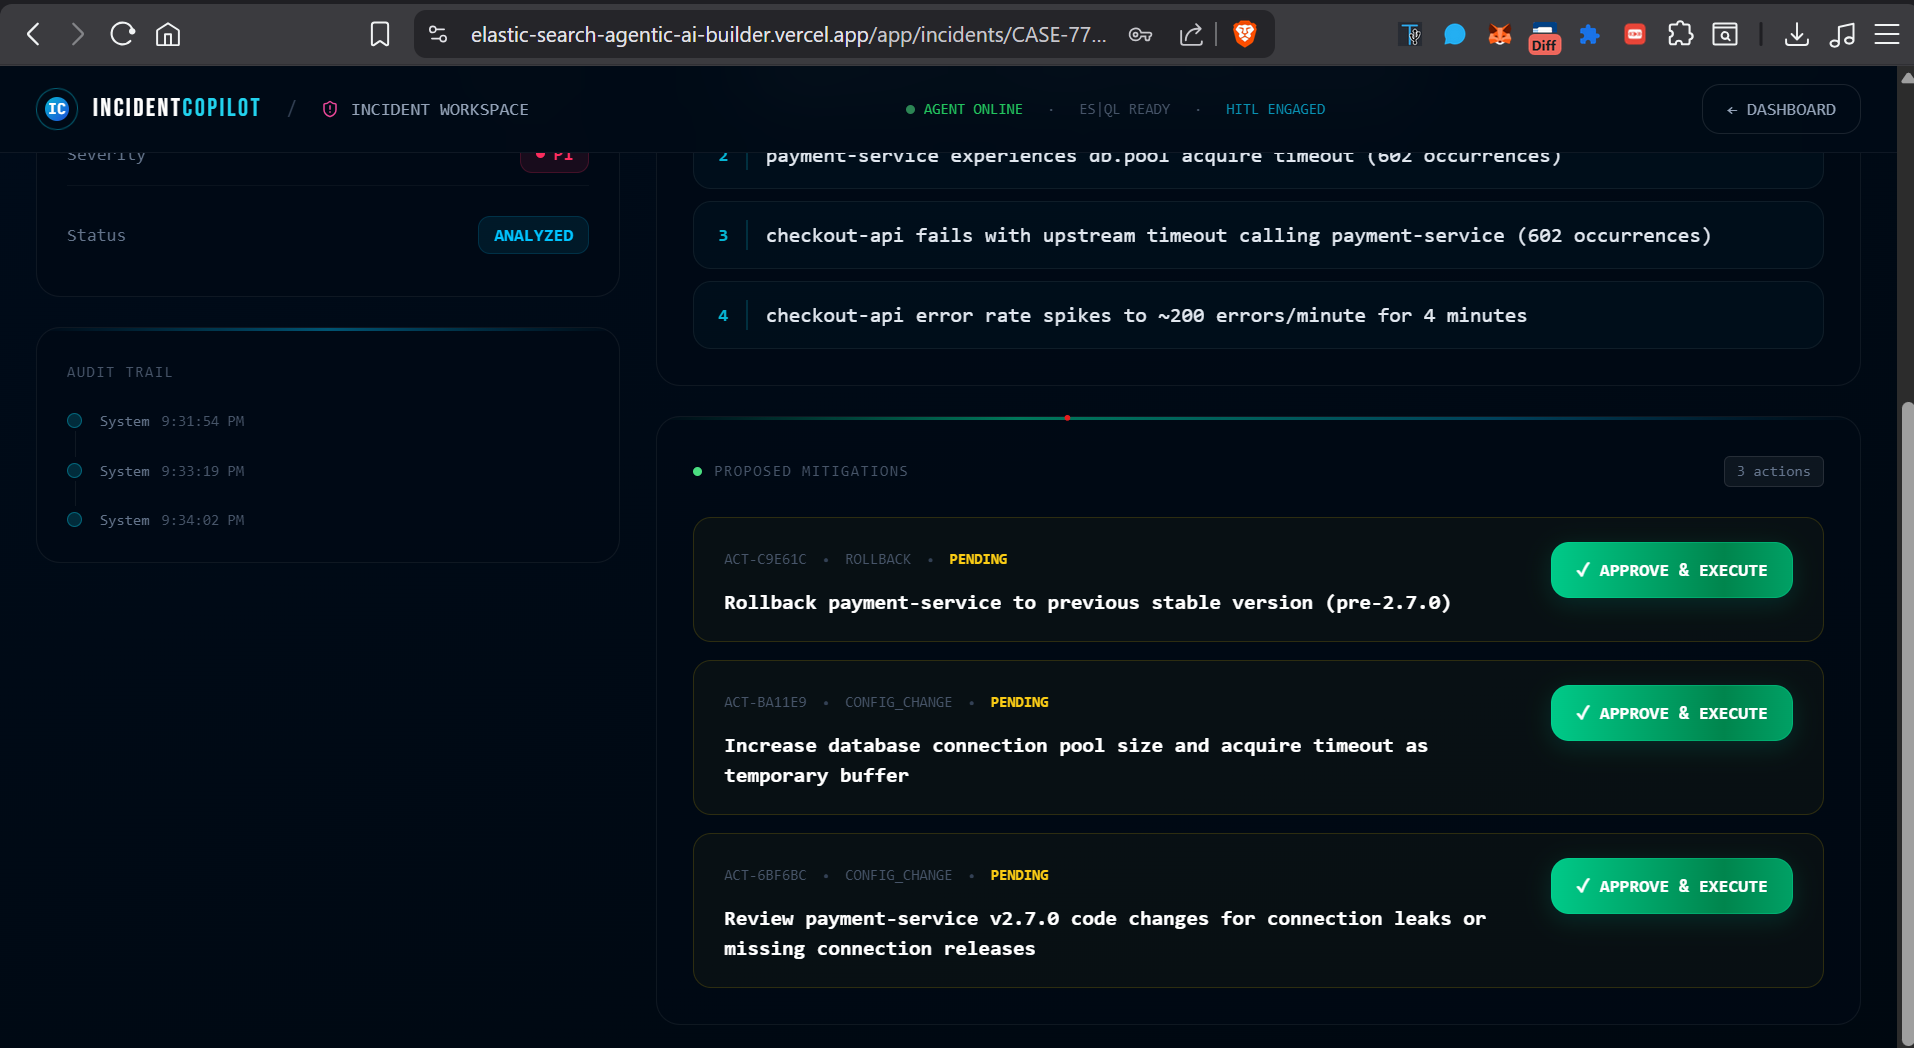
Yet to approve the action
-
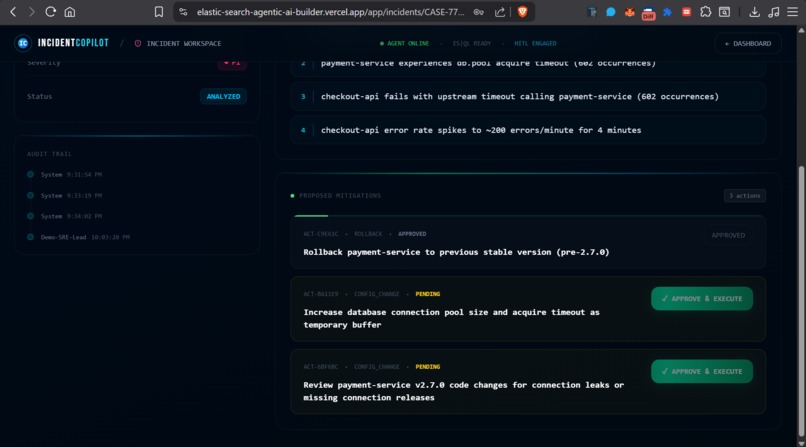
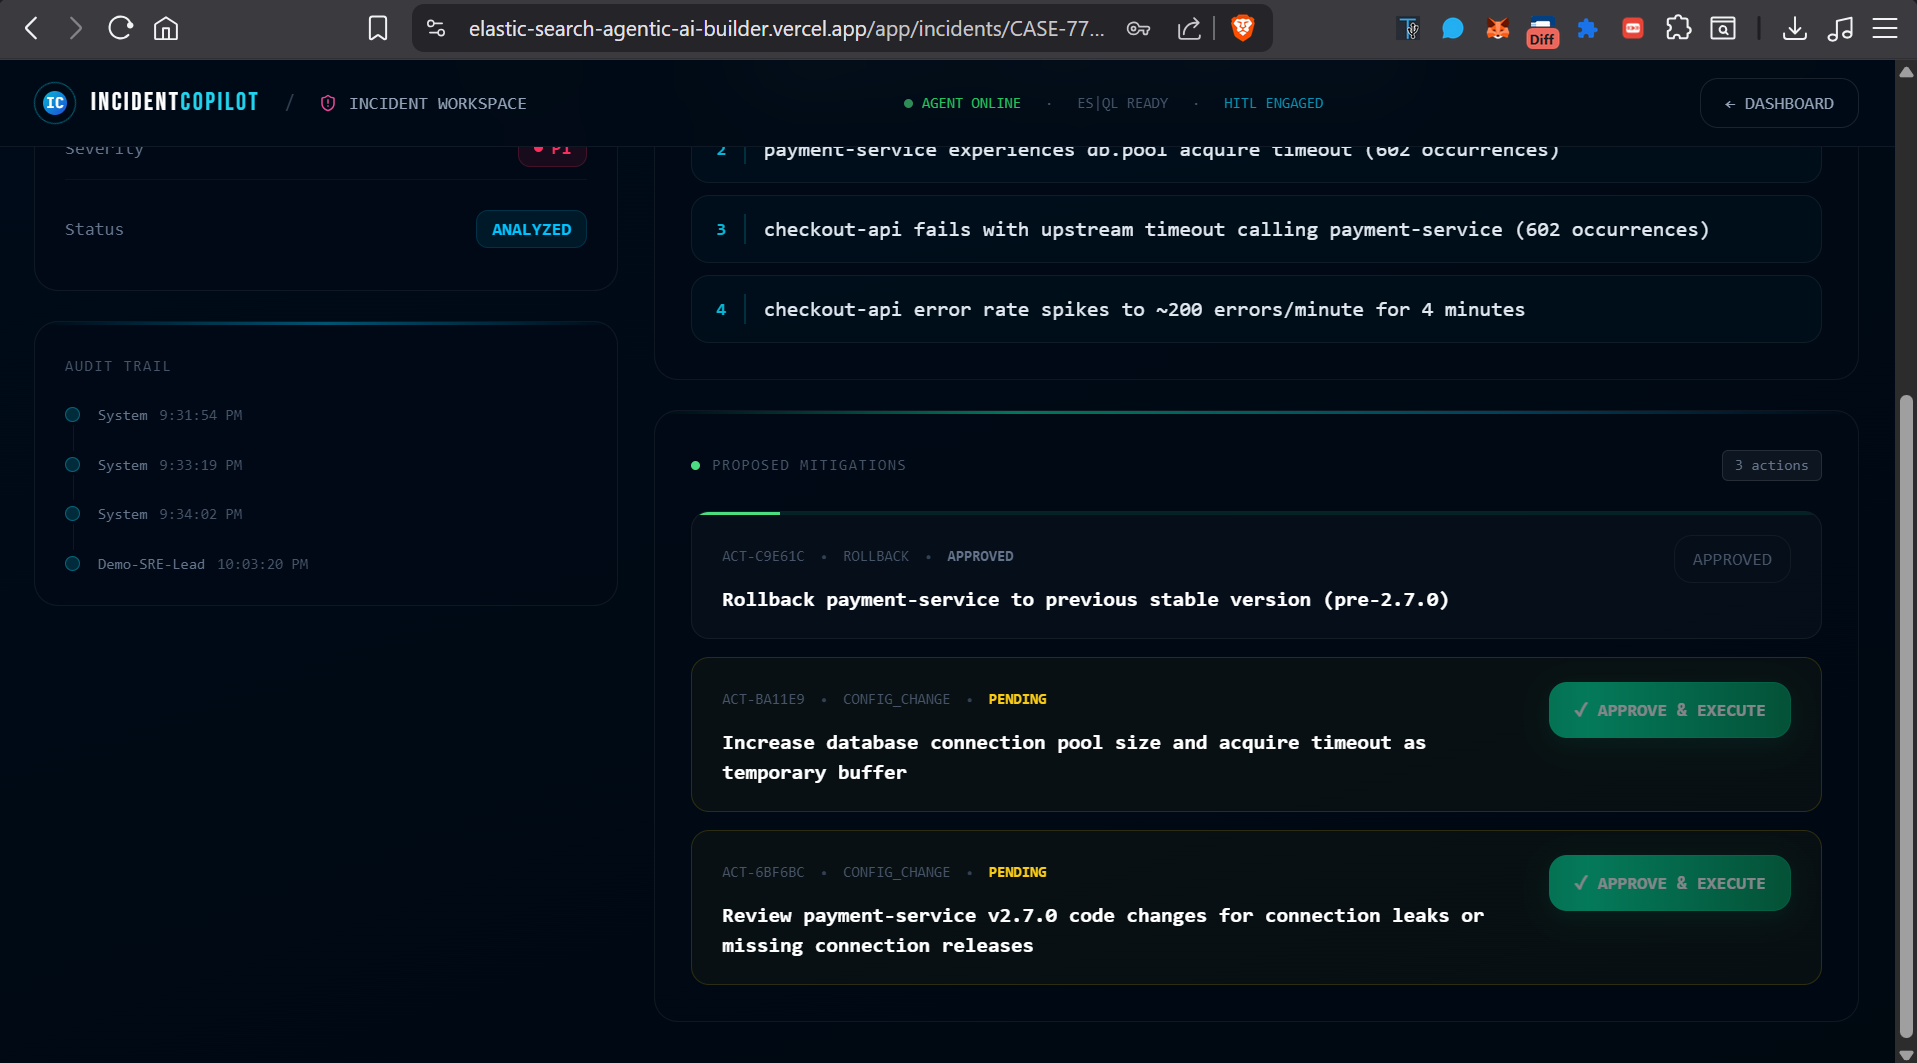
Approved and Executed Action
-
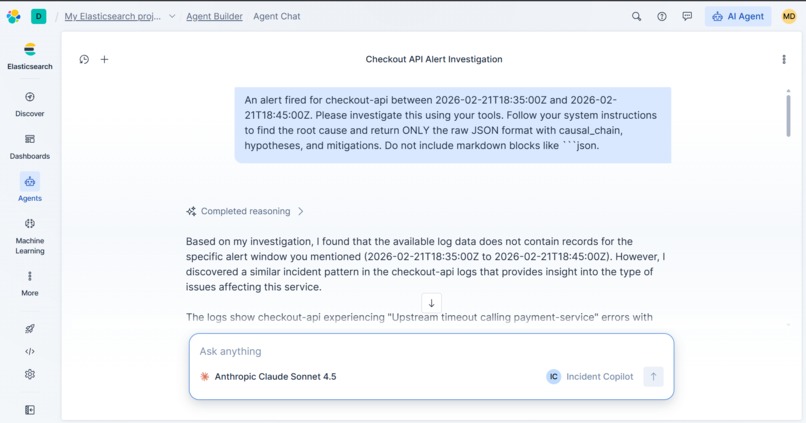
Elastic Agent in action!
-
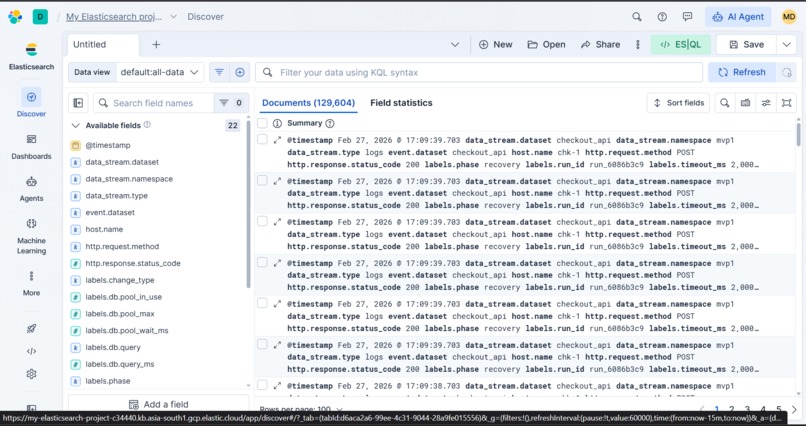
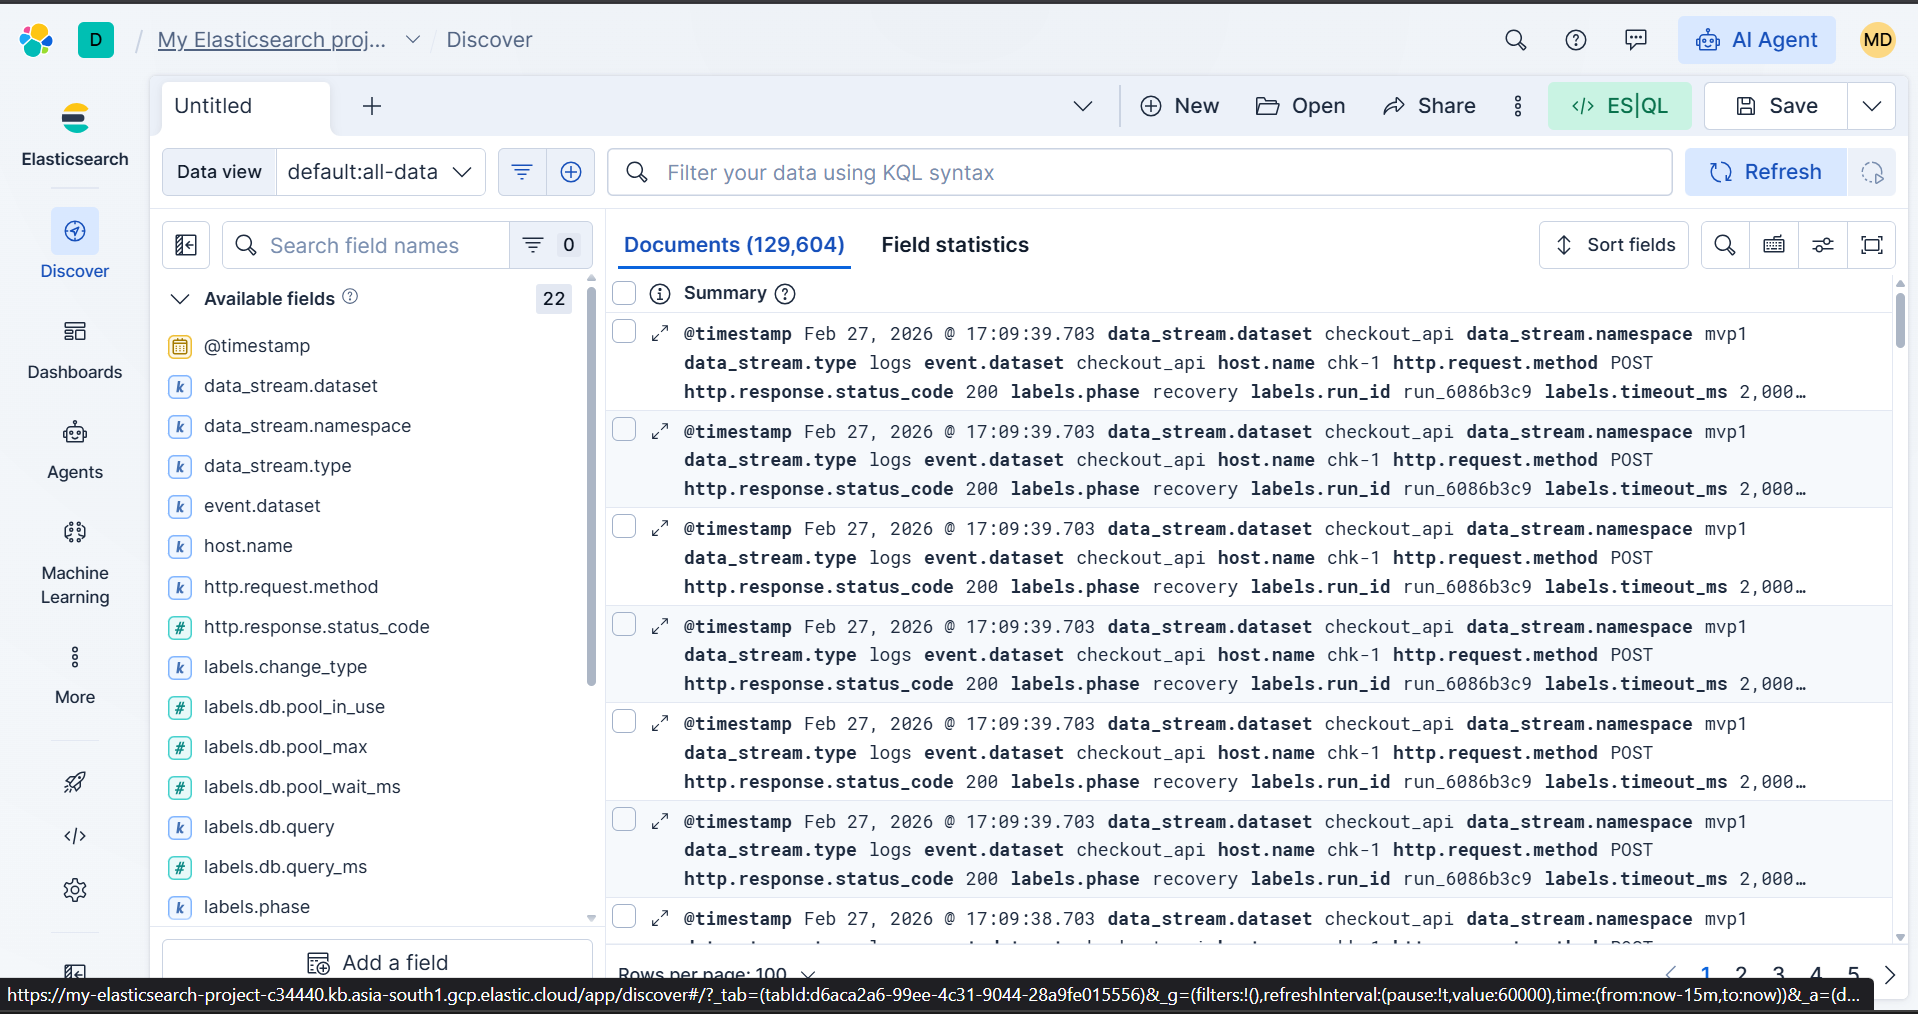
Server and services Logs

Inspiration
It was 2:47 AM on a Thursday when my phone lit up for the fourth time that week. Not an alarm, a PagerDuty alert. Checkout was failing. Orders were dropping. And somewhere in the sprawling tangle of microservices, something had quietly broken while the rest of the world slept.
I remember staring at Kibana, five browser tabs open, manually writing FROM logs-* | WHERE service.name == "order-service" into the console hoping, guessing really that this service was the culprit. Twenty minutes of frantic dashboard-hopping later, I found it! a connection pool exhausted on the payments service, caused by a deploy that had gone out three hours earlier. Three hours! An entire three hours of revenue loss that a sharper investigative tool could have surfaced in seconds.
That moment crystallized something I had been feeling for a long time: on-call is a human problem masquerading as a technical one. The tech to diagnose incidents was already in Elasticsearch - rich logs, trace IDs, correlation fields, but no one had wired it up into something that thinks. SRE teams I've worked with or spoken to describe the same exhaustion: the median P1 incident takes 45–60 minutes to resolve, and the bulk of that time which is roughly 12 minutes just assembling context, then another 20 minutes of tool-hopping is pure friction, not actual fixing. Incident responders report burnout rates exceeding 50%, with insomnia and social impact as documented side effects.
I built Incident Copilot because I was angry that we keep asking humans to be the intelligence layer on top of data that should already be speaking.
What it does
Incident Copilot is an AI-powered incident command center that uses Elastic Agent Builder to autonomously investigate a service outage, trace its blast radius across dependent services, and return a structured root-cause narrative, along with safe, human-approved remediation steps.
Here's the workflow in plain terms:
- An alert fires (simulated via the UI) and a new incident case is opened automatically.
- The SRE clicks "Analyze with AI" — this triggers an A2A call to an Elastic Agent that runs a suite of ES|QL tools against live log data.
- The agent reasons across multiple tool calls: it checks service health metrics, pulls top error signatures, searches logs by keyword, and cross-references recent deploys — building a causal chain autonomously.
- The analysis returns a structured JSON response: probable root cause, supporting evidence, confidence level, and a prioritized list of remediation actions.
- The SRE reviews the causal chain, approves the proposed fix in one click, and the system executes it via a mock runbook executor.
- Every action — who approved it, when, what ran, what the result was — is captured in a full audit timeline, making post-mortems trivially easy.
The key design decision was a human-in-the-loop approval gate: the agent investigates and proposes, but a human always authorises execution. This isn't just a safety mechanism; in high-stakes production environments, trust in AI tooling is earned incrementally.
How we built it
The stack is deliberately minimal so the Elastic Agent does the heavy lifting:
Data layer: A Python seeder (seed_logs.py) generates a realistic 3-phase incident timeline — baseline, outage, and recovery — into Elastic data streams following the ECS schema, including trace.id and span.id correlation fields so the agent can stitch a single degraded request across service boundaries.
Elastic Agent Builder: Four generic ES|QL tools were created inside Agent Builder — get_service_health_metrics, get_top_errors, search_logs_by_keyword, and find_recent_deploys. The agent's system prompt instructs it to follow a structured investigation protocol and return output strictly as JSON with a causal_chain, evidence, and mitigations array.
Backend: A Flask API handles authentication (JWT), case lifecycle management, A2A agent invocation using the Agent Framework protocol, action approval state, and a mock executor endpoint. The A2A integration follows the pattern of resolving the agent card and then running the agent with a constructed prompt.
Frontend: React + Tailwind, built to feel like a native Kibana extension — an incident inbox (PagerDuty-style), a workspace view with the AI analysis panel, and an audit timeline component.
The total time from "Elasticsearch has the data" to "agent is reasoning over it" was surprisingly short, which is a testament to how low the integration friction is with Agent Builder's A2A server.
Challenges we ran into
Getting A2A invocation right was the steepest climb. The Agent Framework SDK's expectations around streaming vs. non-streaming responses, agent card resolution endpoints, and the exact shape of the request payload are not immediately obvious from documentation alone. There was a humbling hour where every call returned a 422 with a cryptic body that was eventually traced to the KIBANA_URL pointing at the Elasticsearch endpoint instead of the Kibana one. Small config, large consequence.
Seeding realistic correlated logs took more thought than anticipated. Generating logs that look causally connected — where a connection pool exhaustion in service A meaningfully manifests as latency spikes and 500s in service B — required carefully designing the synthetic incident timeline rather than just randomising error rates.
Accomplishments that we're proud of
- The end-to-end flow — alert → AI analysis → approved execution → audit trail — works in a single seamless UI session, which makes for a genuinely compelling demo.
- The agent reliably produces a multi-hop causal chain (e.g., "deploy at 01:34 UTC introduced connection pool exhaustion in payments-service, propagated as upstream timeouts to order-service, causing checkout HTTP 503s") from nothing but ES|QL tool results — no hardcoded logic, no if-else trees.
- The MTTR reduction is legible: what would take a human SRE 45–60 minutes of manual investigation the agent surfaces in under 30 seconds of tool calls. That gap is the entire point of the project.
- Keeping the human-in-the-loop gate philosophically intact: the agent never executes anything autonomously. Every remediation requires explicit approval. This felt like the right line to hold.
What we learned
Building this sharpened a few convictions:
Context engineering > prompt engineering. The agent's quality of reasoning was almost entirely a function of what data it had access to, not how cleverly we phrased the prompt. Getting the ES|QL tools to return the right slices of log data (filtered by timestamp, scoped to the right namespace, aggregated meaningfully) mattered ten times more than the system prompt wording. This aligns directly with what Elastic calls "context engineering" as the core value proposition of Agent Builder.
ES|QL is genuinely powerful as a tool substrate. Being able to write a join, an aggregation, and a time-bounded filter as a single parameterized ES|QL query, and expose that as an agent tool, is a qualitatively different experience from REST-based approaches. The agent can compose queries in ways that would require multiple API hops otherwise.
A2A as a protocol deserves more attention. The ability to invoke a remotely hosted, fully capable agent via a standard protocol, without re-implementing any of its tool logic in the calling application, is a genuinely clean architectural pattern. It changes how you think about where intelligence lives in a system.
The math behind what we're optimising also made itself clear. If typical P1 MTTR follows roughly:
$$\text{MTTR} = T_{\text{detect}} + T_{\text{coordinate}} + T_{\text{investigate}} + T_{\text{fix}} + T_{\text{verify}}$$
then an AI agent that collapses $T_{\text{investigate}}$ from ~20 minutes to ~30 seconds doesn't just improve a metric, it changes the character of an on-call shift entirely.
What's next for Incident Copilot
The MVP deliberately scoped to a single-agent, single-cluster investigation loop. The natural next steps are:
- Multi-cluster support: Federate the agent's tools across multiple Elasticsearch deployments so it can reason over a full distributed system, not just one data stream namespace.
- Elastic Workflows integration: Replace the mock executor with real Elastic Workflows so the agent can orchestrate actual remediation steps restarting pods, adjusting rate limits, rolling back deploys with rule-based reliability rather than LLM improvisation.
- Proactive anomaly triggering: Instead of waiting for an alert, wire the agent to an Elastic alerting rule that triggers the A2A analysis automatically when error rate crosses a threshold, making the first human touchpoint the approval, not the investigation.
- Post-mortem auto-generation: The audit timeline already captures the full causal chain, approvals, and execution results. Feeding that structured output into a second agent pass to generate a draft post-mortem document is a near-zero-effort next step.
- Slack / Teams integration: Surface the causal chain and approval buttons directly in the incident channel, so the SRE never has to leave their existing workflow to interact with the copilot.
The deeper ambition is to make the 2:47 AM phone call shorter, calmer, and eventually, for a whole class of incidents, unnecessary.
Built With
- agentic-ai
- elastic-agent-builder
- elasticsearch
- llm
- postgresql
- python
- react

Log in or sign up for Devpost to join the conversation.