
Inspiration
We wanted to make the world a better place by identifying the places in the world that need the most aid.
What it does
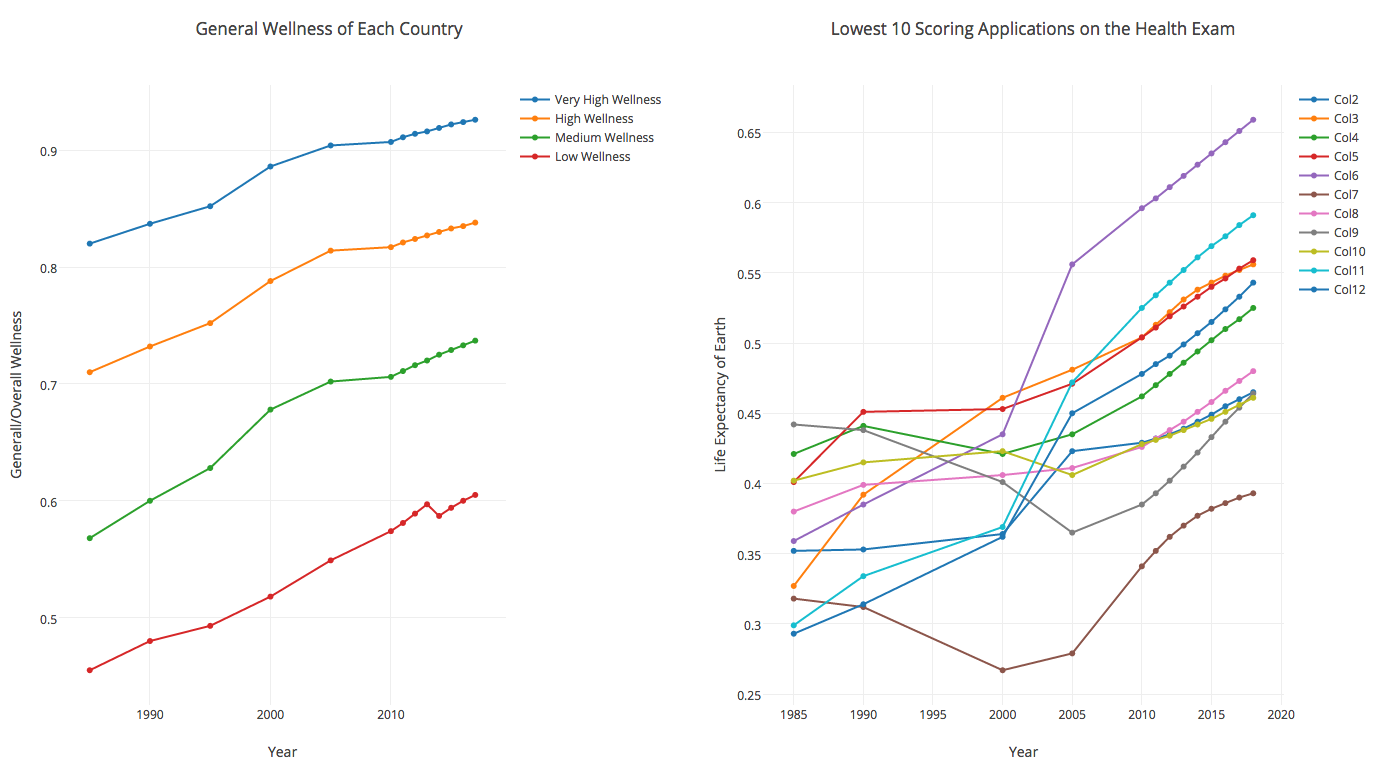
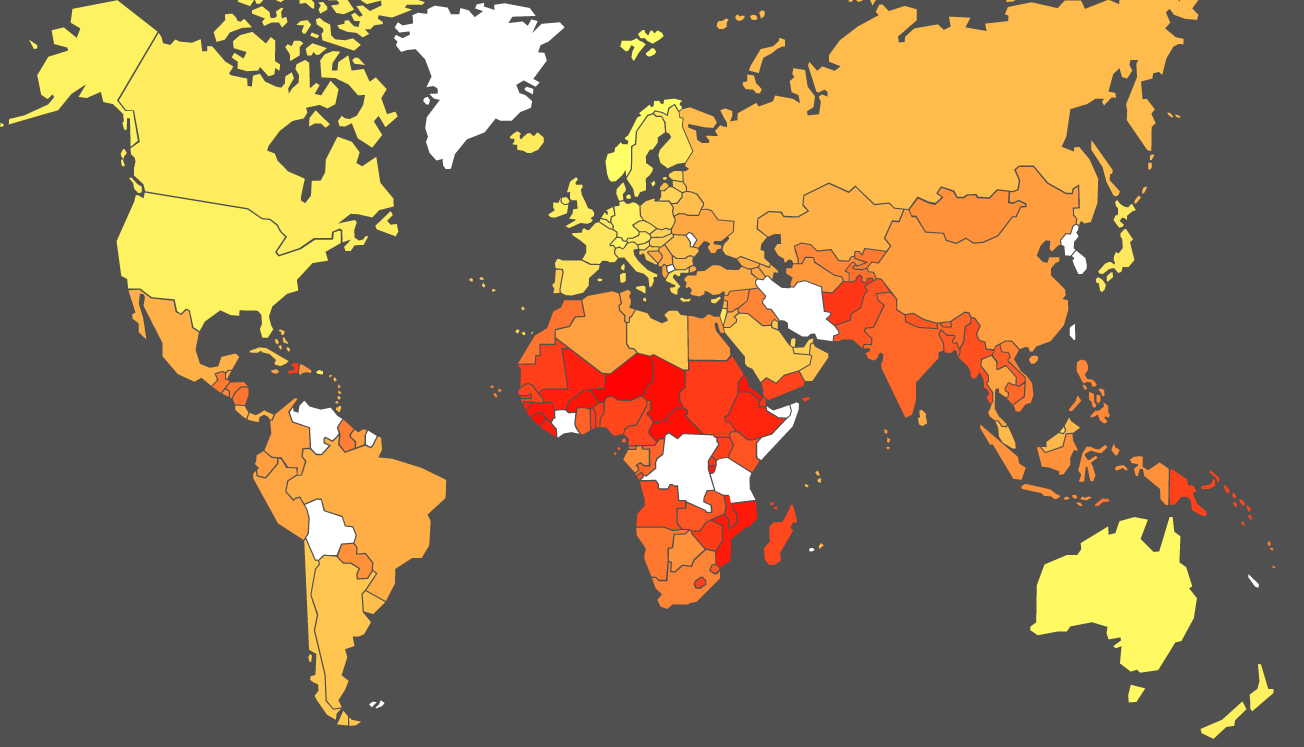
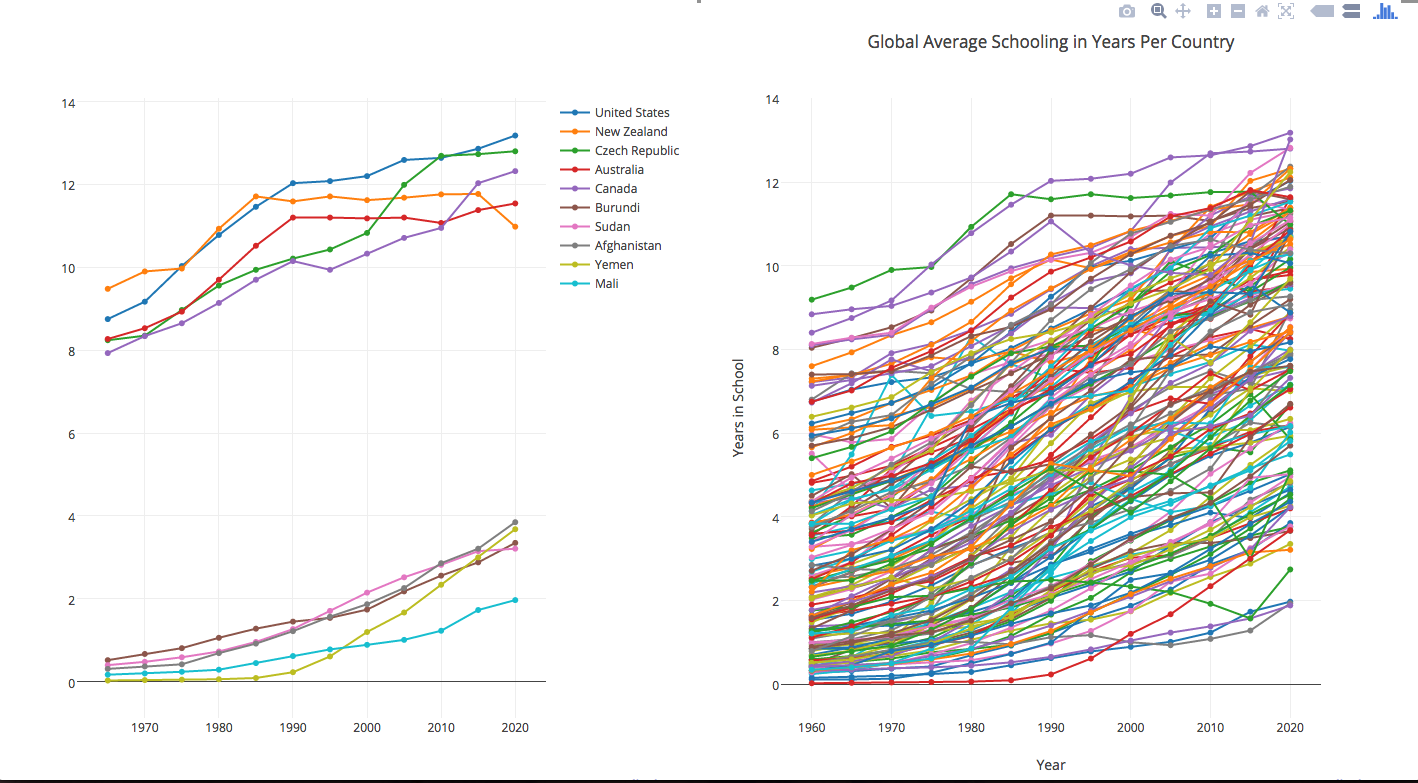
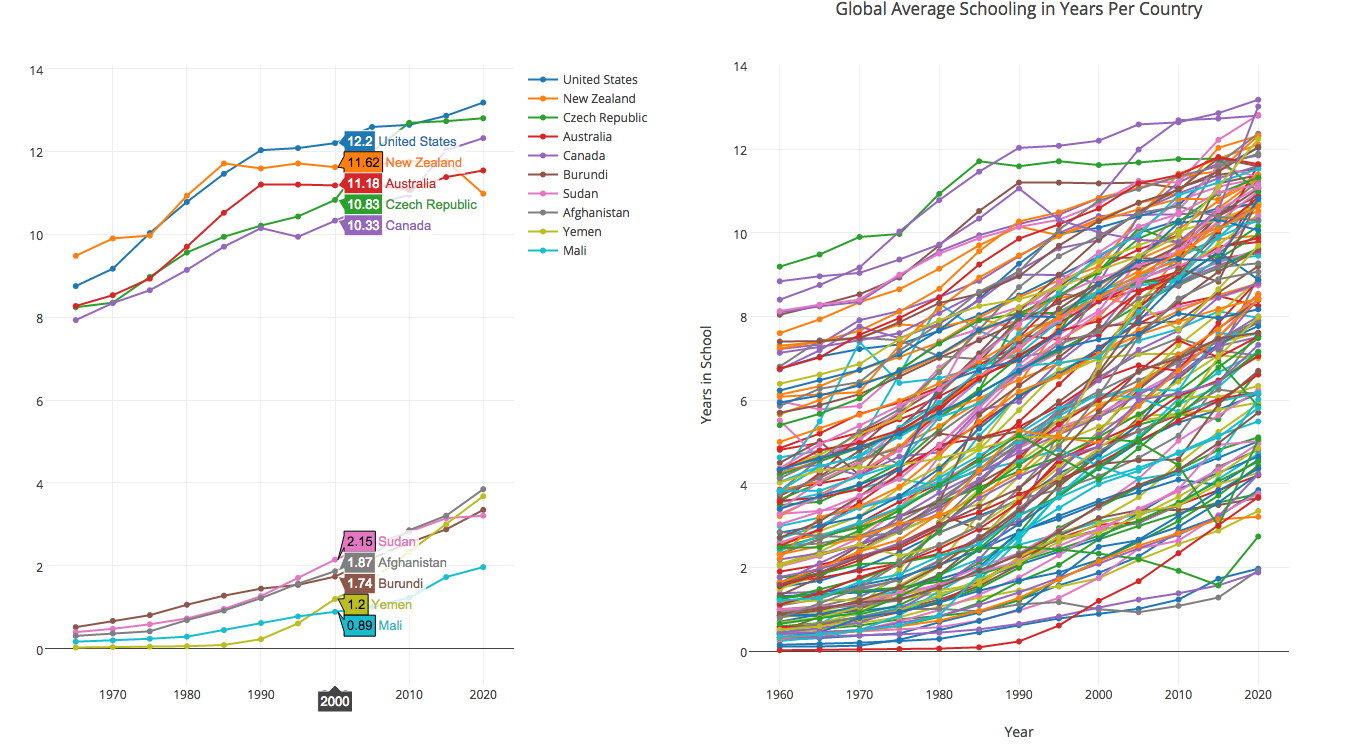
Impactus takes online datasets about global human development and uses that data to predict the future trends in the human development of specific countries. This is then visualized both on a world map for comparison and in graphical form.
How I built it
We tapped into open source software to be able to develop the map and used a combination of javascript, html, and css to add our own data and clean up the website as a whole. In order to analyze the data, we used python or r.
Challenges I ran into
We ran into great difficulty trying to get the map to respond to our data (we made it change colors based on the values in the dataset). We also had difficulty implementing the Kiva API to show samples of user accounts in each country.
Accomplishments that I'm proud of
This was the first project that we've ever actually completed! We're both pretty new to hackathons so it was really satisfying to have a project to submit!
What I learned
It's really good to have a clear idea of what you want to do at the beginning.

Log in or sign up for Devpost to join the conversation.