-
-
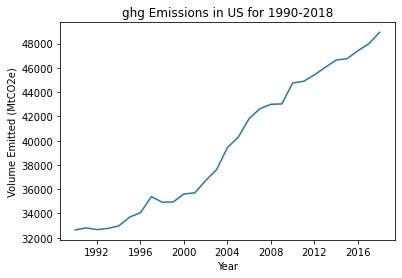
Yearly Average Greenhouse Gas Emissions in the US (1990-2018)
-
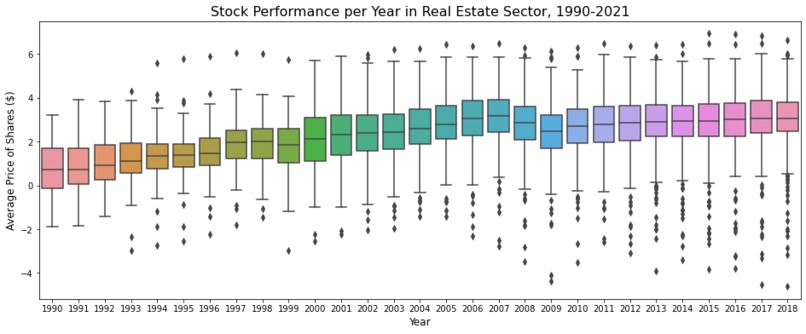
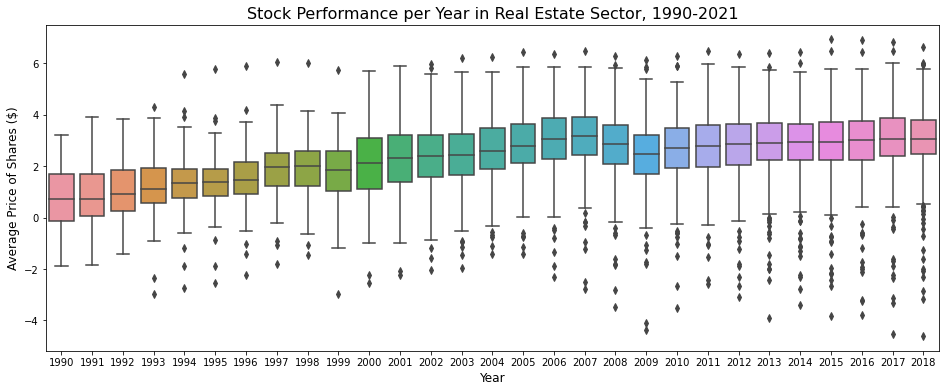
Yearly Average Price of Shares for US Stocks in the Real Estate Sector (1990-2021)
-
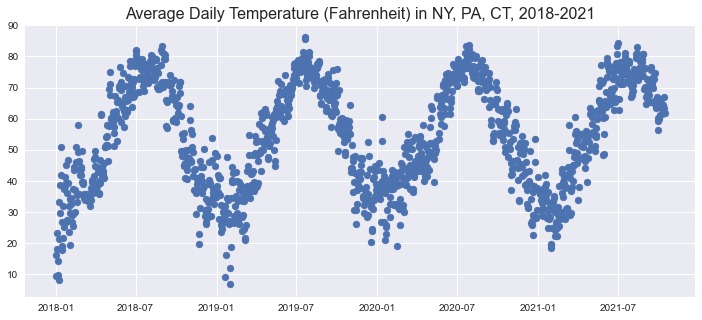
Average Daily Temperature (Fahrenheit) in NY, PA, CT (2018-2021)
-
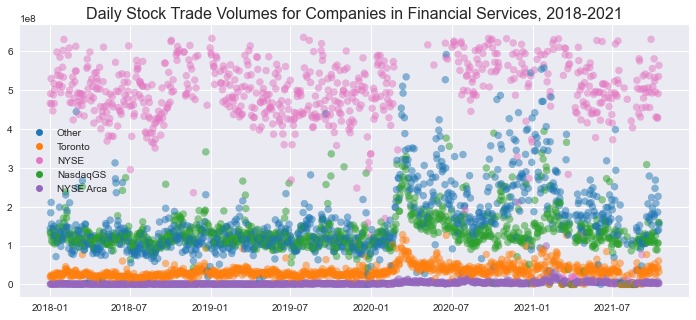
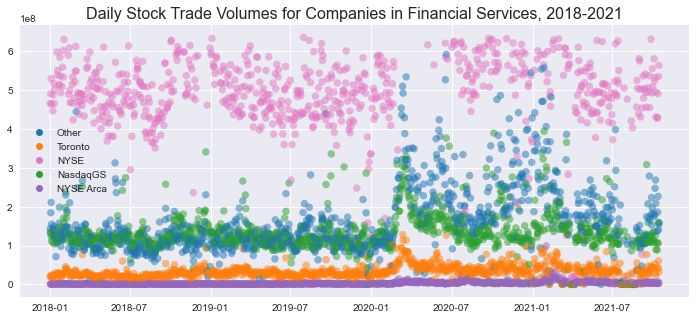
Daily Stock Trade Volumes for Companies in Financial Services (2018-2021)


Inspiration
- The stock market has always been a dynamic presentation of both economic activities and energy consumption across countries and economic sectors. Stock market activities are hence expected to have a significant effect on environment indicators such as CO2 emissions, greenhouse gas emissions etc.
- Many studies find that weather has a close relationship with human’s mood and behavior. Hence, weather factors might also have an impact on stock return and trading volume.
- We are interested in exploring how environment and weather indicators and stock markets are correlated and tied together. Our results can enable us to build models to predict risk events and discover investment opportunities based on environmental variations
What you learned:
- Working with a new data warehouse platform and new data. None of us has worked with Snowflake before so it was a hurdle at the beginning to get used to the platform and extract data we need for our analysis. Yet it was a great learning experience as we all learned so much from looking into it together. Representatives from Goldman Sachs were very approachable and helpful with that too (Thanks Janeen!). We also built up our domain knowledge when researching the problem to understand and analyze the given financial and environmental data.
- Work with big data and collaborative coding
- Collaboration! Our team never met before and it was a bit challenging to communicate given different time zones and virtual-in-person situation. Yet we made a great team and helped each other learn a lot about technical knowledge, project management, and communication.
How you built your project
- Get used to the data set and research the problem, define our hypothesis
- Get familiar with the Snowflake platform and unload data to Python for analysis
- Clean data, EDA, deciding on visualizations
- Built the interactive programming tool
- Test product
- Further details are presented in the slide deck attached
Challenges
- Communication online/ in-person, plus (3) different timezones :)!
- Unfamiliarity with new data storage platform
- Deal with limitations in the dataset:
- Lack of data documentation in the data sources made it difficult to understand the variables and interpret the analysis results. We missed a few instances of data cleaning that were quite obvious to us late during the project. For example, there were some instances where the “High” in a single day was in the millions. Cross checking with the history online showed this to be obviously false. Similarly, when comparing to some of the indicators, some features like “Price” are averaged over entire years. This is a gross oversimplification of a sensitive market such as the stock market, but this is helpful in seeing a general trend.
- Environment indicators data were only available on a yearly estimates, while stock prices are volatile by day/hours. This makes it more challenging to correctly identify the correlation of these two factors.


Log in or sign up for Devpost to join the conversation.