Inspiration
The idea for ImpactLabs grew out of our time in the Mercedes-Benz BeVisioneers Fellowship, a program that helps fellows build their own sustainibility project.
While working on our own projects, we kept running into the same wall: collecting data, tracking outcomes, and putting together a professional report was often just as hard as building the project itself. And the more we looked around, the more we realized this wasn't just our problem. Nonprofits, student initiatives, and social enterprises everywhere are creating real change, but struggling to showcase it with the data that they gathered. That's why we built ImpactLabs.
What it does
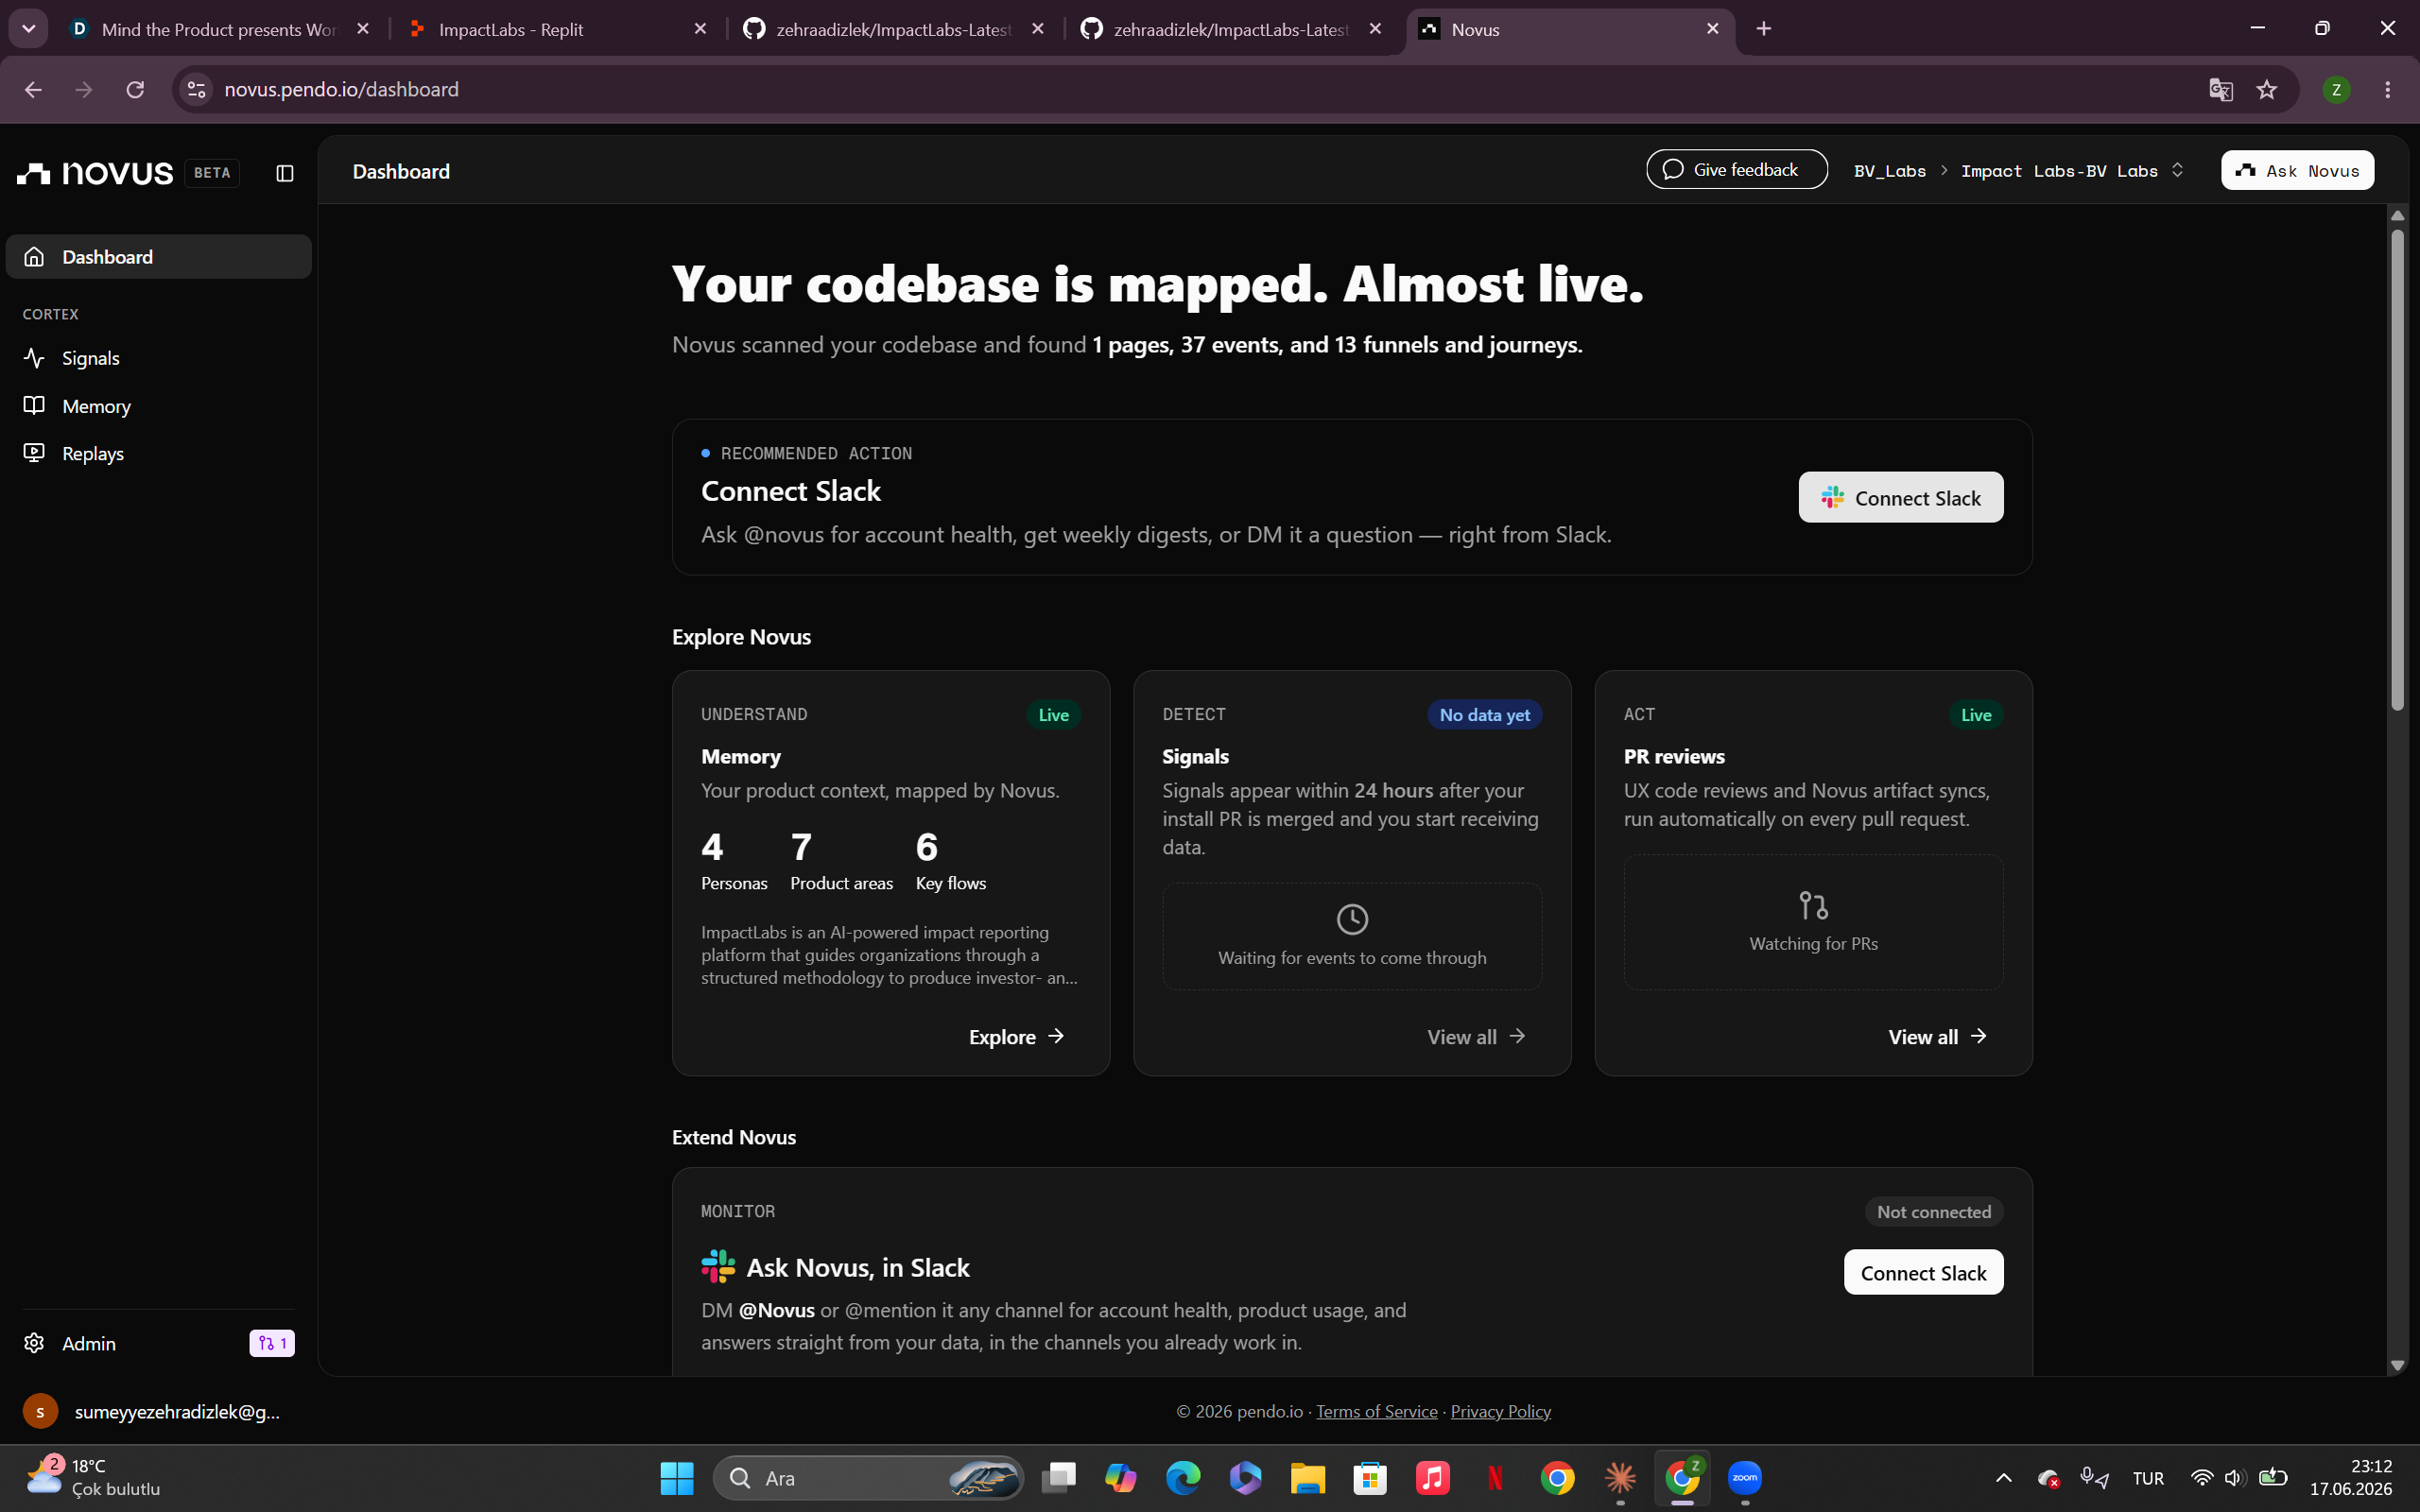
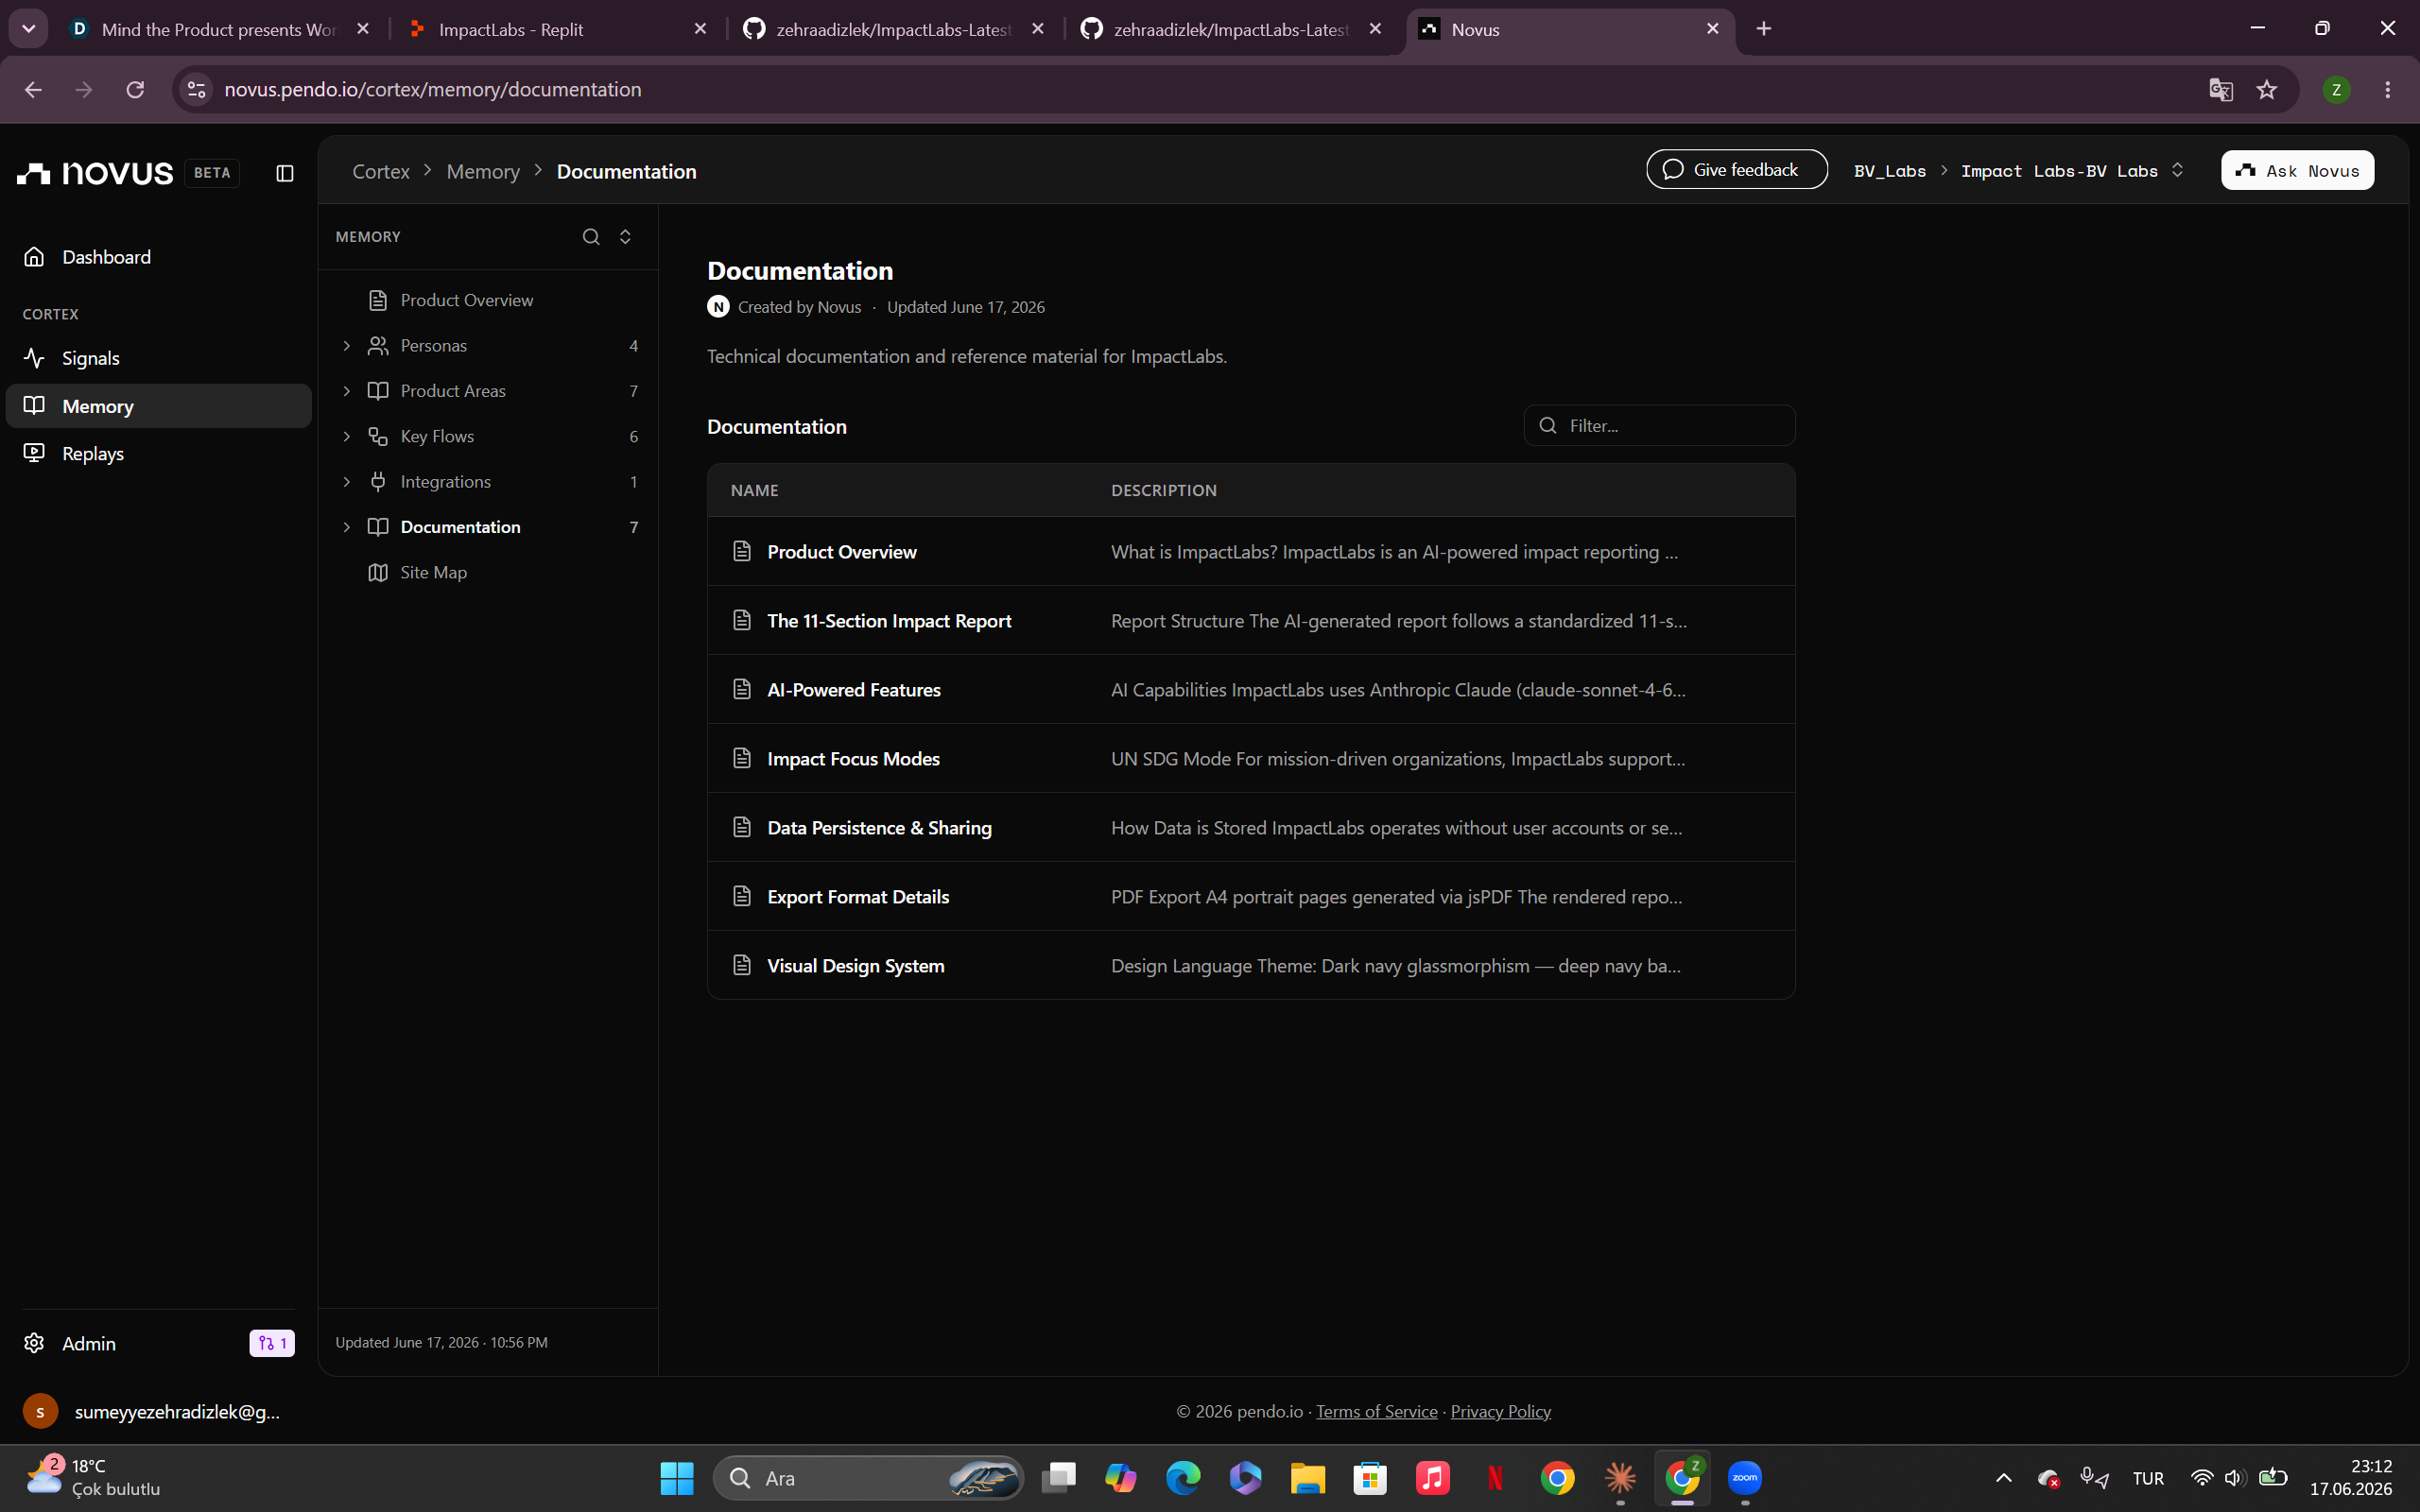
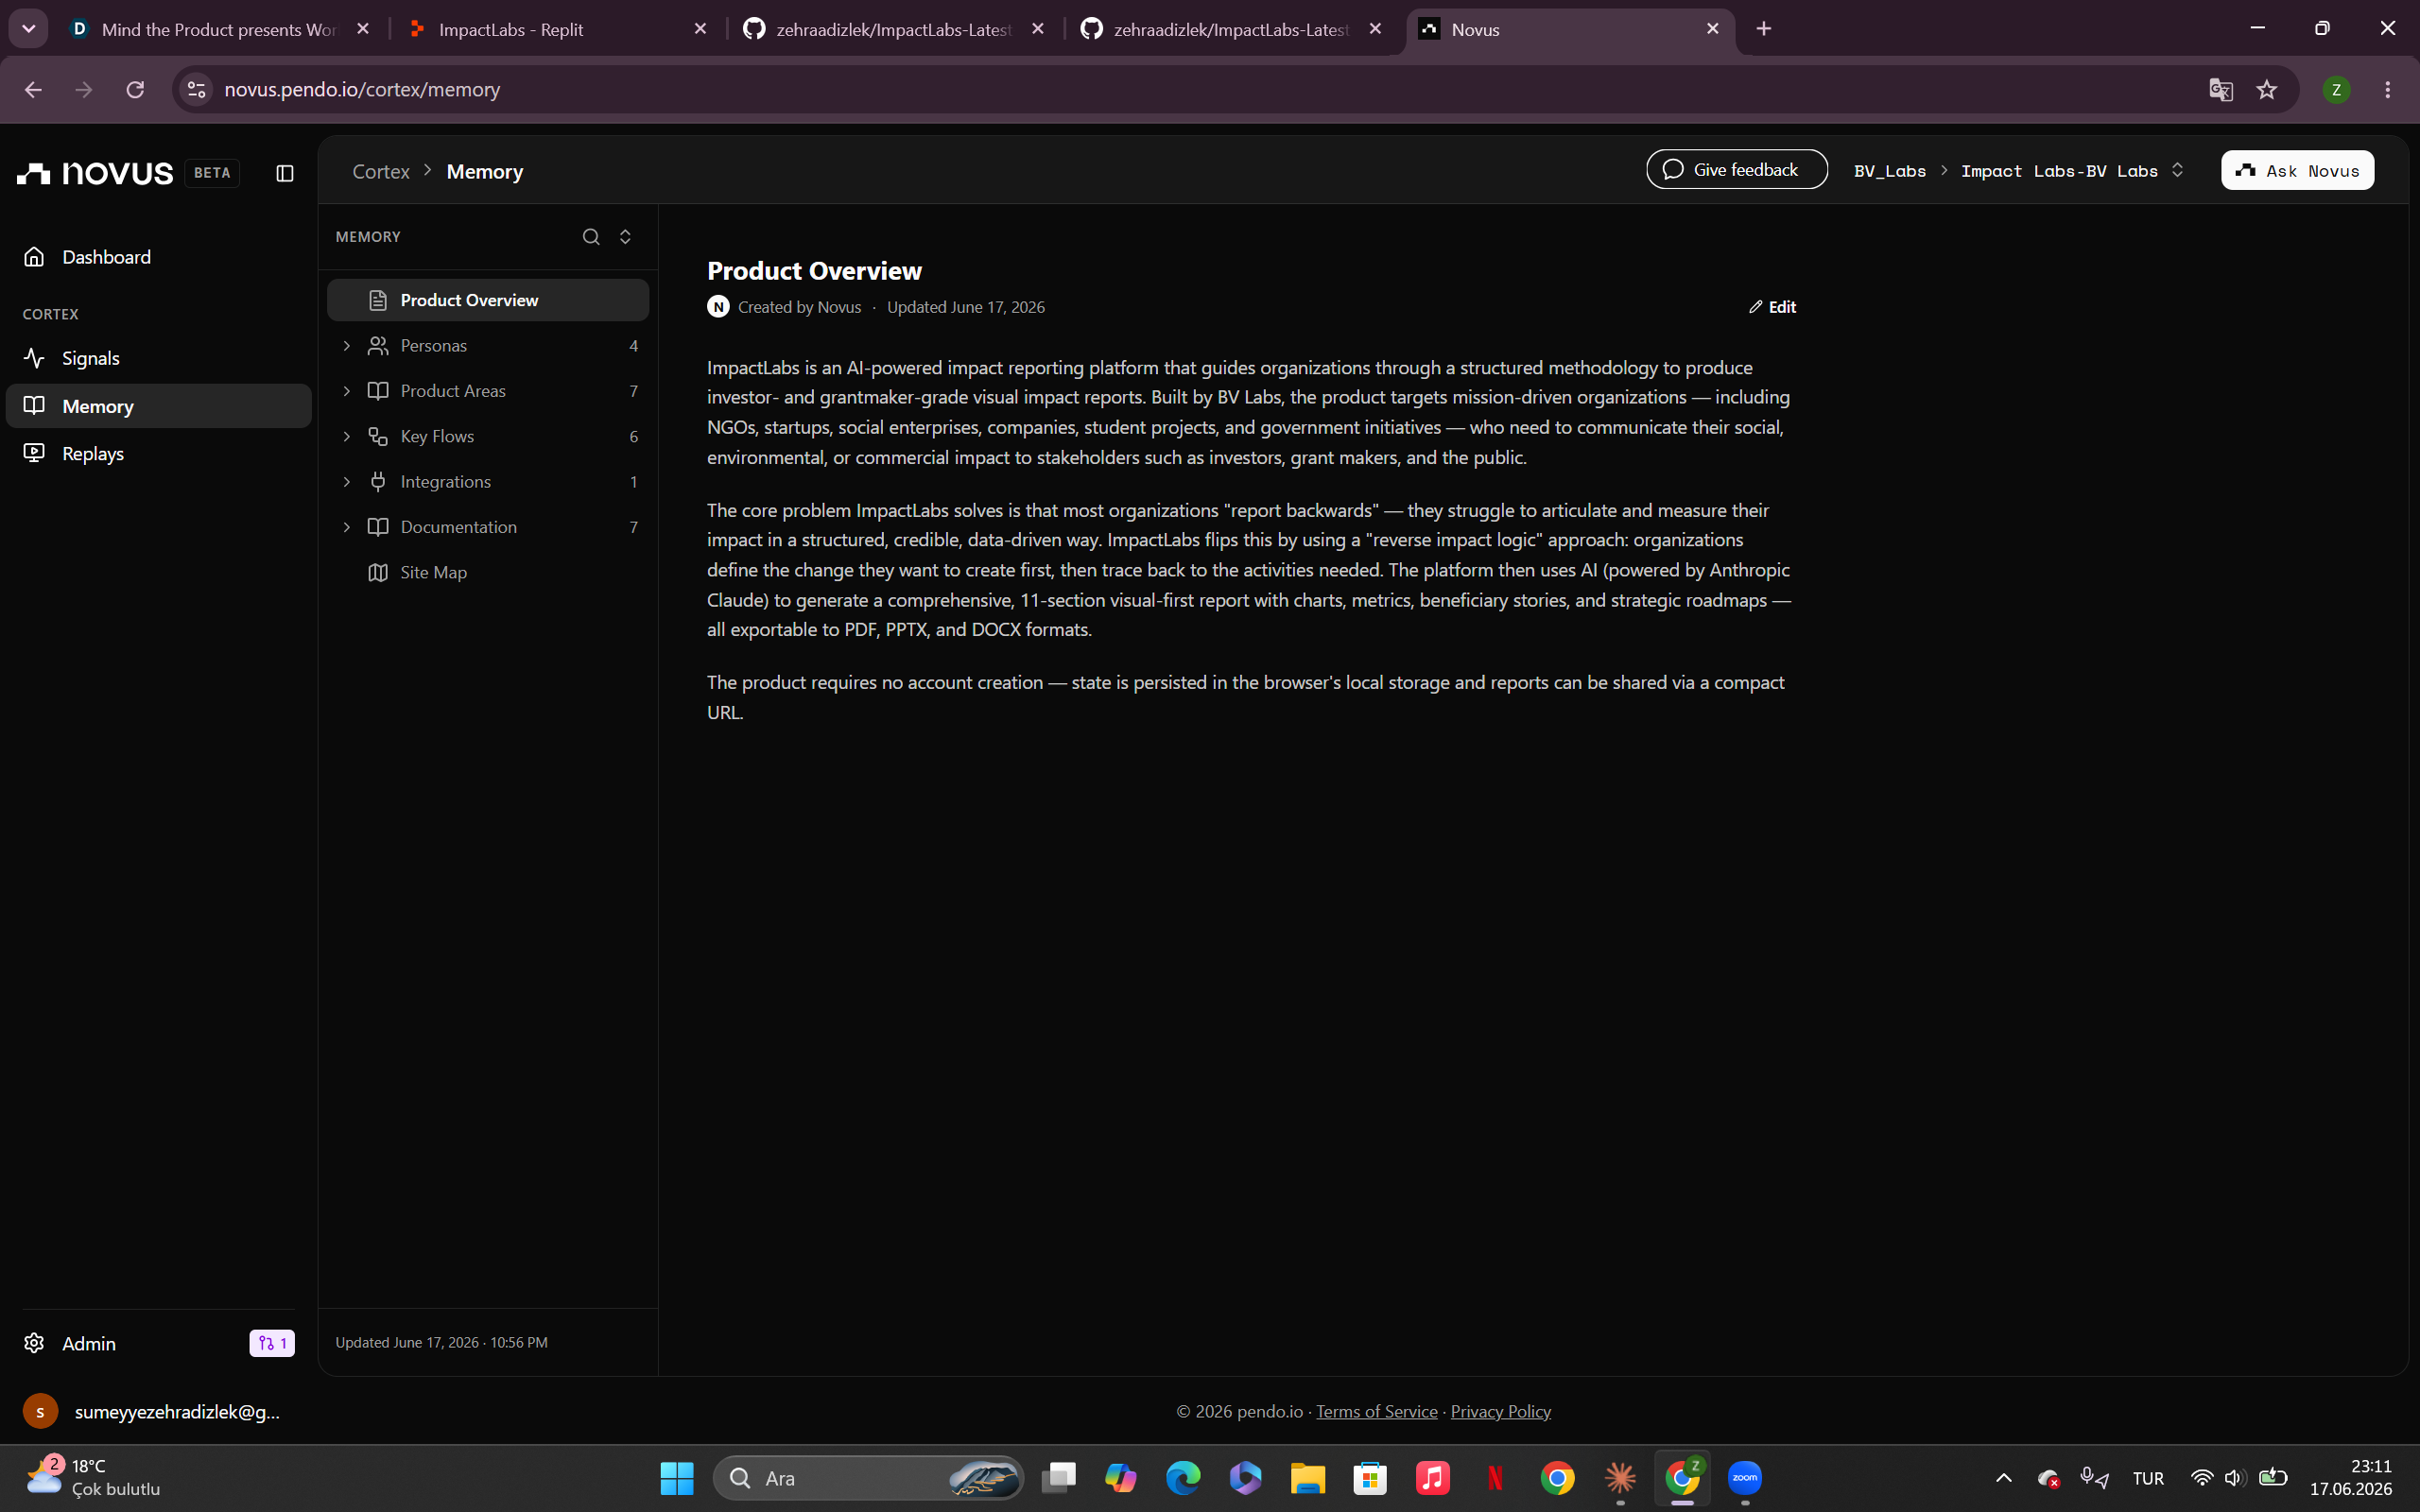
ImpactLabs is an AI-powered platform that helps organizations generate professional impact reports from the data they already have.
Users enter information about their activities, beneficiaries, outcomes, and key metrics. The platform then turns that into a structured report, complete with insights, summaries, visualizations, and content ready to share with stakeholders.
How we built it
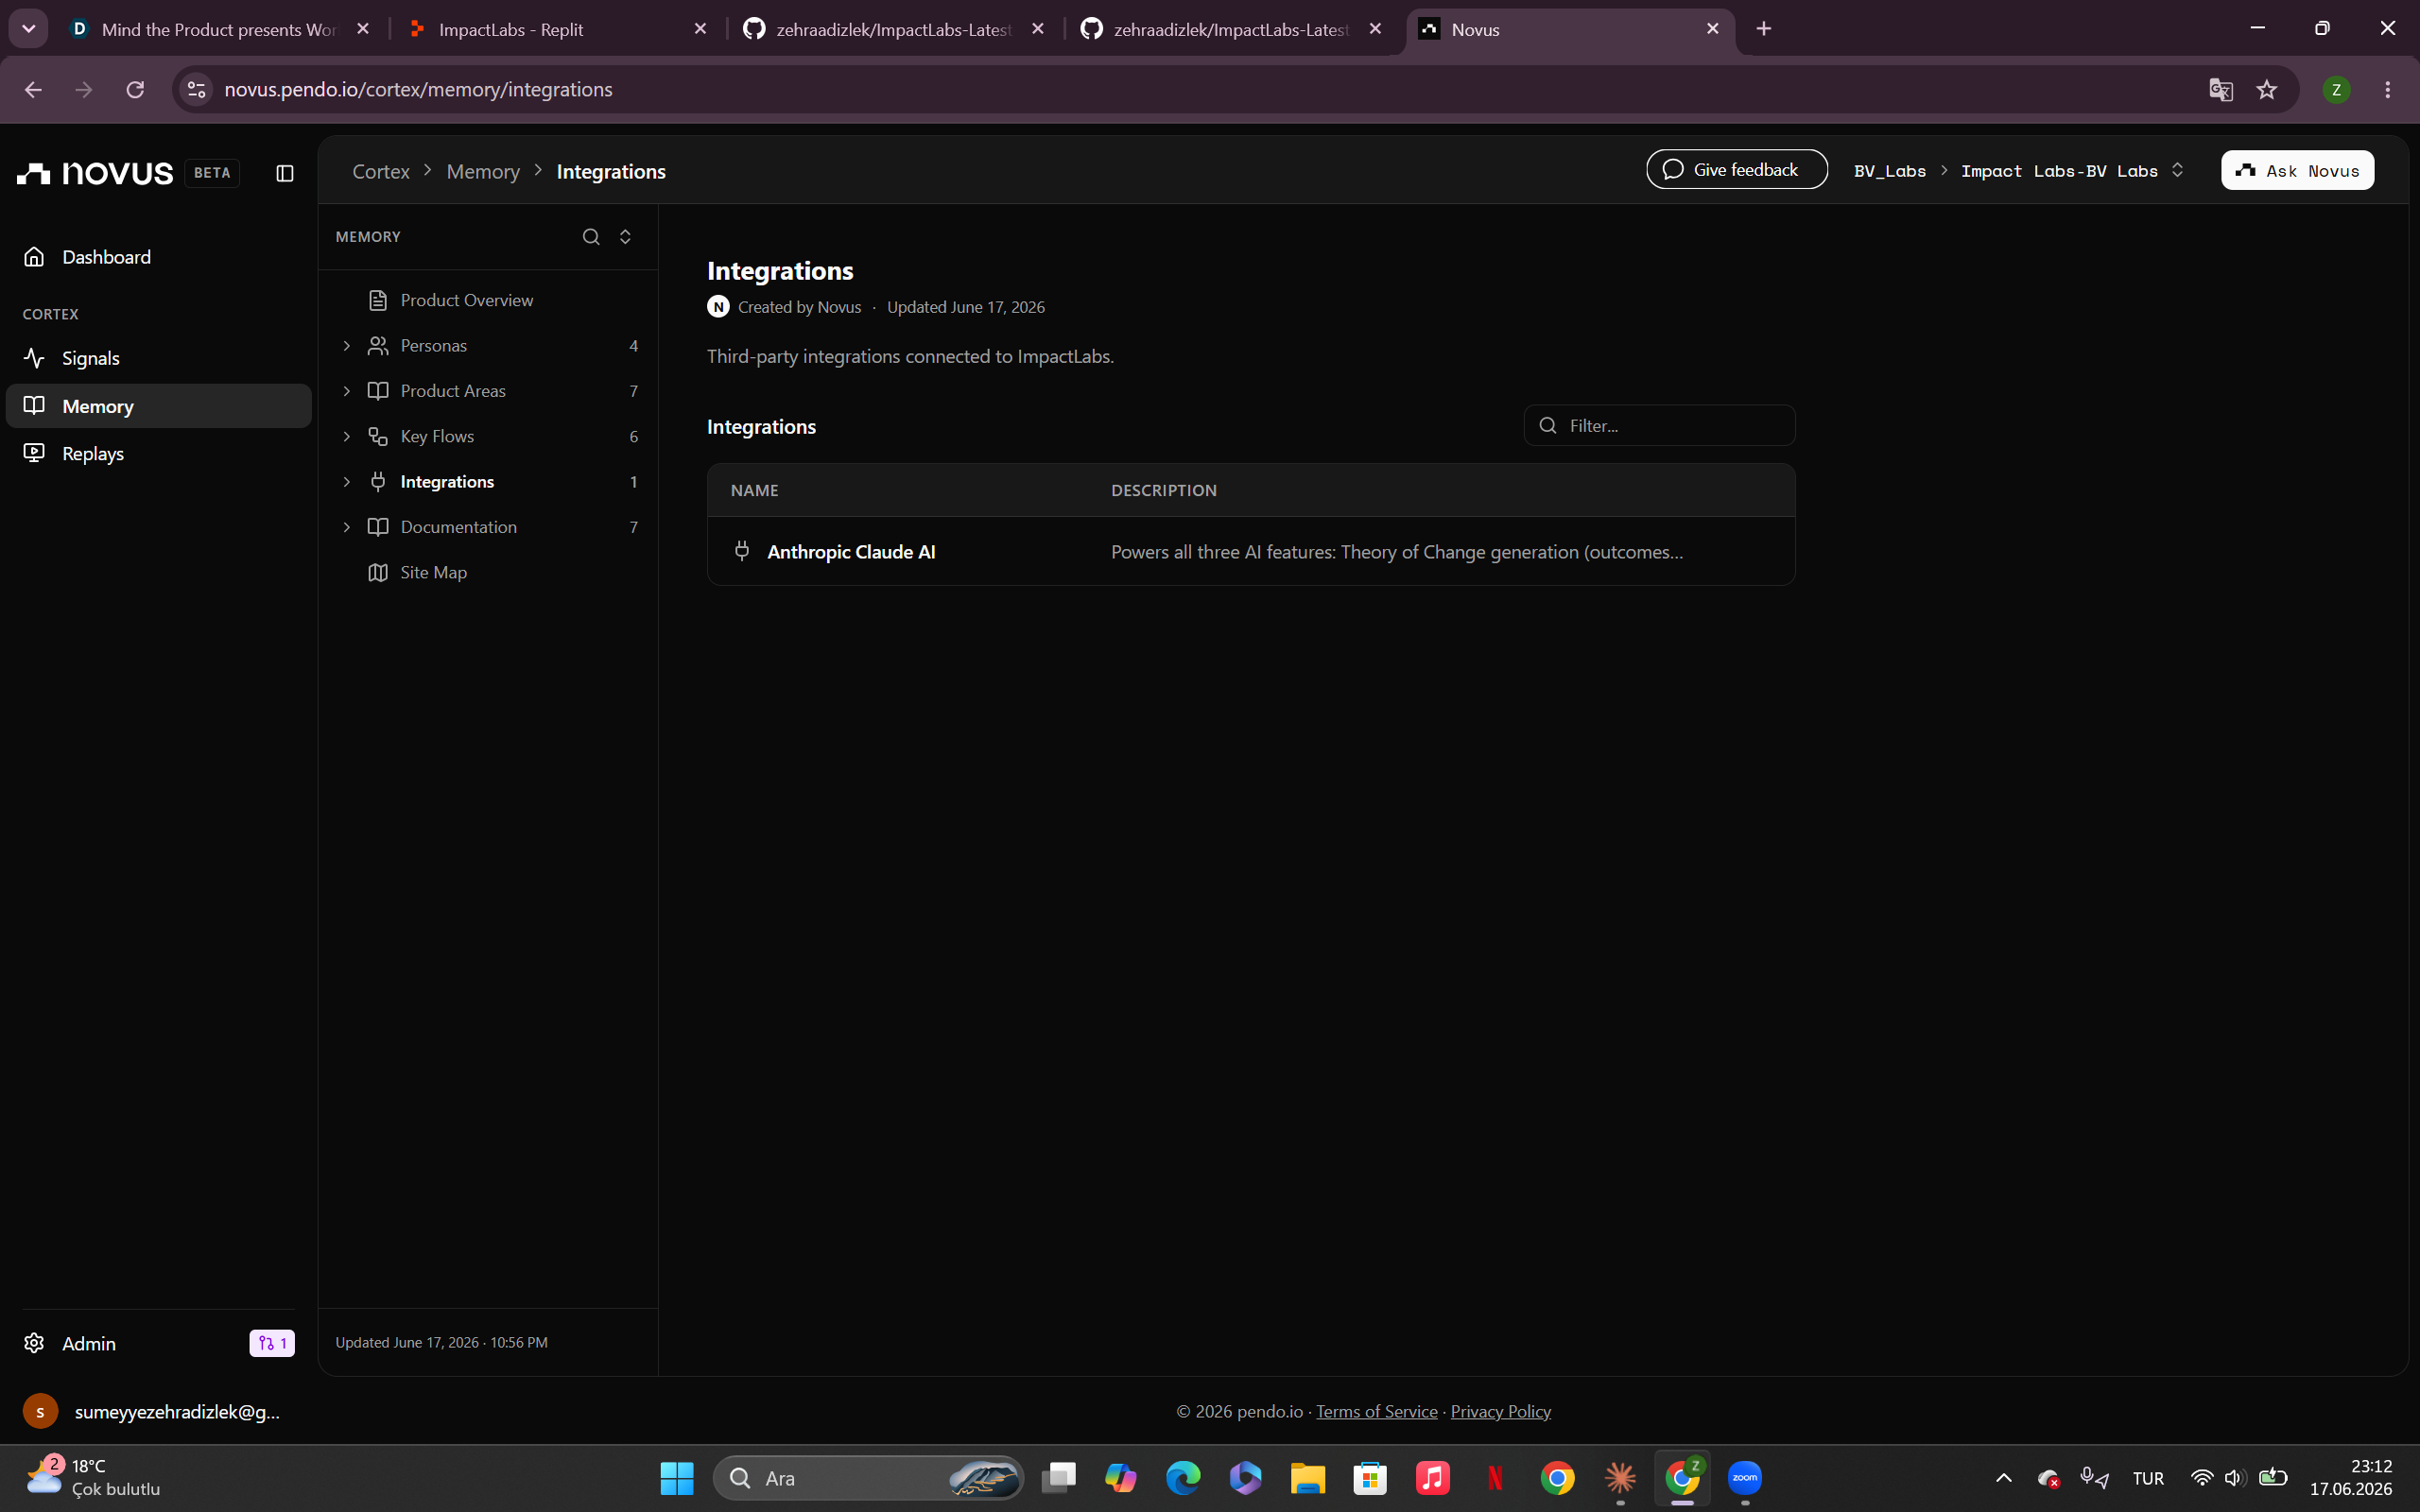
We built ImpactLabs using React, TypeScript, and Replit with Claude's API.
The platform connects a clean, intuitive interface with an AI-powered report generation backend. Users submit their organizational data, and Claude processes it into professional impact reports automatically. We also developed custom report templates and impact-reporting frameworks to make sure outputs are structured, readable, and aligned with real impact report standards.
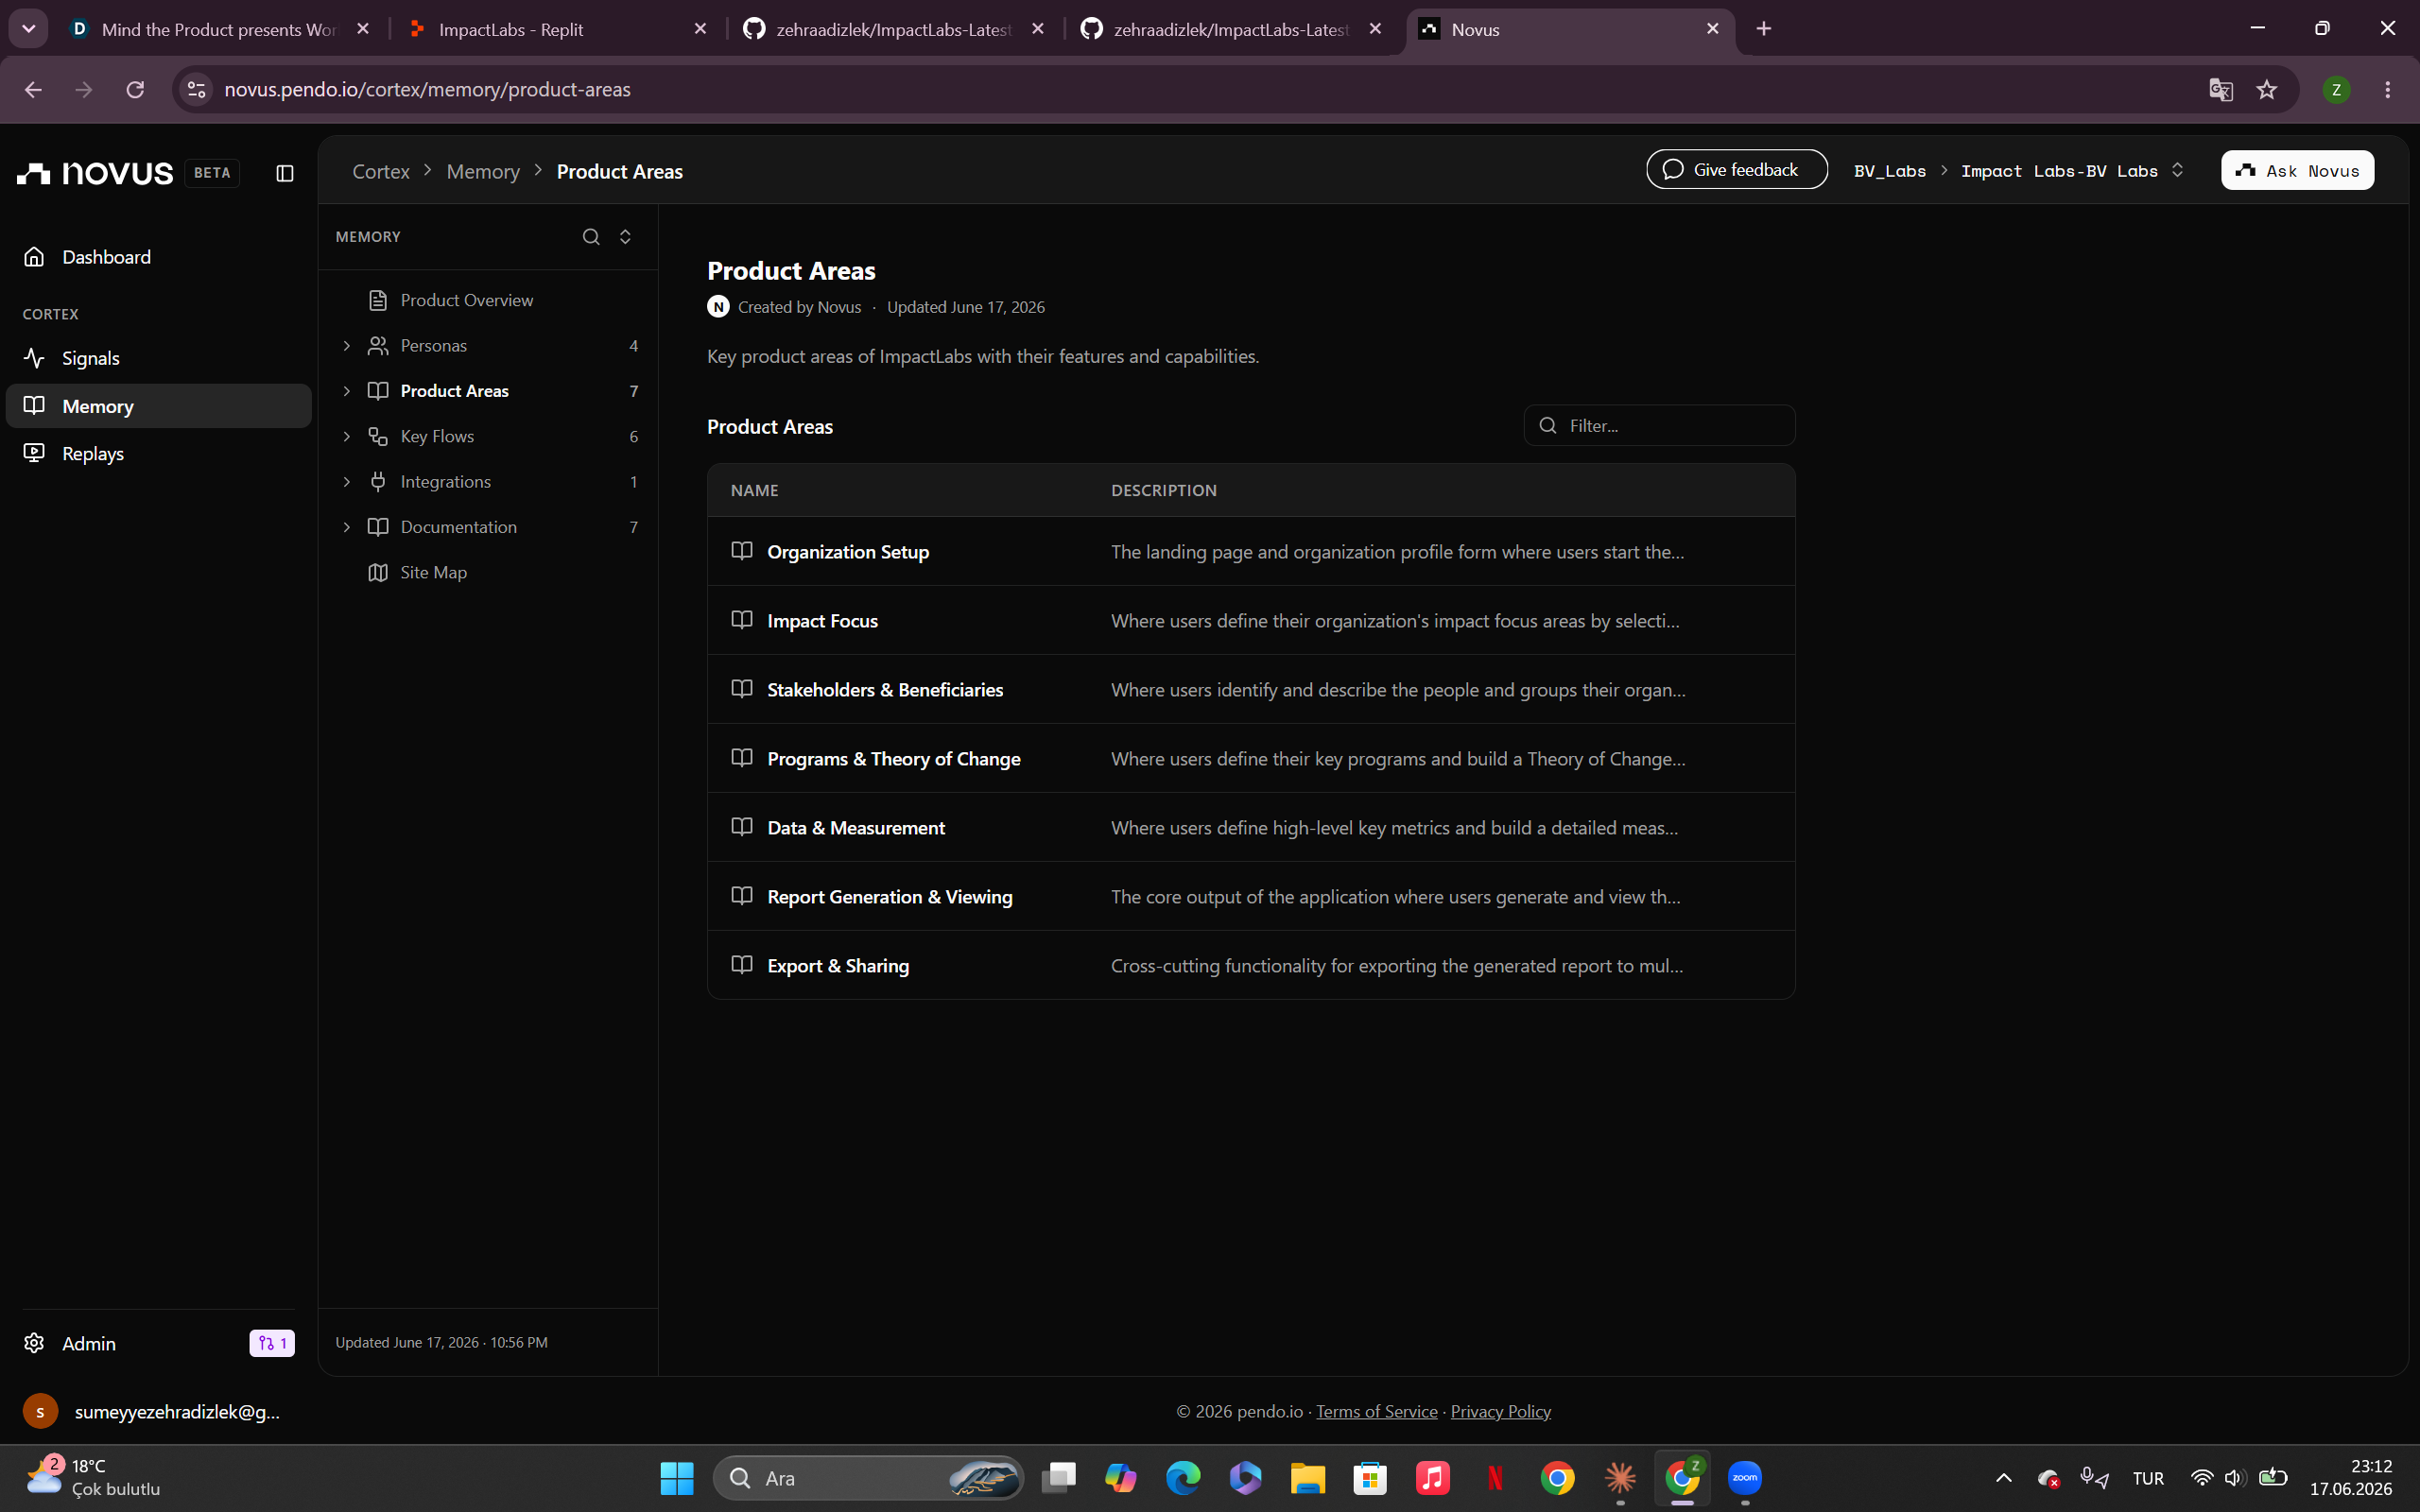
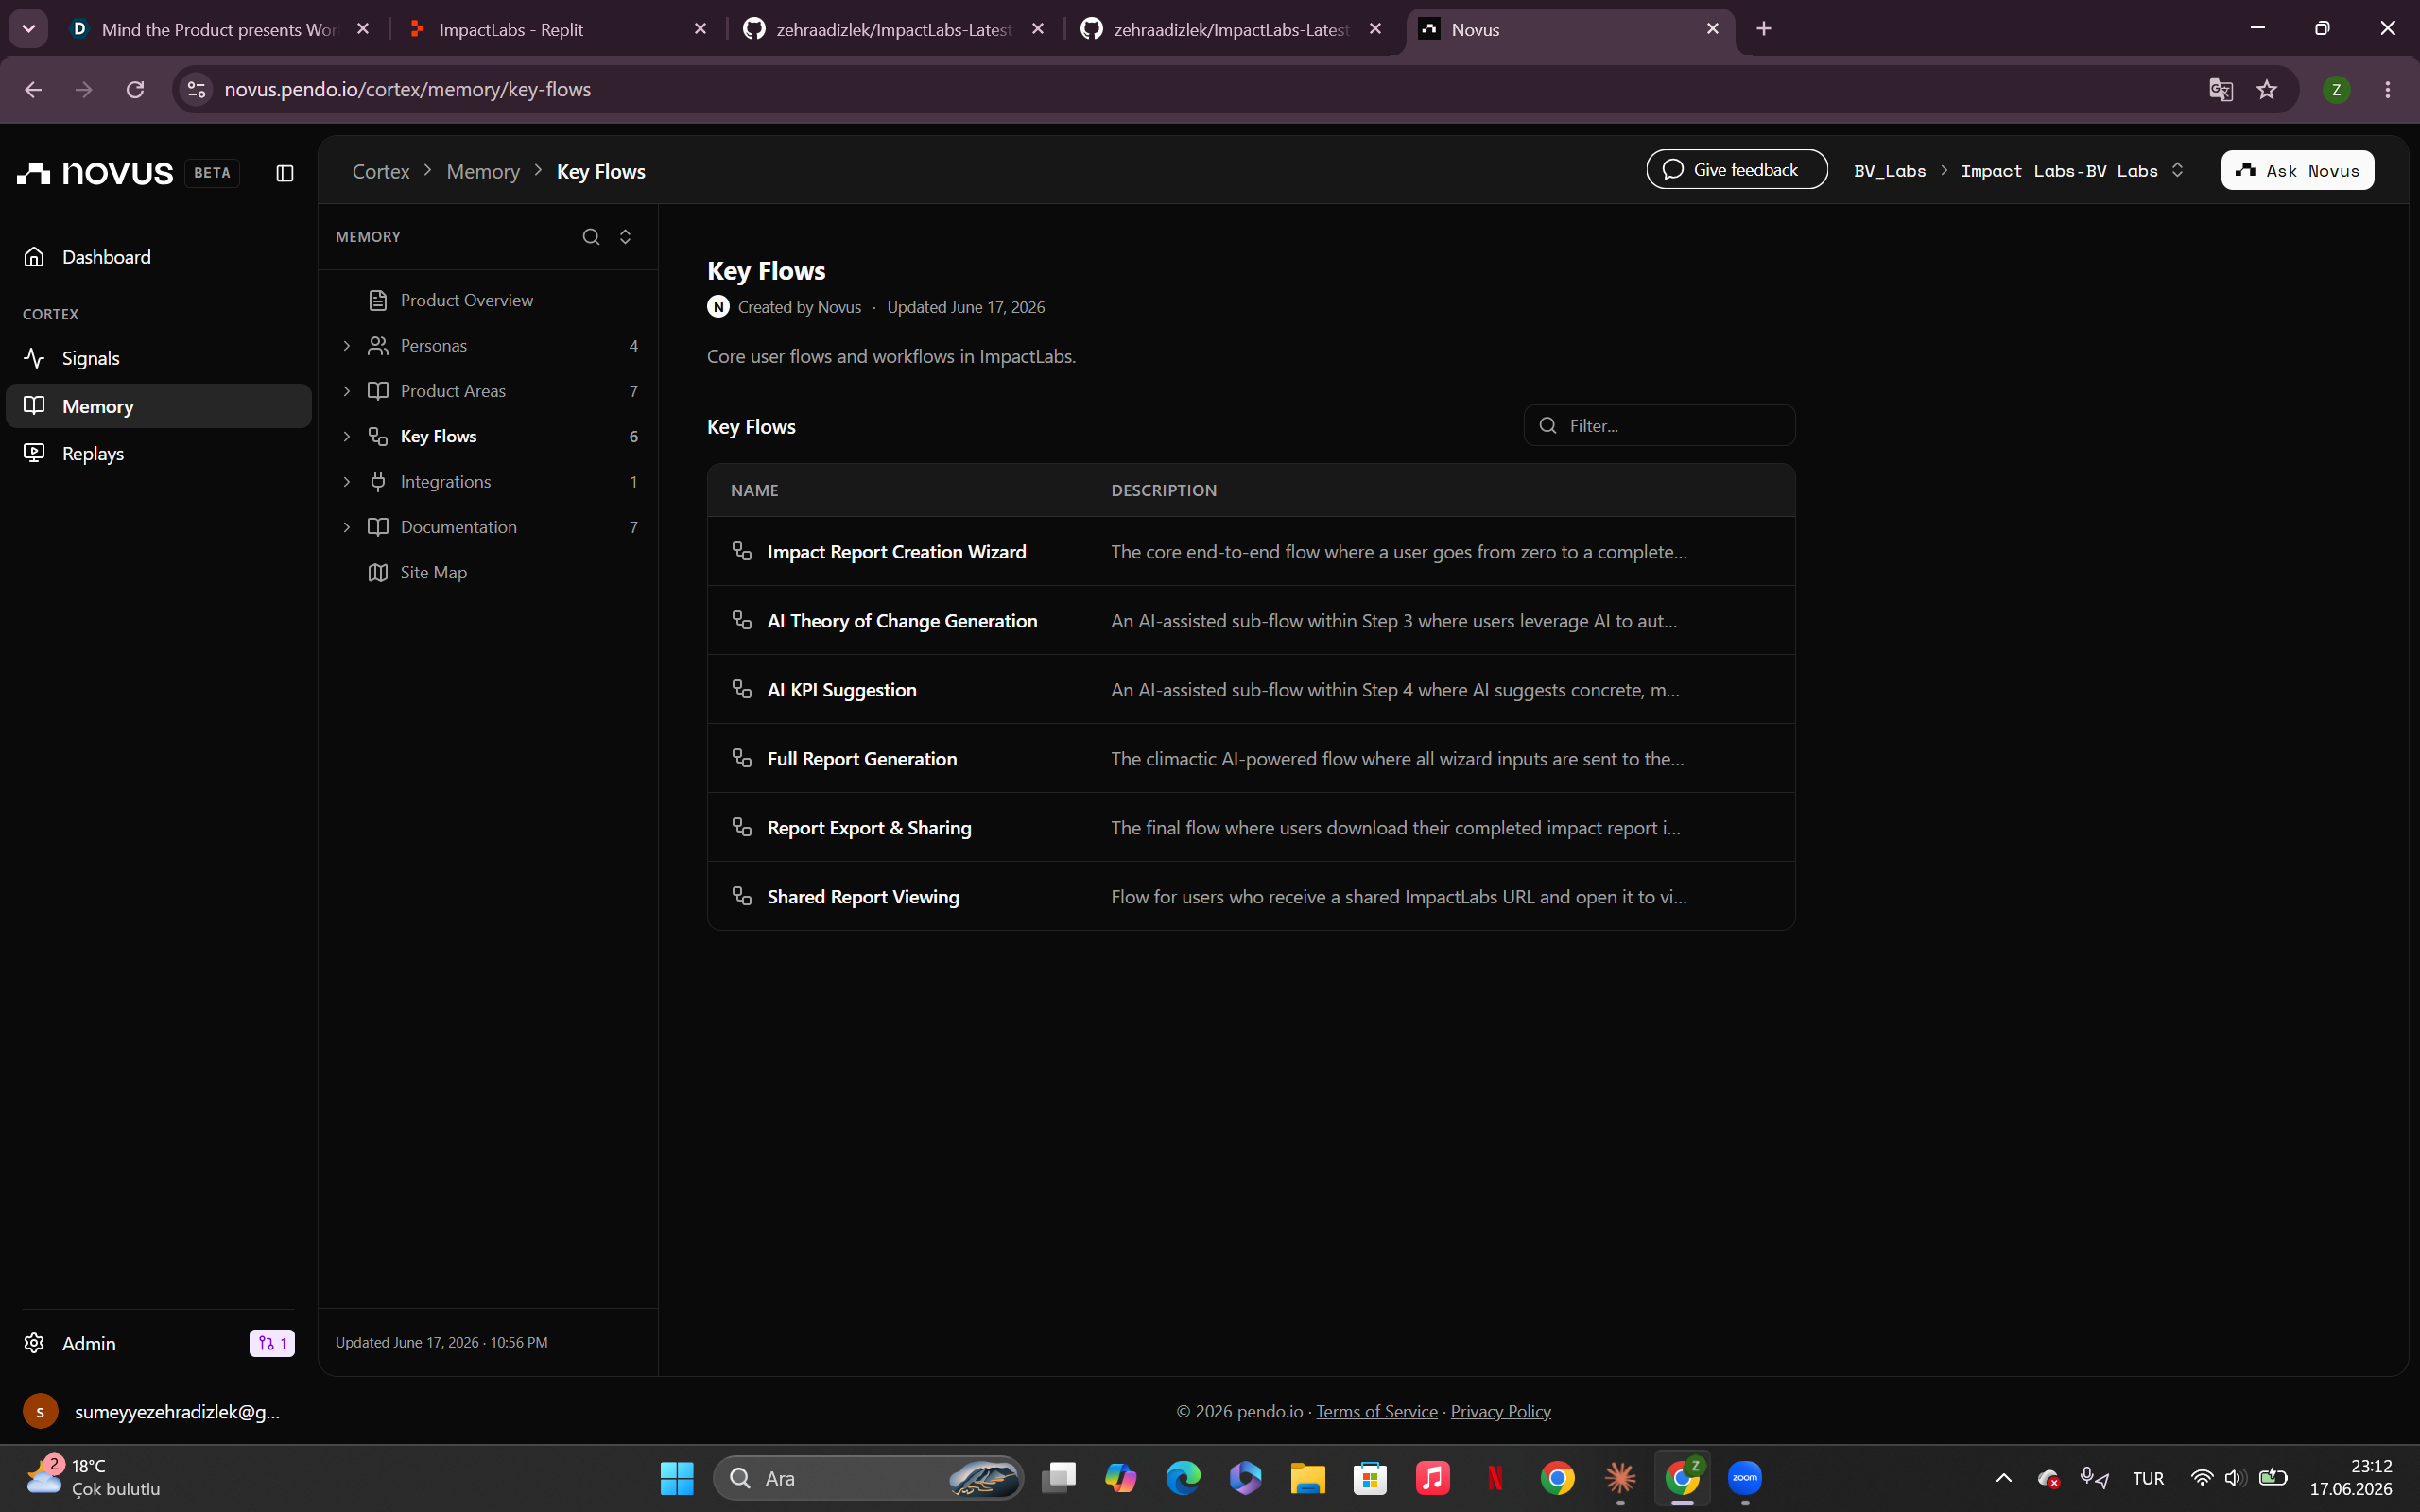
On the frontend, a multi-step wizard guides organizations through defining their impact metrics, selecting a reporting framework (including SDG alignment), and entering their data. Once submitted, this data is sent to Claude's API along with the selected framework and formatting instructions, and Claude generates the written report content. On the output side, we built a custom export pipeline that converts the generated report into downloadable PDF, DOCX, and PPTX files, so users get a presentation-ready document rather than just an in-browser view.
Challenges we ran into
The hardest part was turning messy, incomplete, real-world data into something that actually reads as professional and useful. Organizations rarely hand you perfectly structured metrics. Therefore, we had to build workflows flexible enough to handle all kinds of input while still producing coherent, trustworthy reports.
Additionally, automated reports can feel generic. Getting the AI to generate something that still reflects each organization's unique story, without requiring hours of manual editing, took a lot of iteration on the prompting side while training Claude.
On top of that, building the PDF and PowerPoint exporters was a serious problem. Keeping layouts clean and consistent across different report lengths was a real challenge, and working through Github repo conflicts during collaborative development cost us more time than we would like to admit.
Accomplishments that we're proud of
We built a working product that solves a problem we lived ourselves and that feels like the most honest accomplishment we can claim. Hence, it's promising that ImpactLabs can take a real organization's data and turn it into a report worth sharing, in minutes. We're proud that something born from a personal frustration in the BeVisioneers Fellowship could end up being genuinely useful for nonprofits and social enterprises who don't have the time or resources to do this on their own.
What we learned
We learned that measuring impact is often just as important as creating it and that most organizations know this, but don't have the tools or the time to act on it.
Furthermore, we learned that prompt engineering deserves the same attention as any other part of the codebase. Getting Claude to generate reports that are concise, professional, and actually sound human took more time than we expected.
What's next for ImpactLabs
We want to get ImpactLabs in front of real organizations and learn from how they actually use it. From there, we're looking forward to develop features such as impact tracking over time, SDG alignment tagging, and multi-language support, so any organization can showcase their data-based impact.
Built With
- anthropic-claude
- novus
- react
- replit
- typescript


Log in or sign up for Devpost to join the conversation.