Impact of user personality on advertisement recommendations
Source code at https://github.com/salilkanitkar/responsible_ai_hackathon
For a better formatted version please use,
https://github.com/salilkanitkar/responsible_ai_hackathon/blob/master/FinalReport.pdf
Google Doc
https://docs.google.com/document/d/1Ru5YaVLOYghM2T0usLzroyKGe5ySjJxgAHYm4JMeRFk/edit?usp=sharing
Authors
- Sahil (https://www.linkedin.com/in/iamsiter/)
- Salil (https://www.linkedin.com/in/salilkanitkar/)
- Praveen (https://www.linkedin.com/in/kris300/)
- Nitin (https://www.linkedin.com/in/nitinpasumarthy/)
Responsible AI Concerns
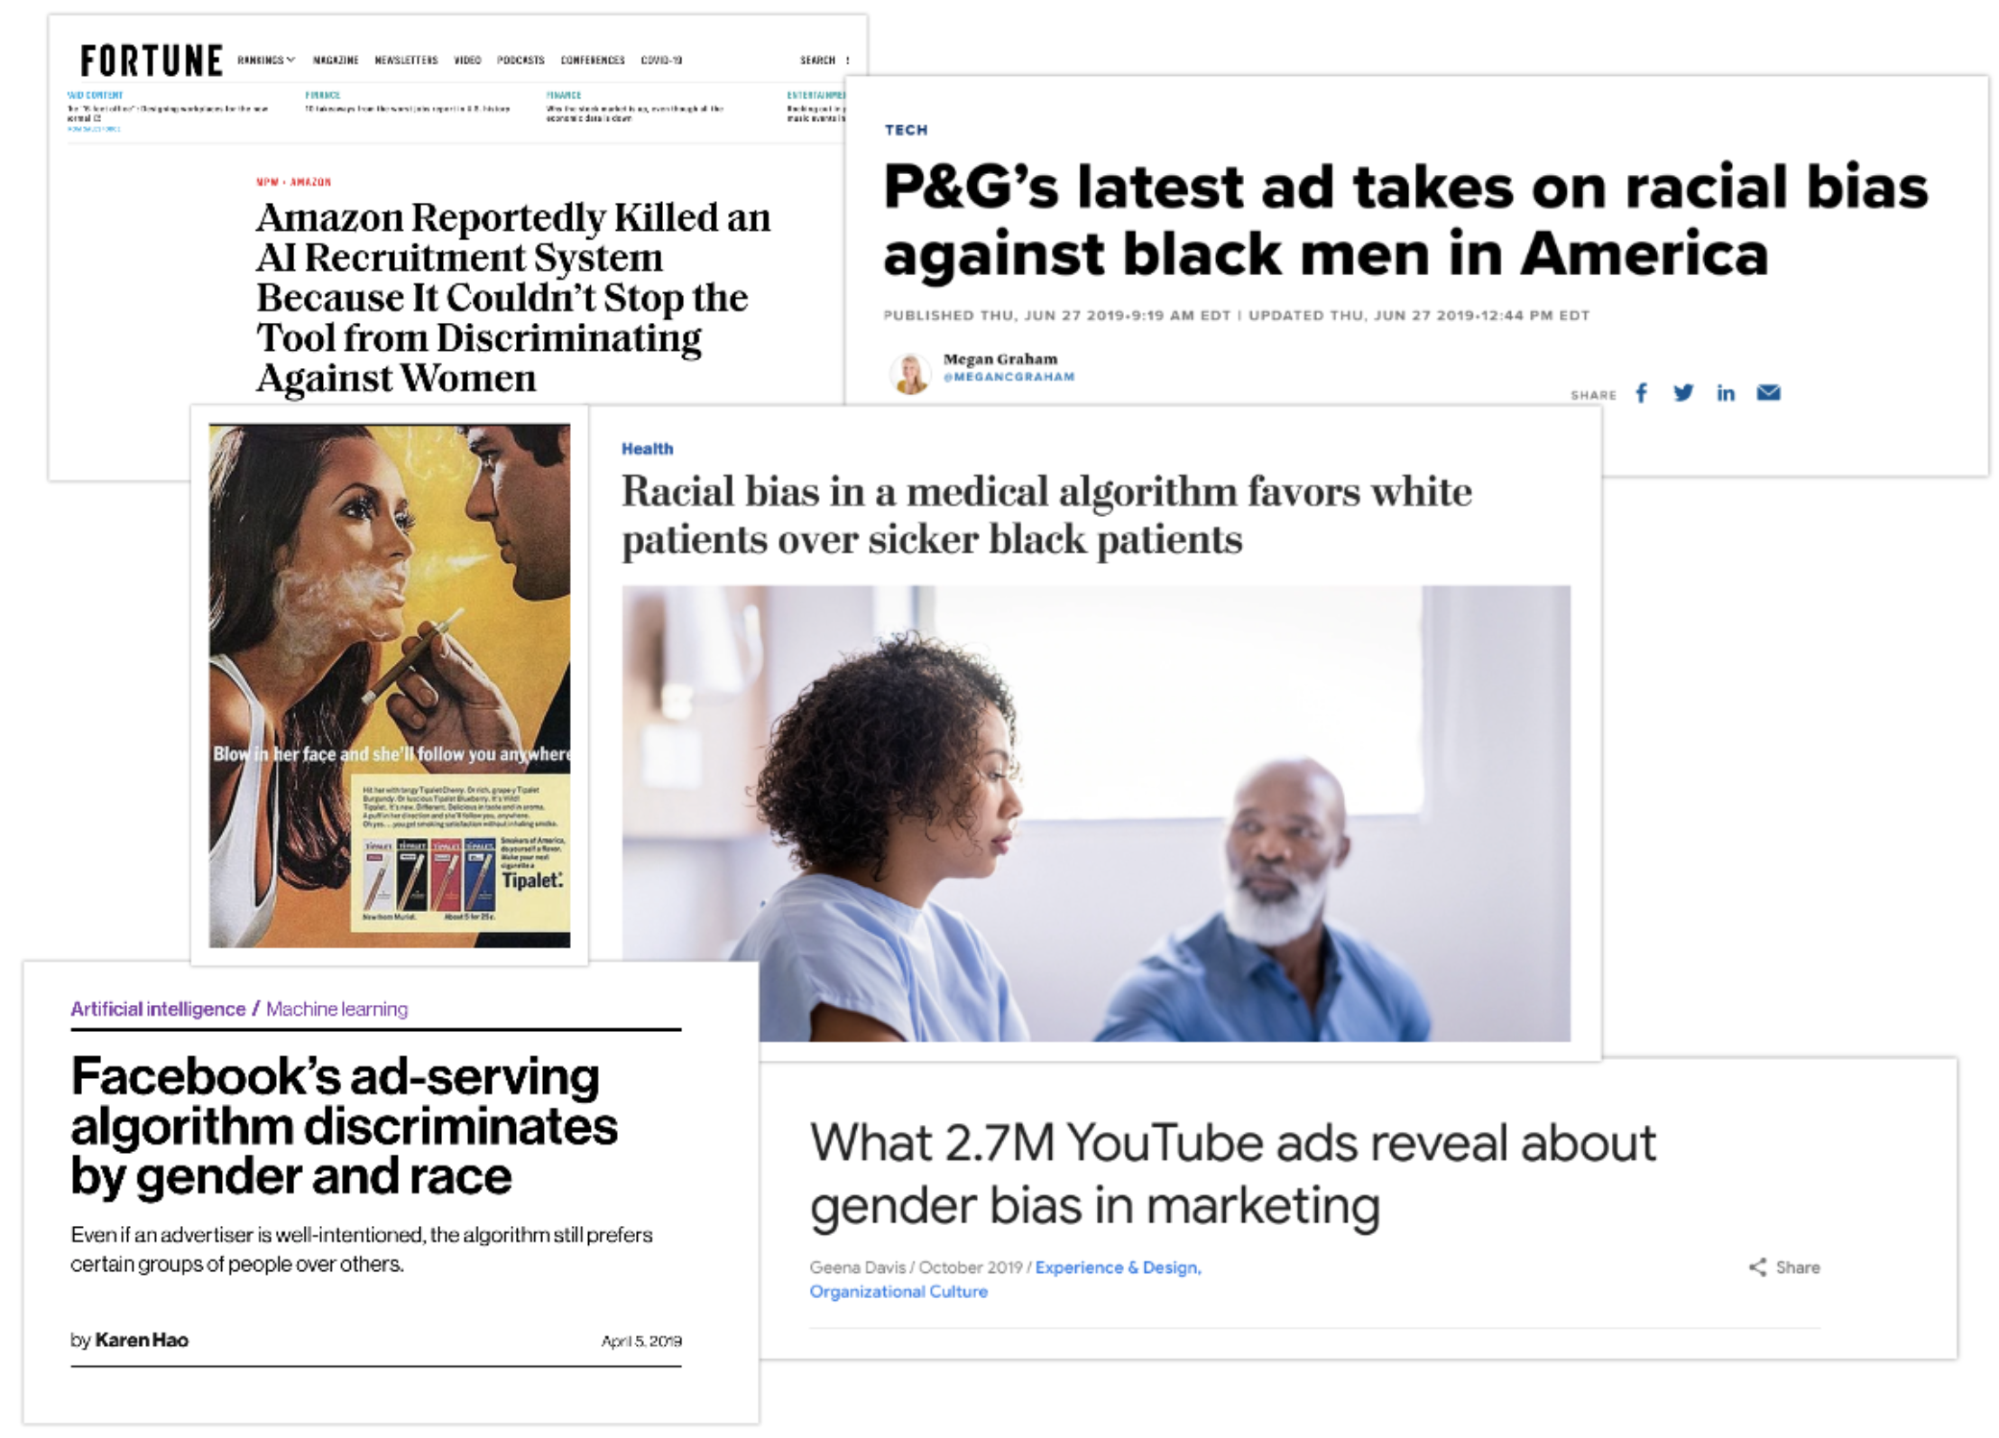
Bias and discrimination in marketing advertisements are something big firms and governments have been tackling for years. With the advent of artificial intelligence and a gigantic amount of data about customers (personal information, interactions, likes, dislikes ) and products, we have machine learning algorithms and recommendation systems to automate audience targeting, ad delivery, and ad engagement predictions. But little did they know that bias in the data and opacity of the models would land them into trouble for the same problem - BIAS & DISCRIMINATION
❝ Women control 73 percent of consumer spending in the United States and $20 trillion globally and yet ads frequently fail to speak to them in a way that shows an understanding of their lives. ❞

Based on our study on existing problems, we found the following broad areas, each one being a research area of its own kind, where the recommended advertisement can be deemed as biased or discriminatory and not well accepted by society.
Bias in Online ad delivery & audience targeting
Big firms nowadays target their customers using click prediction models and recommendation algorithms to drive their profits. However, due to inherent bias in the data that has been collected over the years, the delivery of ads can be biased.
Advertisement not reaching everyone
Although it's prerogative of the companies to decide the audience and target customers who deliver high profit, sometimes it can kick in sense of discrimination across the customers who learn about the product indirectly say by word of mouth. For example, beauty products being excessively targeted for only white women.
Advertisements delivered to the right audience but offending and harassing customers
Over relying on machine learning models might keep recommending and targeting a certain section of the population without taking into effect the perception and acceptance of the ads.
For example, advertisements for sports goods delivered to the members of the black community without taking into account the profession or interests of the person. On similar lines, we see ads delivered to our mailboxes for some disease/ailments which one wouldn't want to discuss.
Bias in the advertisement images
With all the above boxes checked correctly, we could still have some possibility of bias or discrimination via images that the ads contain.

The image showing women showing success linked to kitchen and microwave
Source - https://in.pinterest.com/kminseo63/bias-in-advertisements/
The problem addressed and dataset
In this big world of online advertisements, there is tons of research published in the field of machine learning bringing profits for big firms, case studies on how well advertisements are being accepted, and experiments linking psychology, politics with advertisements.
We have picked one of the research studies linking user personality with advertisements and setting a benchmark for ad rating predictions and ad click predictions.
Choosing a Dataset
For the task of investigating and fixing fairness in an Advertisement Recommendation system requires a dataset that is rich across 3 different verticals:
- The dataset should contain information about the people being presented with the Ads
- The dataset should have Advertisements across multiple categories and types
- The dataset should capture users' reactions and/or preferences for the Ads shown.
With these constraints in mind, we have chosen to use the publicly available ADS Dataset from research study: https://www.kaggle.com/groffo/ads16-dataset (Research paper here)
This research uses a personality perspective to determine the unique associations among the consumer's buying tendency and advert recommendations.
Why this Dataset?
Personality-based Ads recommender systems are increasingly attracting the attention of researchers and industry practitioners. Personality is the latent construct that accounts for individuals characteristic patterns of thought, emotion, and behavior.
Attitudes, perceptions, and motivations are not directly apparent from clicks on advertisements or online purchases, but they are an important part of the success or failure of online marketing strategies. As a result, companies are increasingly tuning their Ads recommendation systems upon personality factors.
We believe that "inferring a personality-based recommendation" is an area where even a small amount of bias and a lack of fairness can have a profound impact - not only to the consumers being presented only with a selective set of Ads but also on the merchants missing out on potential buyers by not targeting their ads fairly.
Dataset At A Glance
- Information about anonymous 120 users. Multiple dimensions about demographic info (Age, Gender, Country, ZipCode etc.) and a multitude of personality indicating information like Most Listened Music, Movies, Most visited Websites, Favorite Sports etc Additionally each user was asked to submit 10 images that they consider as "positive" (for example cat images) and 10 images they consider "negative" (for example an image showing a disagreement between people).
- 300 Advertisements - categorized into 20 sections - ranging from Electronics, Automobiles etc to Kitchen, Pet supplies, sports supplies etc. Each category has 15 advertisements.
- Ratings provided by each user to each Advertisement on a scale of 1 - 5, highly likable getting a high rating.
- As seen from the point "3" above, the dataset captures exhaustively how all users rated all Ads - which makes this dataset an ideal candidate to build a model and analyze the fairness and/or bias - across various dimensions.
What we did
Data preparation
The ADS-16 dataset contains both structured and unstructured data. So we first built a tailored dataset as explained in Figure 1
Structured data |
Unstructured data |
|
|

Figure 1. Creating structured dataset by combining information from resources in ADS-16
Google vision API was used on Ad images to extract rich semantic information from them. Several encoding techniques like multi label binarizer, one-hot encoding and Glove embeddings are used to transform categorical data into numbers. We experimented with multiple word embeddings and picked the one which gave the best based AUC score. The final encoded training data is available here.
Model Architecture
We then trained a neural network model using Keras Functional API as a classification problem where the model is tasked to predict the rating for a given User and Ad combination. The high level model architecture is shown in Figure 2.

Figure 2 Model architecture using Glove embeddings and dense layers with 20 & 10 units
Source - https://www.kaggle.com/colinmorris/embedding-layers
We experimented with various feature combinations and hyperparameters (HP) to identify the best model with validation AUC. Tensorboard’s HP Params dashboard’s parallel coordinates plot was quite helpful to narrow down the best HP combination. The notebook with data preparation and model training source code is available here. For others to be able to reproduce our results here are our training notes and tensoboard.dev links.
Fairness Metrics
Before we can start assessment of potential unfairness and bias, we need some methodology to measure it. The selection and weighting of metrics is solely dependent on domain and our perception of bias in society. For example, for gender bias one would care about fair representation of both genders while in case of crime prediction one would care about low misrepresentation rate. The following are the standard metrics followed in the industry which is what we have used to evaluate our models,
False Positive Rate (FPR)
The false positive rate is calculated as the ratio between the number of negative events wrongly categorized as positive (false positives) and the total number of actual negative events
For example, in study for to classify toxic comments,
FPR (Religion:Christainity) = 0.16 and FPR (Religion:Muslim)=0.80, clearly shows a bias based on religion.
Equal Opportunity Difference (EOD)
This metric is computed as the difference of true positive rates between the unprivileged and the privileged groups. The true positive rate is the ratio of true positives to the total number of actual positives for a given group.
The ideal value is 0. A value of < 0 implies higher benefit for the privileged group and a value > 0 implies higher benefit for the unprivileged group.The definition of privileged and unprivileged depends on hypotheses decided by domain experts.
Average Odds Difference (AOD)
Computed as average difference of false positive rate (false positives / negatives) and true positive rate (true positives / positives) between unprivileged and privileged groups.
The ideal value of this metric is 0. A value of < 0 implies higher benefit for the privileged group and a value > 0 implies higher benefit for the unprivileged group. Fairness for this metric is between -0.1 and 0.1
Bias Detection
Baseline Model results
As explained previously, we built a DNN Model using the ADS16 dataset and analyzed how it performed across the Fairness Metrics mentioned in the above section - the False Positive Rate (FPR), Equal Opportunity Difference (EOD) and Average Odds Difference (AOD). These provided us with two-fold advantages:
- We could see the bias and unfairness that our trained model showcased.
- We could attack these specific bias(es) with targeted mitigation strategies and evaluate if and how effective they are in reducing the bias.
In this section, let’s take a look at how our Baseline Model performed. In subsequent sections, we will explain the mitigation strategies applied.
Across the entire dataset - which includes Advertisements from 20 different categories, we found two dimensions - the Gender and the Age showcasing bias in the trained model. At a glance some of these biases across the 3 Fairness Metrics looked like below:
- False Positive Rate for Females was 60% higher than Males (0.164 vs 0.09)
- Equal Opportunity Difference was found to be 0.019. A greater than zero value here indicates higher benefit for the unprivileged group - which in our experiment is Male.
- The False Positive Rate for the Young age group (less than 20 years) is 50% higher as compared to the Middle age group (between 20 to 40). 0.204 for Young vs 0.134 for Middle Age.
However, a more stark unfairness begins to show if instead of looking across all Advertisement categories, we zoom in and focus on a couple of particular categories of Ads.
- Age Bias in serving Sports Ads
- For the purpose of our analysis, we divided users into 3 age buckets. Age less than 20 years as “Young”, age between 20 to 40 as “Middle Aged” and greater than 40 years as “Old”.
- Seen below side-by-side are the two graphs showing the number of samples in each bucket on the left and the False Positive Rate for all buckets on the right. High FPR for the Young bucket.


- Looking at the Equal Opportunity Difference between Young-MiddleAges and Young-Old buckets (-0.19 vs -0.17), it's clear that Ads are served mostly to the younger age group as the value of EOD is more negative.
- We will explain how we mitigated this in the Bias Mitigation Section below.
- Gender Bias in Serving Consumer Electronics Ads
- We could also see a clear bias in serving Consumer Electronics Ads to Females and Males.
- The EOD value is negative (-0.046) indicating that the bias is towards serving this to Male group.
- The AOD value is more negative as well - indicating higher bias towards Male group.
- We explain how this was mitigated in the below section.
Bias Mitigation
Approaches to address concerns - Bias Mitigation approaches
Mitigation Approach 1 : Class balancing
- Oversampling : Synthetic Minority Oversampling TEchnique (SMOTE)
Classification using class-imbalanced data is biased in favor of the majority class. The bias is even larger for high-dimensional data, where the number of variables greatly exceeds the number of samples. SMOTE is a data augmentation technique using which new samples can be synthesized from the existing samples.
References:
Mitigation Approach 2 : Reweighing
- Preprocessing optimization - Reweighing using ai fairness 360
Reweighing is a preprocessing technique that Weights the examples in each (group, label) combination differently to ensure fairness before classification . This modifies the weight of each training example depending on whether the sample lies in privileged or unprivileged class .
References :
* [Data preprocessing techniques for classification without discrimination](https://link.springer.com/article/10.1007/s10115-011-0463-8)
* [AI Fairness 360 ](https://arxiv.org/pdf/1810.01943.pdf)
Effect of Bias Mitigation steps
Age Bias in serving sports Ads
We identified a bias in how the Sport Ads were served to different age groups .
Age Groups :
- young : < 20 yrs
- middleAged : 20 - 40 yrs
- old : >40 yrs

On Equal Opportunity Difference (EOD) comparison between young-middleAged and young-old age groups . It's very clear that Ads are served mostly to the younger age group as the values of EOD tend to be more negative .
By using the mitigation steps , we can see that the EOD improves (closer to 0). Both class balancing and reweighing techniques help with EOD .

Even with Average Odds Difference (AOD) , we see that before mitigation steps were added , the values are more negative indicating a bias in serving these ads to the younger population . With mitigation , we improve the AOD (closer to 0) . We found the class balancing brought a higher improvement compared to reweighting .

We also found that optimizing the model for fairness increased the false positive rate. This is because adding these mitigation steps diverts the objective of the model from only accuracy to both accuracy and fairness.
- Gender Bias in serving consumer electronics Ads
The other bias we identified was in the serving of consumer electronics ads between male and female groups .

In the above chart we see that , before any mitigation steps , the EOD is negative indicating that the bias is towards serving this to male group . Both the mitigation steps try to eliminate this by moving EOD closer to zero . We see that both the mitigation steps are aggressive and push EOD to positive value makes the model more biased towards females . Even though re-weighing makes it biased towards female group ,the model overall is less biased with it (0.0287 more closer to zero compared to -0.0463)

With AOD , we see that both the mitigation steps make the model less biased . Even in this case class balancing is more aggressive .

Like in the previous case (Sport Ads) , we see that the false positive rate increases with the introduction of the bias mitigation steps .
Recommendation
In the above cases we see that class balancing using SMOTE and reweighing are effective in making the model less biased . It's also important to be aware of the impact of adding bias mitigation steps on the model metrics like accuracy , auc etc . These fairness strategies might have a negative effect on accuracy and a proper trade off must be made and this should be dependent on model objective .
Other explored Approaches
Bias Metrics
- Fairness through pairwise comparison
- This paper recommends a pairwise fairness metric and also a strategy to improve fairness using pairwise regularization for recommender systems . This strategy is shown to have significantly improved fairness and we believe the same could be explored for our use case too .
Mitigation
- Constrained Optimization
- The TensorFlow Constrained Optimization (TFCO) library (github repo here) makes it easy to configure and train machine learning problems based on multiple different metrics (e.g. the precision on members of certain groups, the true positive rates on residents of certain countries etc).
- Most of these metrics mentioned above are standard model evaluation metrics, however, TCFO offers the ability to minimize and constrain arbitrary combinations of them.
- We explored two metrics offered by the TCFO library - the Equalized Odds and Predictive Parity (as referenced & defined here).
- Equalized Odds: For any particular label and attribute, a classifier predicts that label equally well for all values of that attribute.
- Predictive Parity: A fairness metric that checks whether, for a given classifier, the precision rates are equivalent for subgroups under consideration.
- Even though we could not successfully use TCFO for mitigating the fairness concerns exposed by our base model, it did offer us an opportunity to assess a generalized optimizer library.
- Debiasing word embeddings by adjust the directions of the word vectors as shared in https://www.coursera.org/lecture/nlp-sequence-models/debiasing-word-embeddings-zHASj
Challenges Faced
- Custom embeddings in feature columns: We wanted to take advantage of feature columns due to their close integration with many other TF tools, but were unable to as we wanted to use custom embedding not available on TF Hub.
- Encoded CSV with TF fairness tools: We were unable to use TF fairness tools as the given examples use feature columns from raw CSV data. Instead we built our own using the ideas from Fairness Indicator APIs.
- Non binary features fairness: Protected feature, Age for example had three values - young, middle age and old and current group fairness metrics like Equal Opportunity difference only work on 2 groups at a time. So we used our calculated best judgement based on false positives rates and compared various combinations two at a time.
- Which fairness metric to use: Just like metrics for ML, we had to use our judgement based on the domain and use case to identify which fairness metrics are best suitable. We found equal opportunity score and average odds difference as relevant and easy to understand and hence used them.
- Many possibilities of bias: We had 15
Source Code
- Github Repository for our code: https://github.com/salilkanitkar/responsible_ai_hackathon
- Training progress can be viewed on Tensorboard.dev at https://tensorboard.dev/experiment/fkAOs09DSOKc52nhOtO1XA/
- Fairness metrics dashboard https://github.com/Nithanaroy/recommender-ai-fairness-dashboard

References
[1] Setting Fairness Goals with the TensorFlow Constrained Optimization Library
[2] google-research/tensorflow_constrained_optimization has code samples on constrained optimization
[3] https://github.com/google-research/google-research/tree/master/pairwise_fairness
[4] https://github.com/tensorflow/fairness-indicators#examples


Log in or sign up for Devpost to join the conversation.