-
-
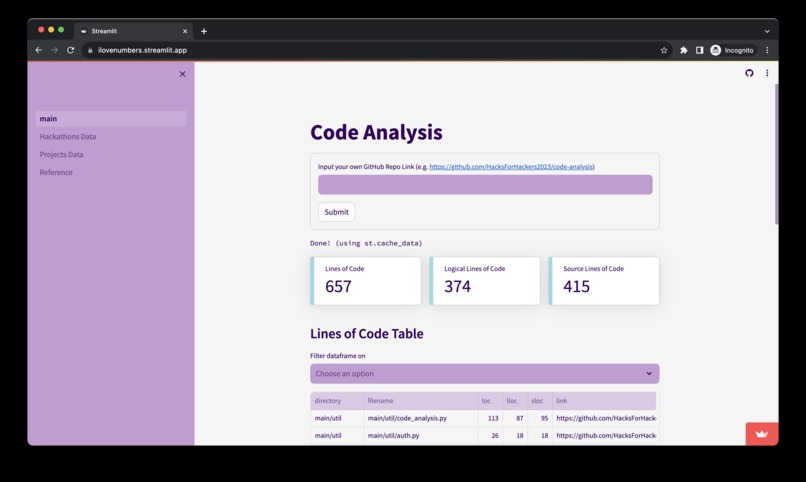
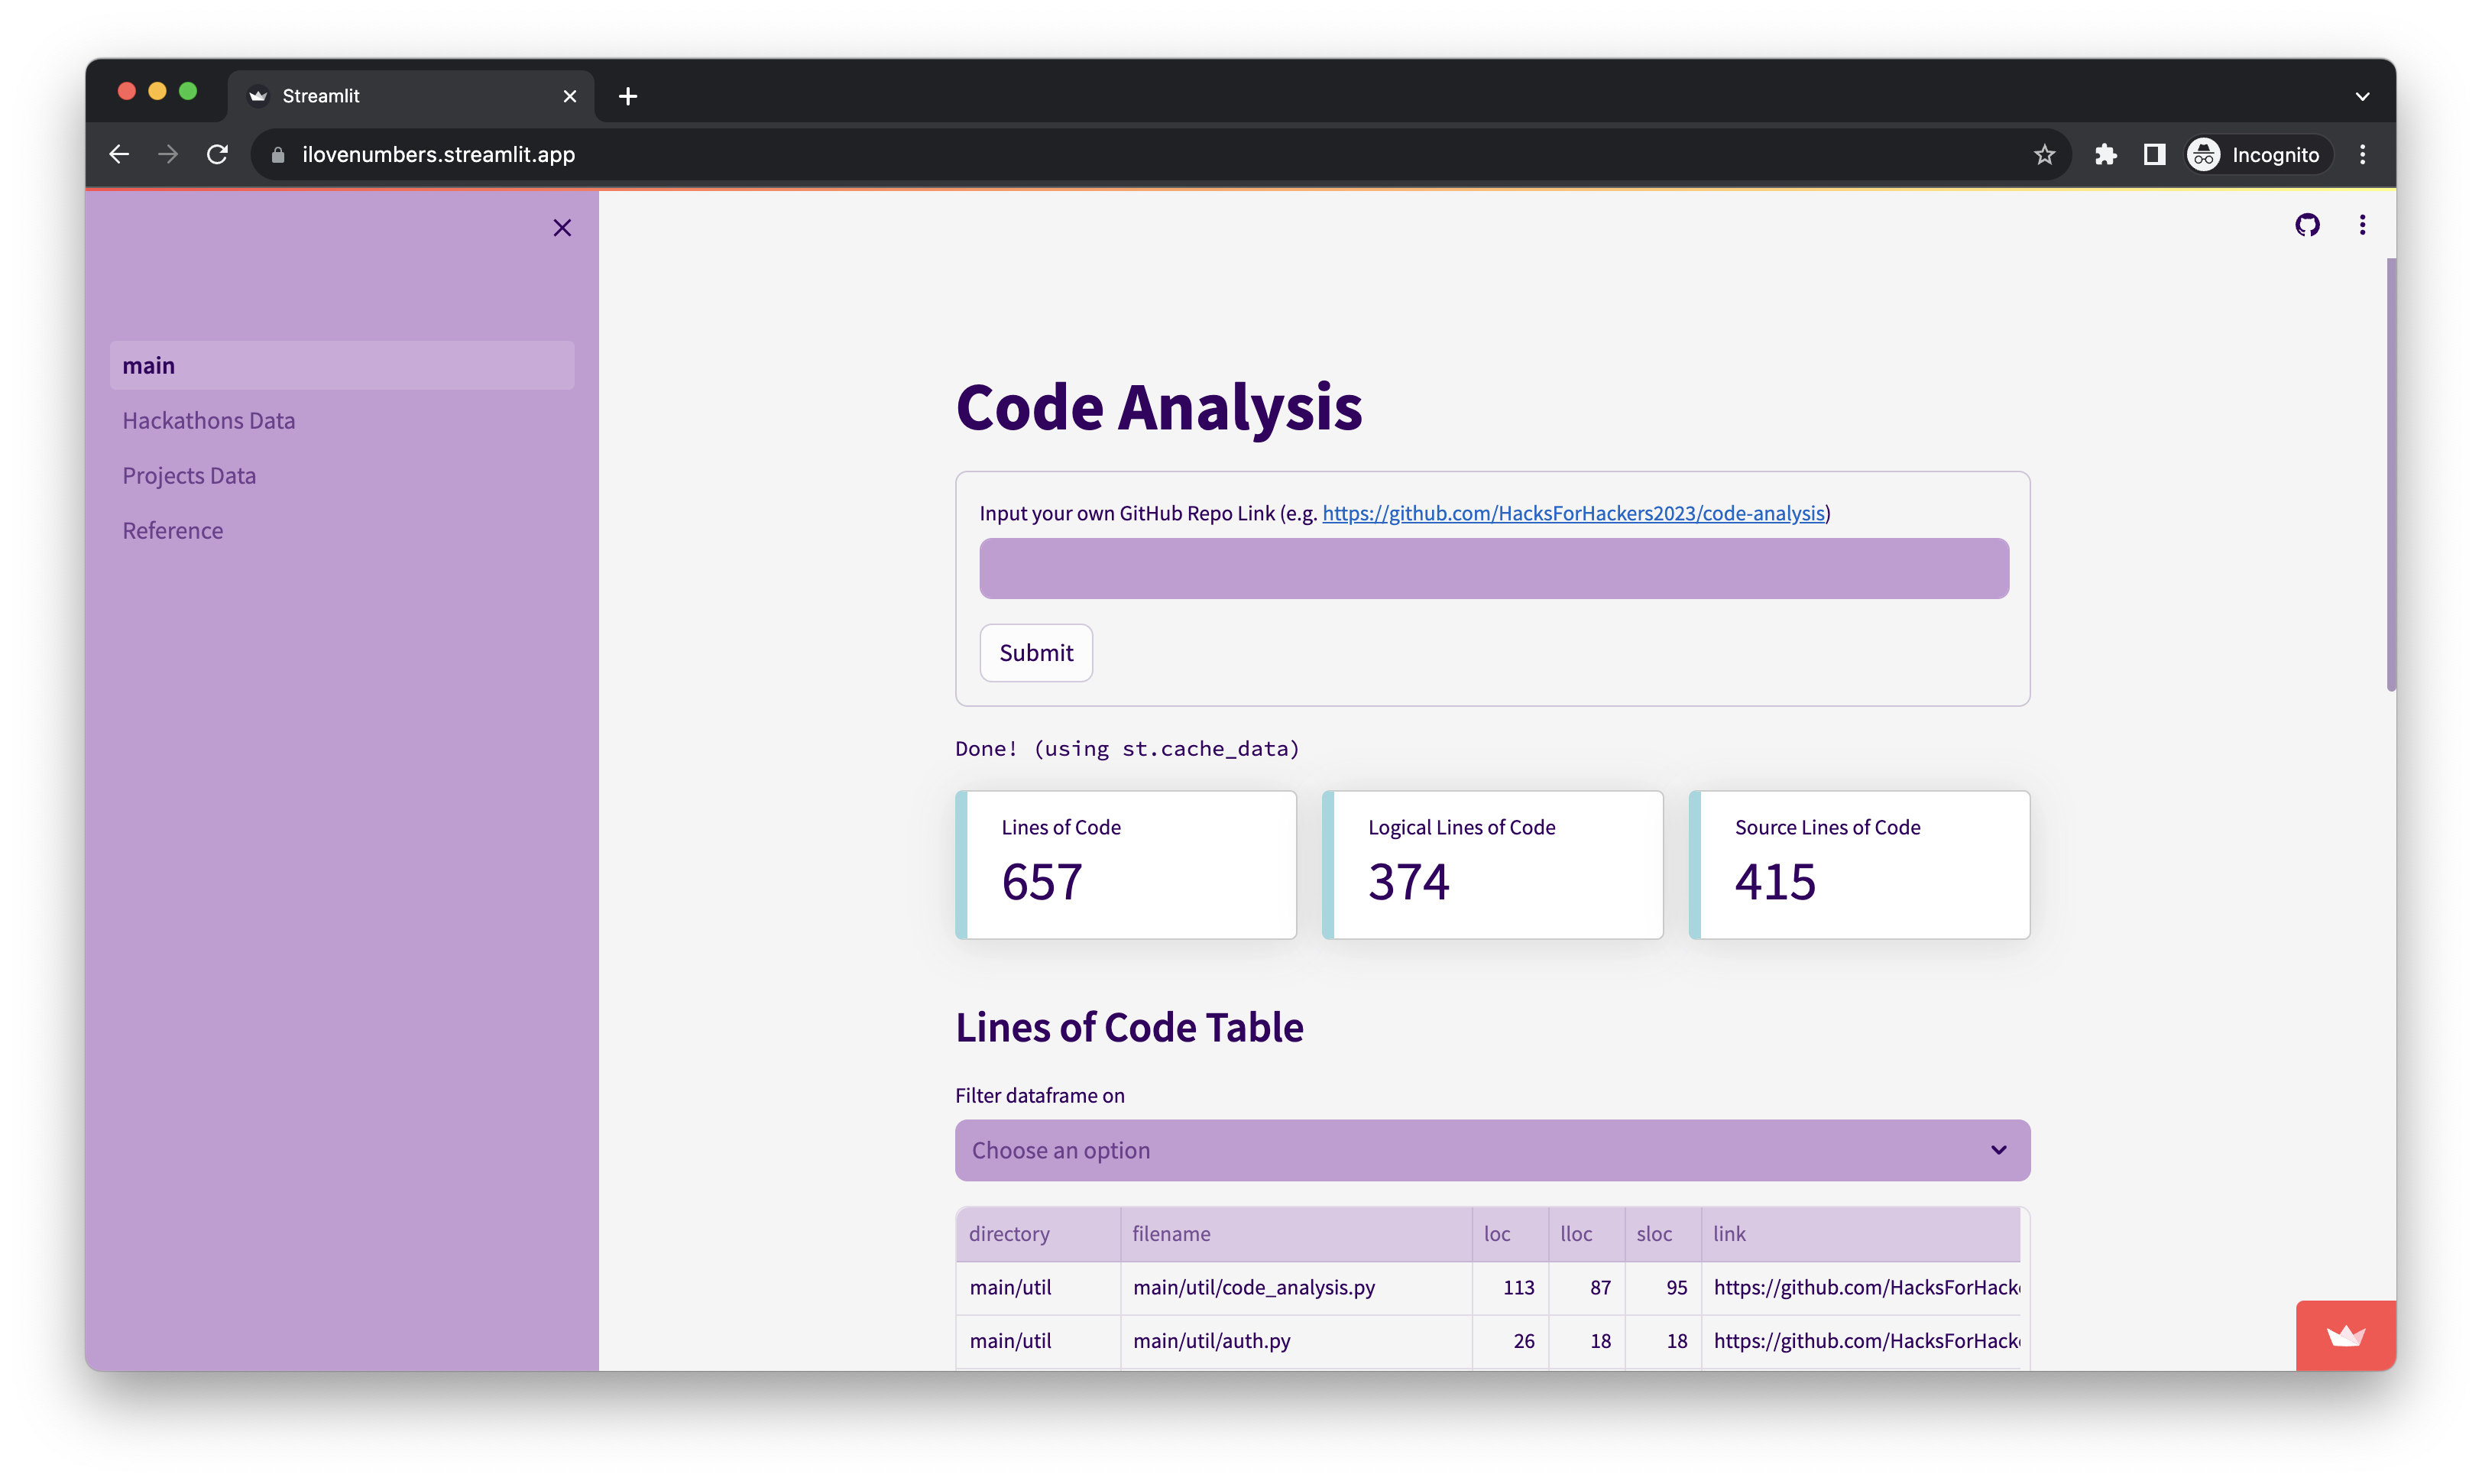
Our Streamlit app!
💡 Inspiration
Devpost has thousands of hackathons and hundreds of thousands of projects. We wanted to explore this data, and uncover the trends across both hackathons and hackathon projects.
A good way to improve is by looking back at previous projects. There is a lot of useful data available. Looking back at them will let us realise our hackathon journey and think of ideas to enhance / make the code more efficient.
🔍 What it does
We take a look at 2 datasets from kaggle and visualise the data using Streamlit.
From a public GitHub repository, we extract and analyse each file. Code metrics such as cyclomatic complexity and logical lines of code are studied. After processing, useful data is shown in tables.
🔧 How we built it
We used Streamlit to build and host our website, which allows us to easily use python packages such as pandas and matplotlib to generate visualisations using the dataframe. Streamlit also offers options for dataframe display and data filtering, allowing visitors to browse the dataset.
The GitHub Api was used to extract files from the repository. Non-programming language files such as ‘png’ or ‘md’ are filtered out. The relevant files are processed and analysed for code metrics.
Created a GitHub App. It allows us to authenticate as a GitHub App which we felt is the best way to use get a token for the GitHub Api.
Radon Python library was applied to the files in order to collect the code metrics.
🏃♂️ Challenges we ran into
Initially, we used the GitHub Api without a token. After some testing, we hit the rate limit and had to use authentication. Getting the token was rather challenging. It required us to read documentation and decide which method of authentication was most suitable for our project.
🏅 Accomplishments that we're proud of
We managed to get a working application up, and created a few interesting visualisations using the data. We also managed to clean up the data so that it could be uploaded and viewed more efficiently.
Created an application on Streamlit!
🧠 What we learned
We learned how to use streamlit for efficient data visualisation and sharing. We also learned how to plot a few different types of graphs
Understanding the usefulness of caching and how to apply it correctly to speed up the loading times for data collection / processing.
⏭️ What's next for ilovenumbers
- Additional data visualisation
- Looking at the updated data sets
- A historical overview of data by hacker
- For files with high complexity, provide suggestions on how to improve the code
- Add more analysis on each file and give useful statistics

Log in or sign up for Devpost to join the conversation.