-
-
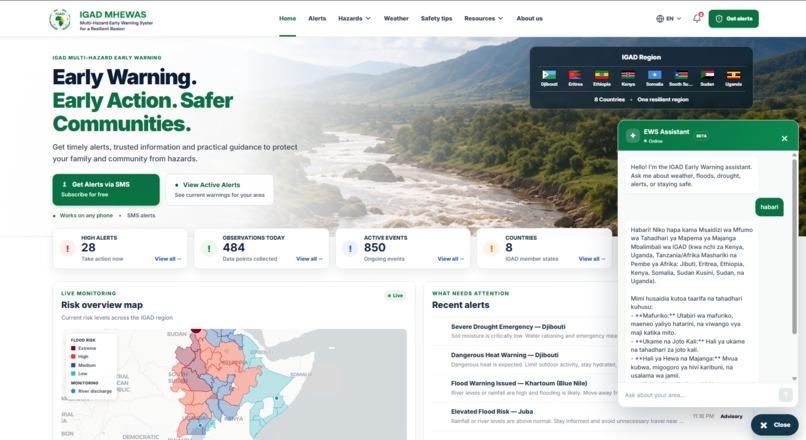
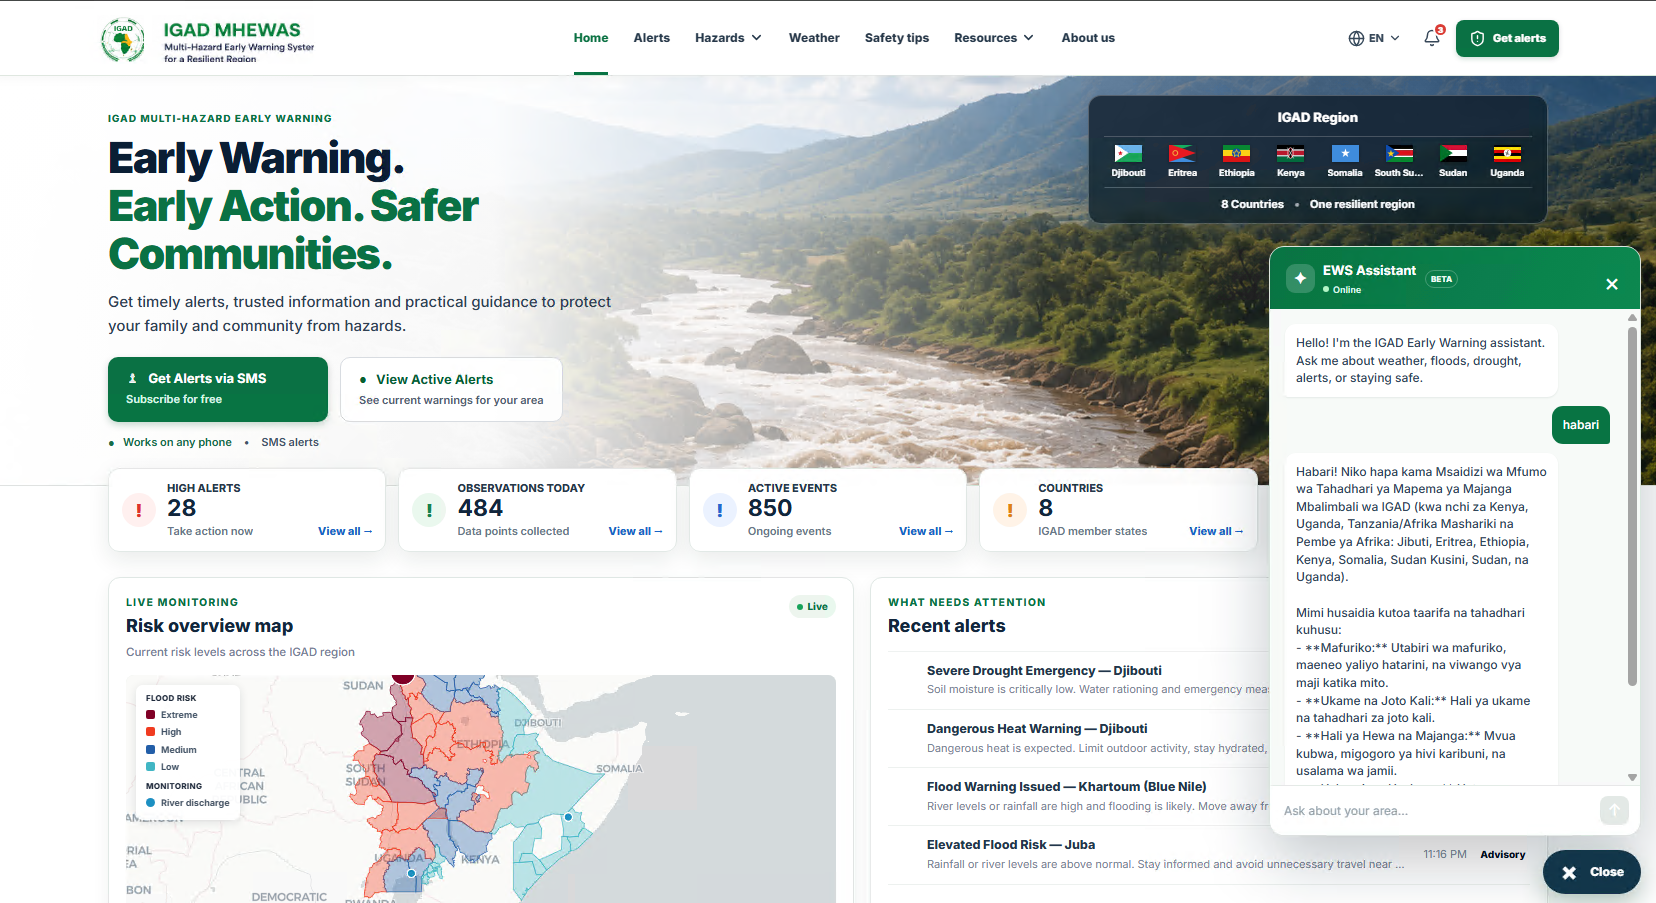
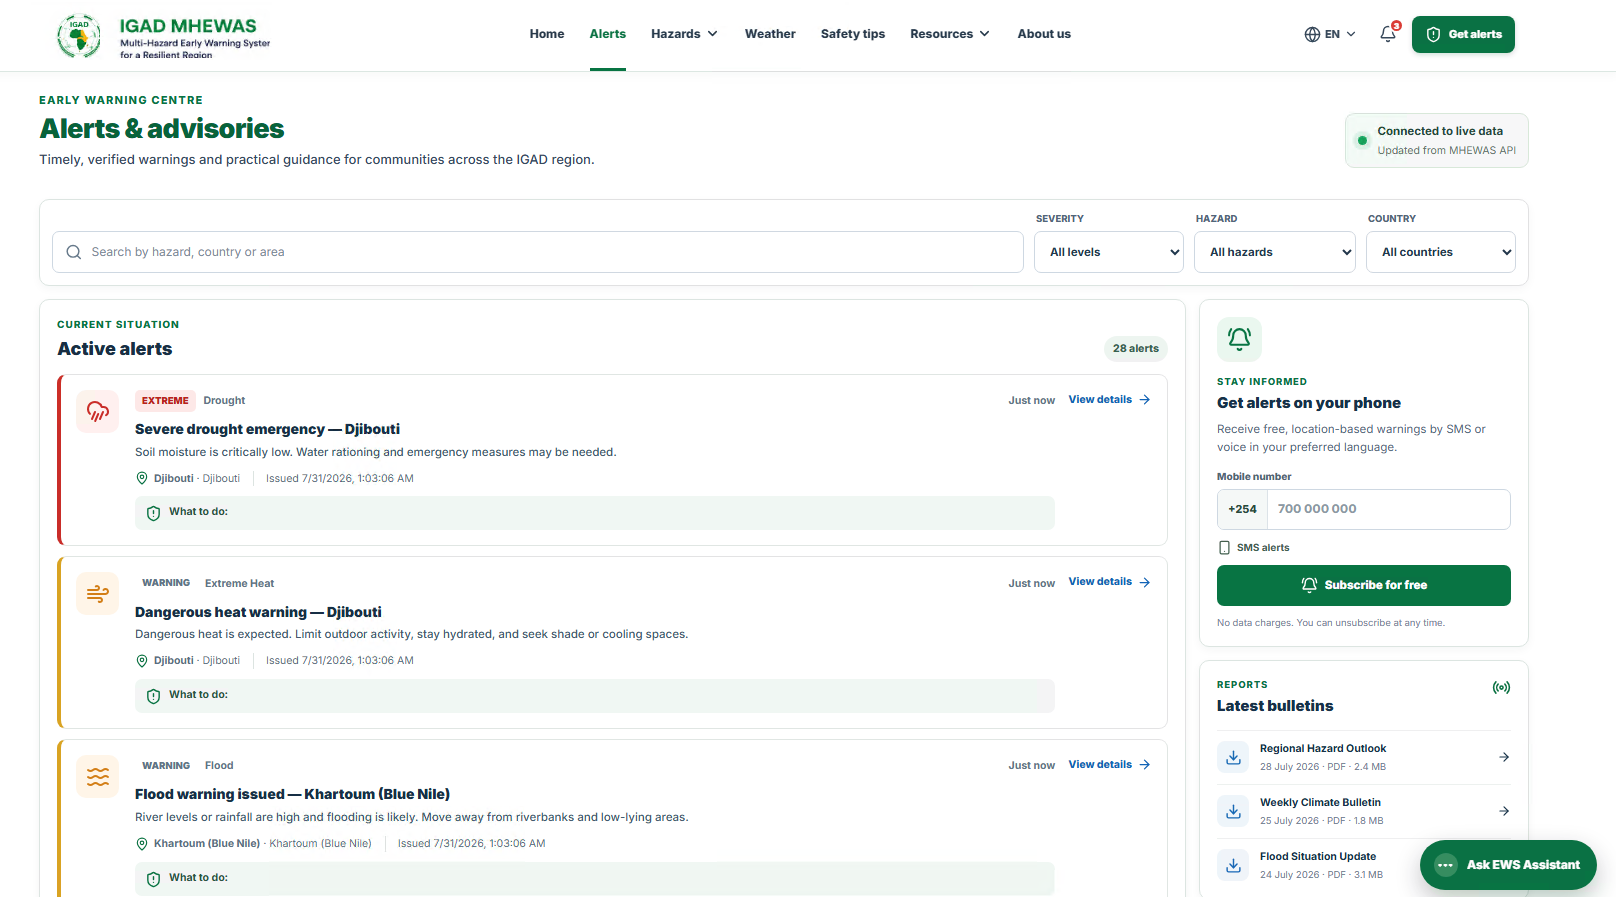
homepage
-
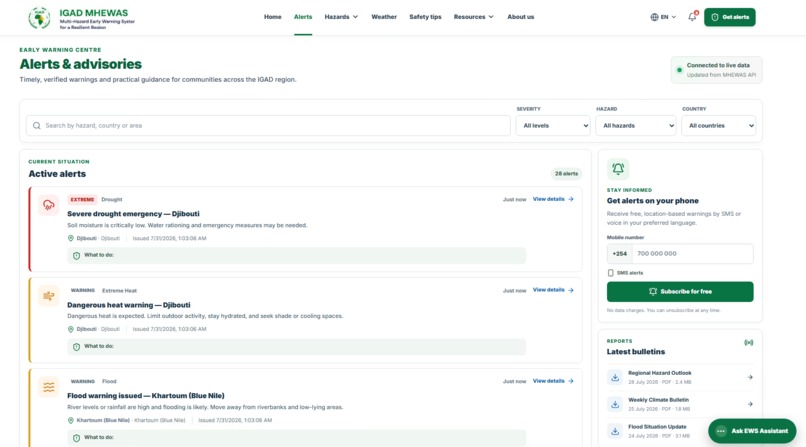
alertpage
-
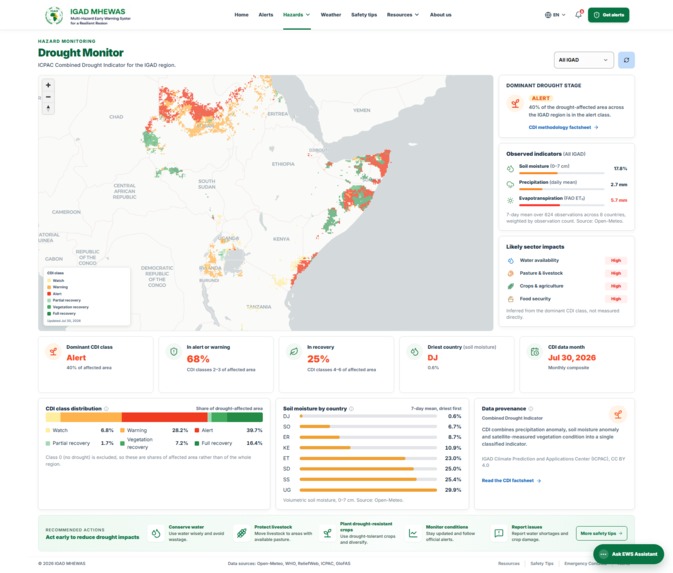
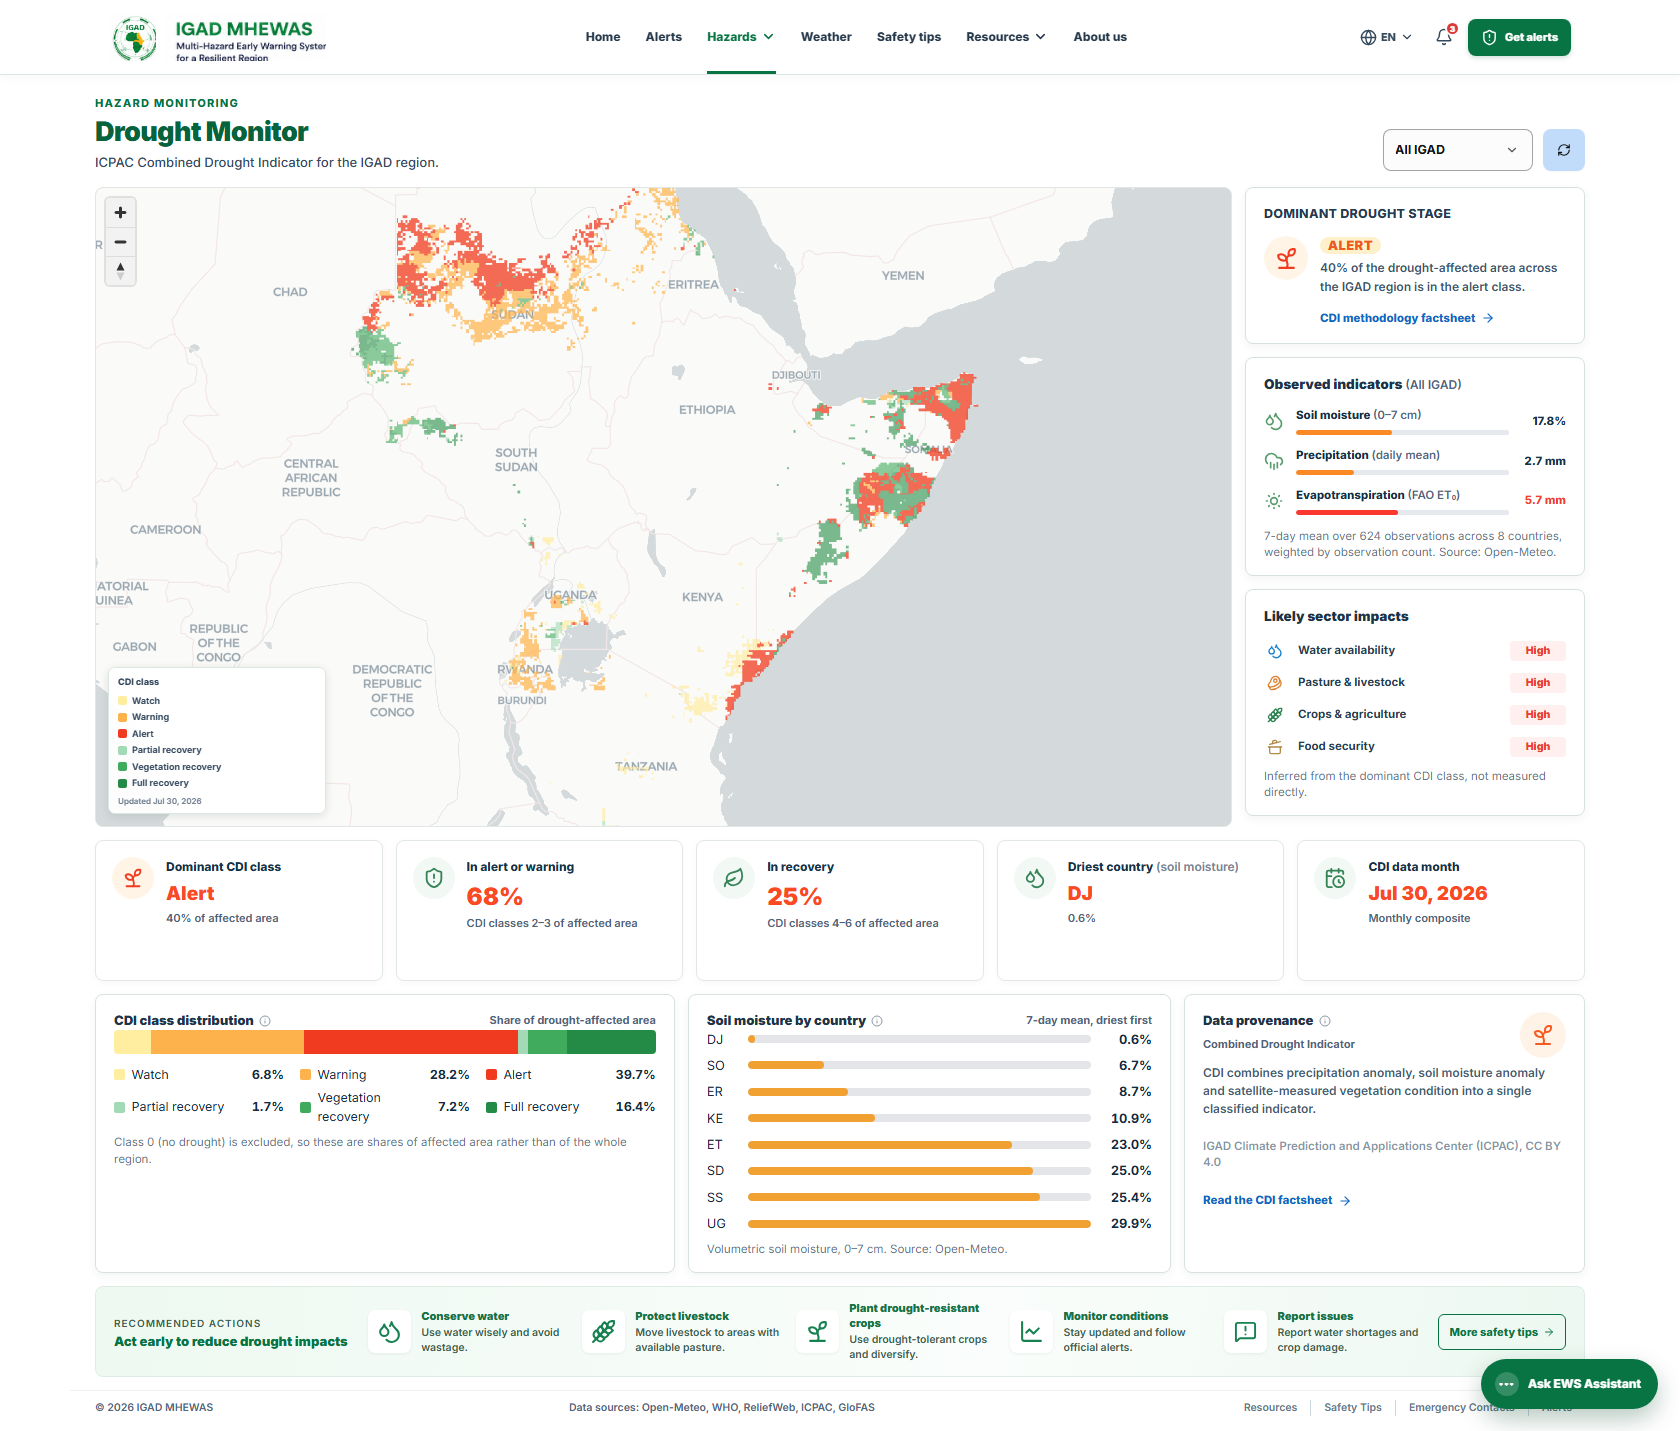
droughtmonitor
-
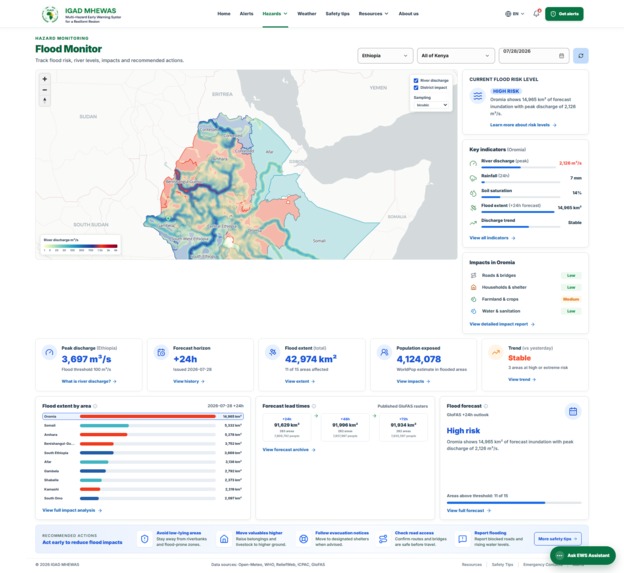
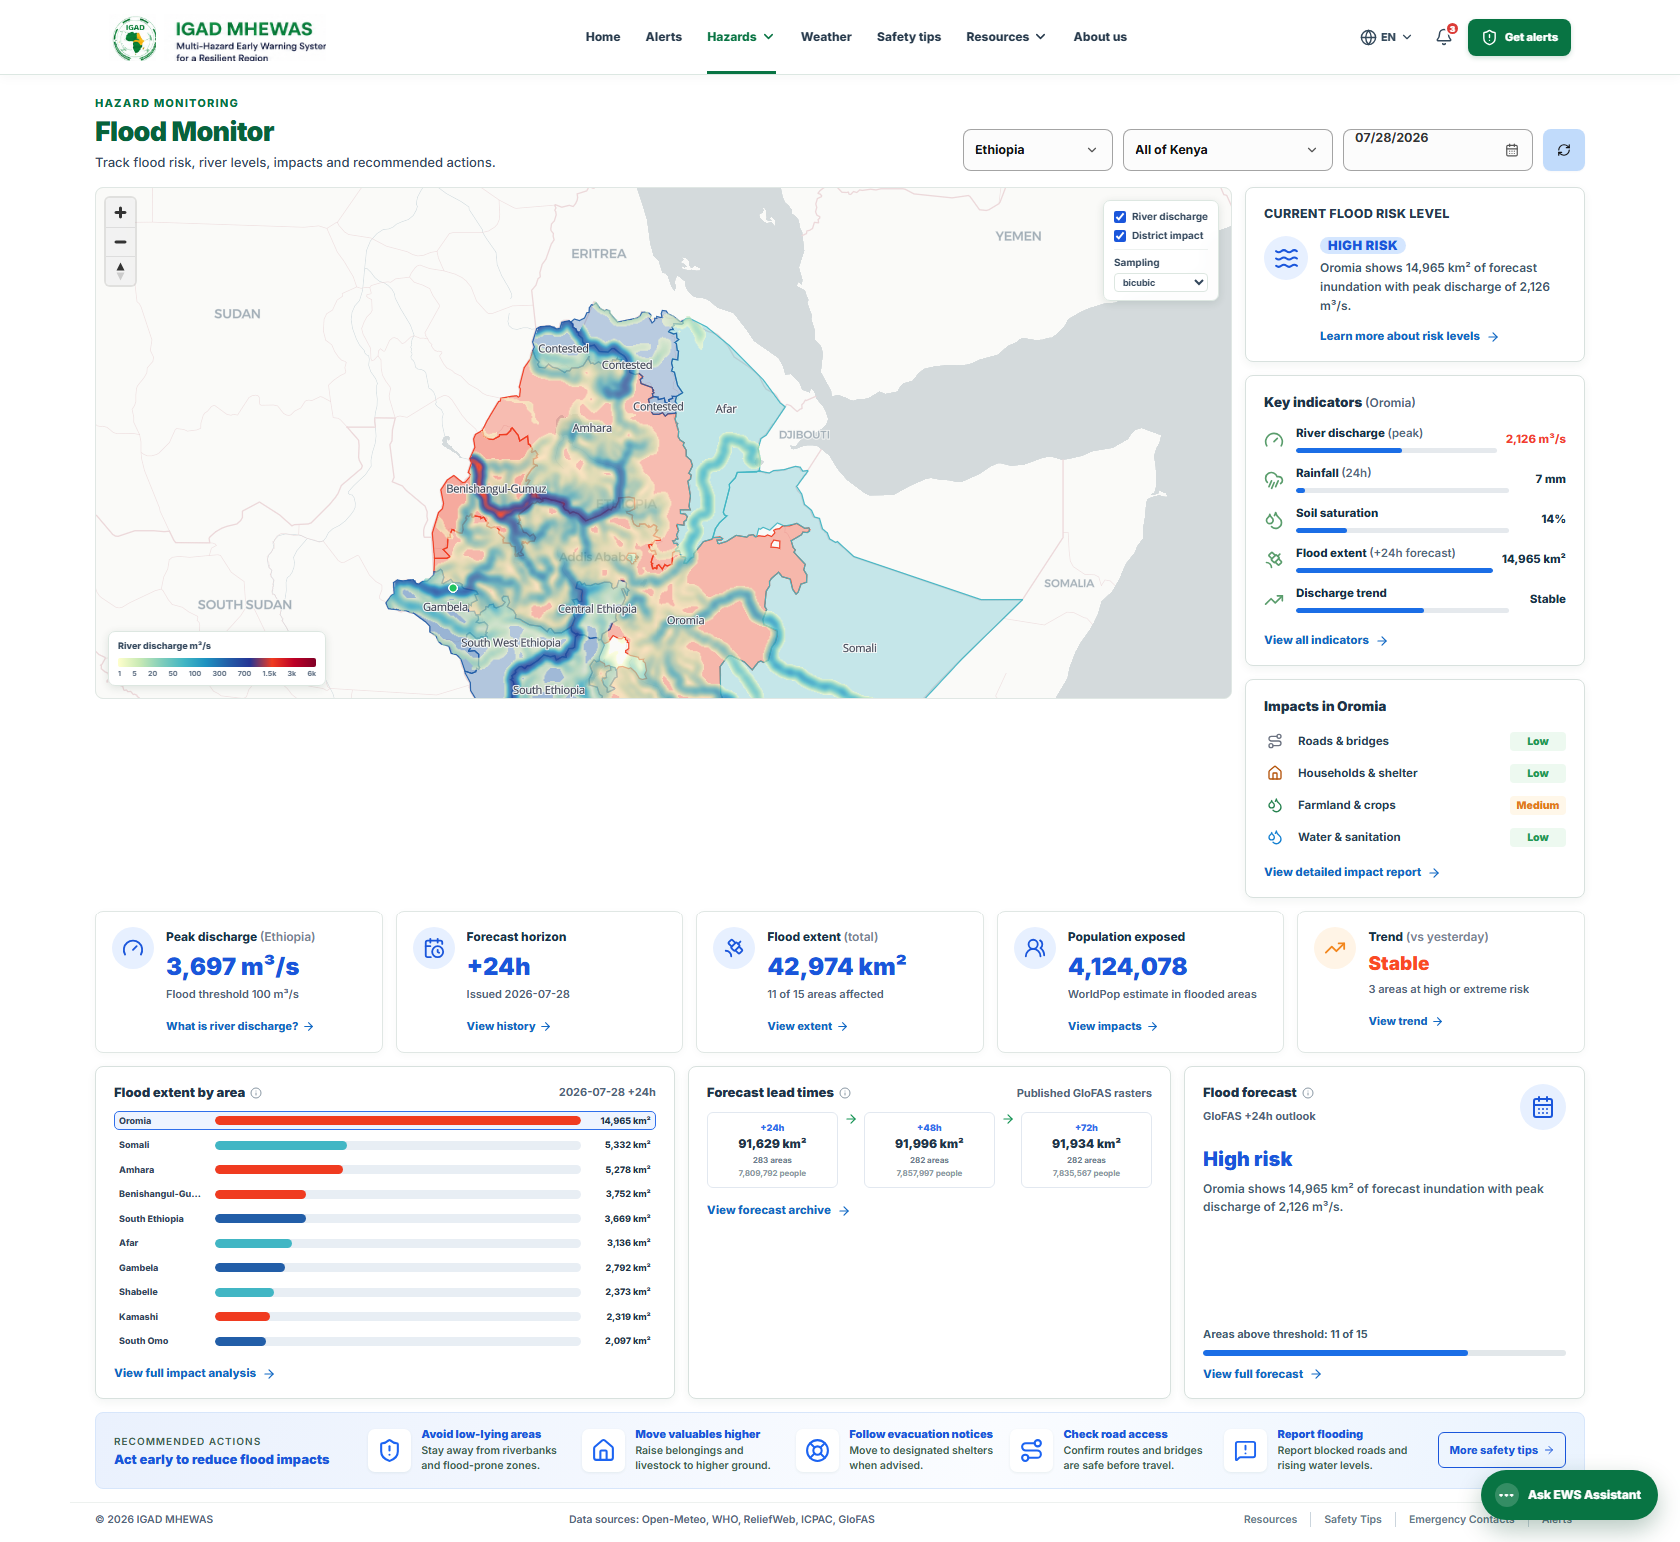
floodmonitor
-
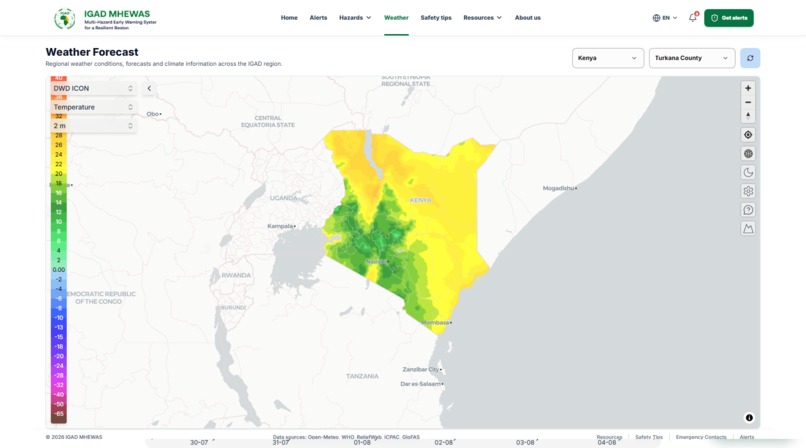
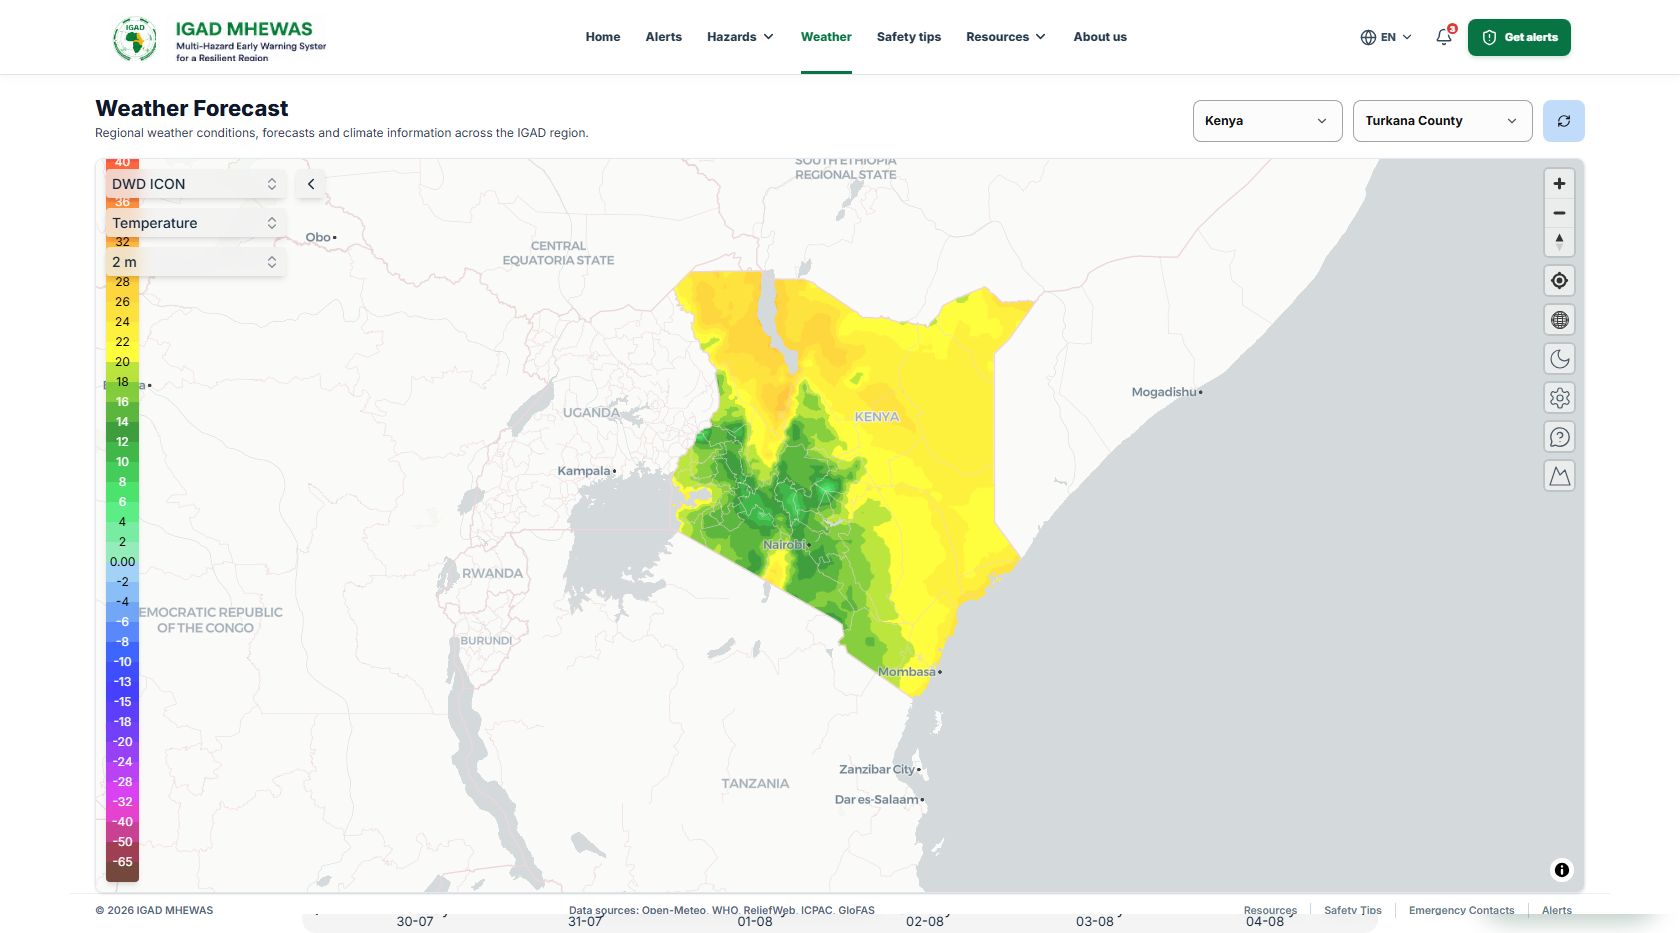
weather
-
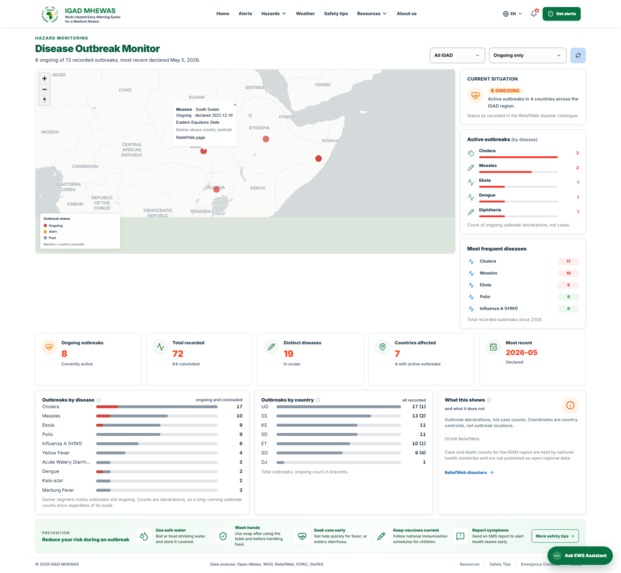
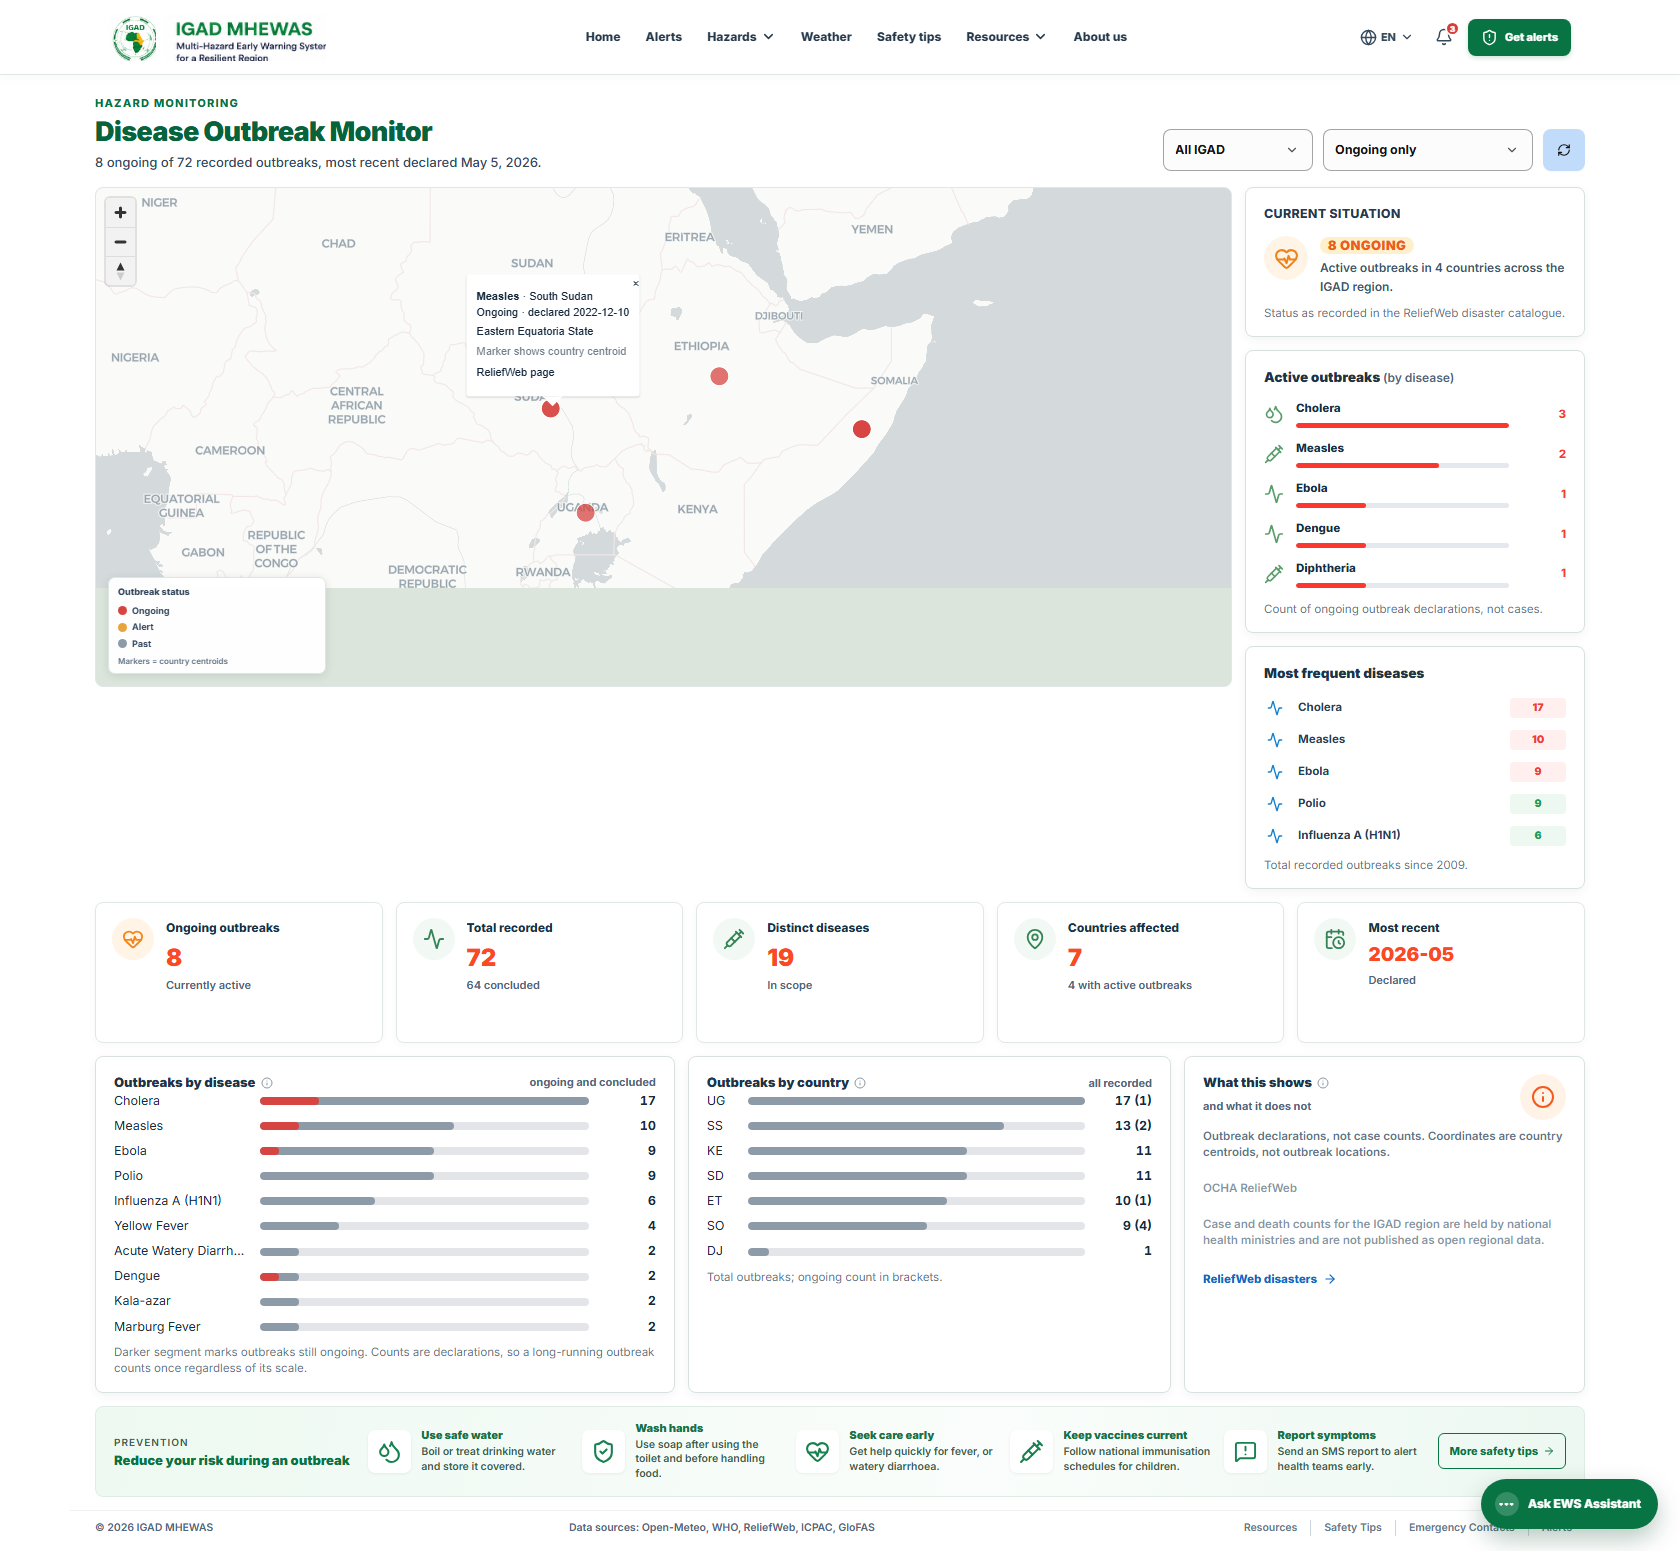
Disease Outbreak Monitor
-
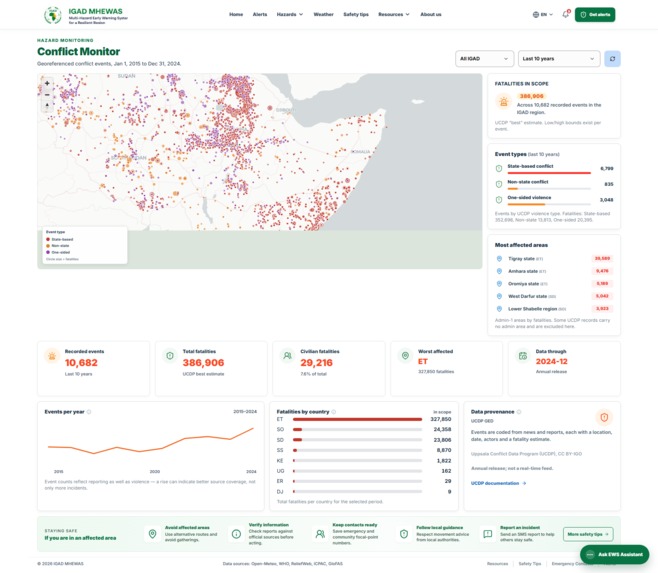
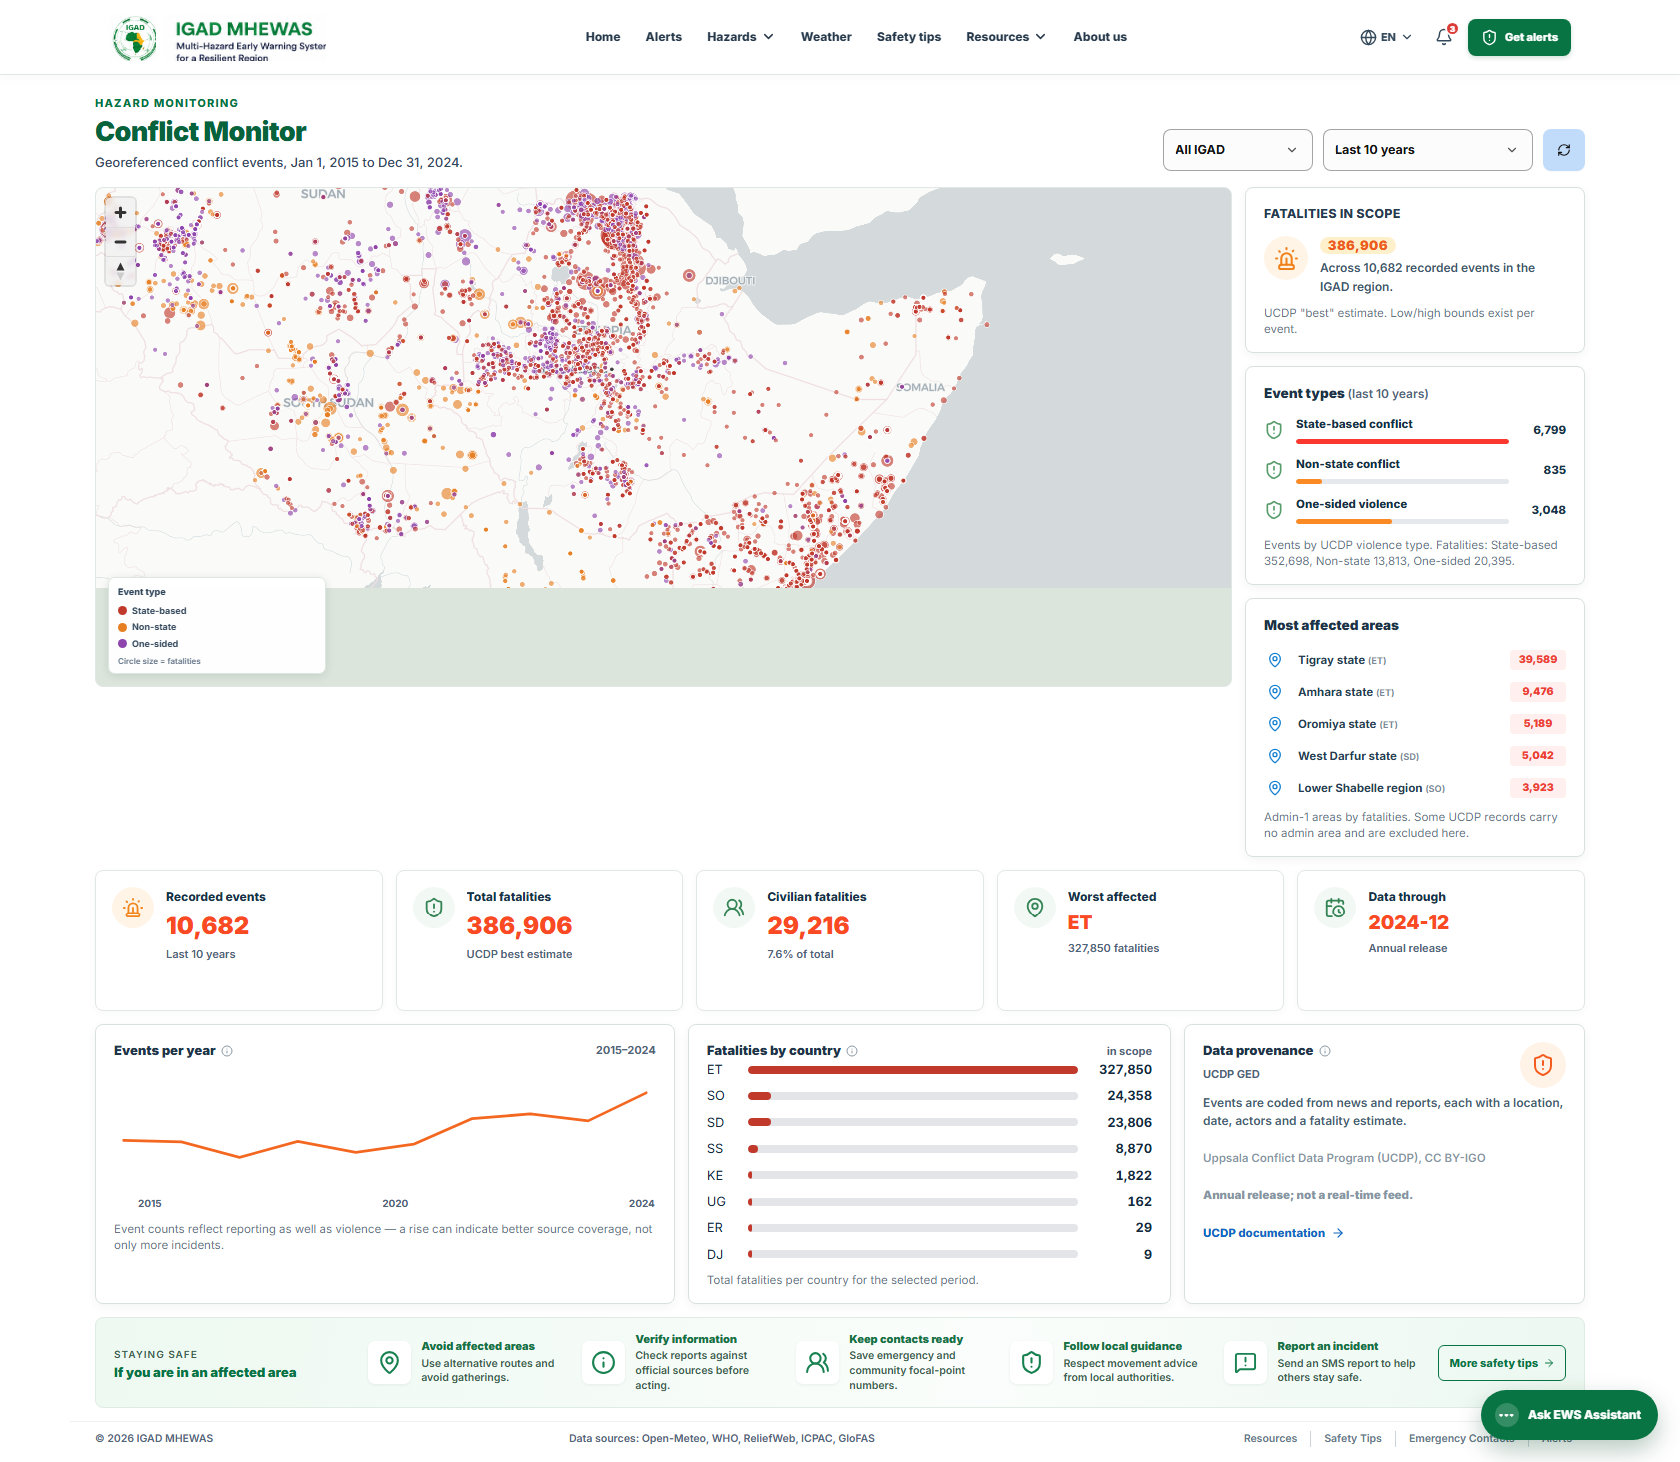
conflict
Inspiration
The data required to protect communities across the Horn of Africa already exists.
Every day, Copernicus publishes GloFAS river-discharge forecasts. WorldPop provides high-resolution population datasets. The World Health Organization publishes Disease Outbreak News, ReliefWeb distributes humanitarian situation reports, and HDX hosts authoritative administrative boundaries for every country in the region. These datasets are publicly available, scientifically reliable, and free to access. The challenge is not the availability of data it's making that data usable. Forecasts are distributed as GRIB rasters. Disease information is exposed through OData feeds. Conflict and humanitarian updates often arrive as lengthy PDF reports. Converting these diverse data sources into a simple question such as:
"Which districts should evacuate today, and approximately how many people are at risk?"
still requires significant manual GIS processing by trained analysts. The same analysis must then be repeated every day as new information becomes available.
The problem is compounded by fragmentation. Floods, droughts, disease outbreaks, conflict, and displacement are managed by different organizations using different systems. As a result, decision-makers rarely have a single view showing multiple hazards occurring simultaneously for example, a district facing flooding while already managing a cholera outbreak and hosting displaced communities.
MHEWAS was created to close this last-mile gap.
Instead of expecting emergency responders to interpret raw scientific datasets, the platform automatically processes geospatial information every day and delivers clear, actionable intelligence through three accessible channels:
- An interactive dashboard
- A developer-friendly REST API
- SMS alerts that reach communities with only a basic mobile phone
The goal is simple: transform complex scientific data into timely decisions that help save lives.
What it does
MHEWAS continuously ingests public hazard data, converts it into district-level intelligence, and delivers actionable information through four integrated channels.
Automated flood impact analysis
Every morning, the platform downloads Copernicus EWDS GloFAS river-discharge forecasts, clips them to the IGAD region, converts them into Cloud-Optimized GeoTIFFs, extracts inundated cells using configurable thresholds, and intersects the resulting flood extents with administrative boundaries stored in PostGIS. Population exposure is then estimated using WorldPop population grids, producing a ranked list of affected districts and estimated populations at risk. This entire workflow replaces what traditionally required several hours of manual GIS analysis.
Five hazards on one regional map
Floods, droughts, conflict, and disease outbreaks each have dedicated interactive map layers powered directly by live backend services rather than static datasets or screenshots. Extreme heat is monitored through weather observations and threshold-based alerting, giving users a unified regional view of multiple hazards within a single platform.
Continuous data ingestion
A scheduled ingestion engine polls eight public data providers every fifteen minutes, including:
- Open-Meteo weather forecasts
- Open-Meteo river discharge
- Open-Meteo soil moisture
- GDACS disaster events
- WHO Disease Outbreak News
- ReliefWeb
- FloodScan through HDX
- Copernicus EWDS
Every raw provider response is archived before parsing. This design ensures that if a provider changes its schema, parsing failures are immediately visible instead of silently causing data loss.
Alerting that reaches communities
Incoming observations are evaluated against calibrated thresholds for river discharge, rainfall, temperature, and soil moisture. The alert engine suppresses duplicate notifications for the same district and hazard within a six-hour window before publishing alerts to the live dashboard through Server-Sent Events. SMS notifications are dispatched through a self-hosted gateway backed by Android relay devices using HMAC-signed requests, eliminating dependence on commercial SMS aggregators. Residents can subscribe using only their phone number and submit hazard reports by replying via SMS.
A conversational assistant
A built-in AI assistant answers natural-language questions such as: "Which districts are currently at flood risk?" Rather than relying solely on general knowledge, the assistant injects current database information into each request, allowing responses to reflect the latest available observations. The assistant automatically detects and responds in English, Swahili, Somali, Amharic, Arabic, French, and Luganda.
A queryable API
The platform exposes approximately fifty REST endpoints.
Every response follows a consistent {data, meta, links} structure containing:
- Request ID
- Data timestamp (
as_of) - Freshness indicator (
data_status)
This allows downstream systems to determine whether returned information is current, stale, or generated while a subsystem is operating in degraded mode.
How we built it
| Layer | Technology |
|---|---|
| Frontend | Svelte 5 (runes), Vite 8, TypeScript 5.7, TailwindCSS 4, Skeleton 5, MapLibre GL 5, Turf.js |
| Backend | Go 1.25.3, standard library net/http routing, pgx/v5 — no web framework, no ORM |
| Database | PostgreSQL 16 with PostGIS 3.4, using 15 versioned migrations executed under an advisory lock |
| Raster Processing | GDAL (gdal_translate, ogr2ogr), TiTiler for serving Cloud-Optimized GeoTIFFs, and a custom Open-Meteo .om encoder |
| Cache | Redis 7 |
| AI | Google Gemini for the conversational assistant and SMS responses |
| SMS | Self-hosted .NET gateway, SignalR hub connected to Android relay devices, HMAC-SHA256 signed webhooks |
| Deployment | Docker Compose with six services, multi-stage Alpine images, and an Nginx SPA proxy |
The backend has two direct dependencies
The backend intentionally keeps its dependency footprint extremely small.
go.mod contains only two direct dependencies: pgx/v5 for PostgreSQL connectivity and pgregory.net/rapid for property-based testing.
Routing is implemented using Go 1.22+ method patterns on http.ServeMux. The router acts as the application's composition root, receiving injected dependencies before registering handlers.
There is no Gin, Echo, Chi, GORM, or any other application framework.
This was a deliberate architectural decision. We wanted to demonstrate that Go's standard library is capable of supporting a production-scale service without unnecessary abstraction, and throughout the project it proved to be more than sufficient.
The flood pipeline is the core of the system
The heart of MHEWAS is a fully automated geospatial processing pipeline that transforms raw river-discharge forecasts into district-level impact assessments.
Copernicus EWDS GloFAS (GRIB)
  → clip to IGAD bounding box           (gdal_translate)
  → Cloud-Optimized GeoTIFF
  → threshold grid → inundated cells
  → bulk COPY into PostgreSQL
  → ST_Intersects against admin_areas
  → district impacts + exposed population (WorldPop zonal analysis)
  → publish .om grid + COG for map tiles
Two implementation details significantly improve both performance and accuracy.
First, every downloaded raster is validated using a checksum. If a newly downloaded file is byte-for-byte identical to the previous version, the expensive spatial analysis is skipped entirely, saving considerable processing time.
Second, administrative boundaries are de-duplicated across nested levels before calculating exposure. This prevents districts from being counted multiple times through both district and regional geometries.
Geodata bootstraps itself
A fresh installation requires no manual GIS preparation.
During the initial startup, the platform automatically:
- Discovers HDX CKAN packages for each IGAD country.
- Downloads official administrative boundaries.
- Reprojects datasets using
ogr2ogr. - Downloads WorldPop 1 km population rasters.
- Computes district-level population totals using zonal intersection.
No shapefiles are committed to the repository, and no manual preprocessing is required.
Running docker compose up on a clean machine automatically produces a complete regional dataset within approximately five to fifteen minutes.
The browser reads real gridded values
Rather than displaying only rendered map images, the processing pipeline also converts raster outputs into Open-Meteo's binary .om format.
The frontend consumes these files directly using @openmeteo/file-reader, allowing users to inspect actual numerical values such as river discharge or soil moisture at any point on the map instead of estimating them from a colour scale.
This provides a much richer analytical experience while maintaining high rendering performance.
Testing
The project contains 56 Go test files covering both unit and property-based testing.
Traditional table-driven tests validate expected behaviour across known scenarios, while property-based tests powered by rapid verify broader invariants that are difficult to capture through manually written examples.
Testing focuses on the components where correctness is most critical, including:
- Flood impact analysis
- Risk scoring
- Data ingestion and parsing
- Gateway routing
- Configuration loading
- SMS language detection
This combination provides confidence in both expected behaviour and edge cases that would otherwise be easy to overlook.
Challenges we ran into
Copernicus has two data stores—and they are not interchangeable
One of the earliest challenges was discovering that GloFAS forecasts are hosted in the Early Warning Data Store (EWDS), not the Climate Data Store (CDS).
Although both platforms belong to Copernicus, they use separate portals, separate user accounts, and separate authentication tokens. A valid CDS credential simply fails against EWDS in a way that initially appears to be an application bug.
Even after authenticating successfully, downloads continued returning HTTP 403 responses until the dataset licence was manually accepted through the web interface. This requirement has no API equivalent, and the error message gives no indication that licence acceptance is the underlying issue.
To make matters more complicated, data requests are asynchronous. Rather than downloading immediately, a job must be submitted and polled until processing completes sometimes taking up to fifteen minutes.
In practice, distinguishing between an authentication problem, an unaccepted licence, and a slow processing queue took longer than implementing the downloader itself.
GRIB to district names is a long processing chain
Transforming a GRIB raster into a reliable list of affected districts involves many independent processing stages, each introducing opportunities for subtle errors.
An incorrect projection, slight grid misalignment, misinterpreted NoData values, or invalid administrative geometries can all produce convincing but incorrect results.
To simplify debugging, the pipeline executes GDAL as external commands rather than linking against native libraries.
Each intermediate output is written to disk, allowing every stage to be inspected independently using tools such as QGIS. This significantly reduced debugging time and made spatial processing far easier to validate.
Double-counted population
Our first implementation produced exposure estimates that were consistently too high.
The cause was nested administrative boundaries.
Flood cells intersected both district and regional polygons, causing the same population to be counted multiple times.
The solution was to de-duplicate intersections by administrative level before calculating exposure.
The broader lesson was that plausible numbers are not necessarily correct. Population estimates should always be validated against known historical events before being trusted in operational decision-making.
What's next for IGAD MHEWAS
As MHEWAS continues to evolve, our focus is on expanding its capabilities, improving operational resilience, and delivering even greater value to governments, humanitarian organizations, and communities across the IGAD region.
Strengthening the Platform
The next phase of development focuses on enhancing the platform's reliability, scalability, and security for large-scale operational deployments.
- Enhanced security and access control. Introduce comprehensive authentication and authorization across administrative services and operational workflows.
- Scalable alert delivery. Optimize the SMS gateway with intelligent rate limiting, improved verification, and enhanced delivery management.
- Operational resilience. Continue strengthening monitoring, automation, and deployment processes to ensure reliable performance across diverse environments.
Advancing Intelligence
The platform already provides a strong foundation for regional early warning, with several advanced capabilities planned to further enhance decision support.
- Advanced risk scoring. Integrate the weighted risk engine to combine multiple hazard indicators, historical trends, and compound-event analysis into more comprehensive risk assessments.
- Multilingual alerts. Expand alert delivery to additional regional languages, enabling communities to receive warnings in their preferred language.
- Semantic knowledge search. Introduce Retrieval-Augmented Generation (RAG) using
pgvectorto enable intelligent search across humanitarian reports, bulletins, and historical events. - Next-generation AI assistance. Expand the conversational assistant with richer recommendations, contextual guidance, and enhanced decision-support capabilities.
Expanding Regional Impact
Looking ahead, MHEWAS will continue growing into a comprehensive regional early warning ecosystem.
- Voice-based alerts (IVR). Deliver early warnings through interactive voice responses in local languages, improving accessibility for communities where SMS may not be sufficient.
- Email situation reports. Generate scheduled summaries for disaster management agencies, humanitarian partners, and government stakeholders.
- Integrated weather services. Consolidate weather data within the MHEWAS backend to provide consistent caching, metadata, and system-wide resilience.
- Higher-resolution analysis. Extend hazard monitoring from district level to ward level where authoritative administrative and population datasets are available.
- Forecast verification and continuous improvement. Measure forecast performance against observed events to continuously refine models and improve warning accuracy.
- Offline-first field operations. Deliver a Progressive Web App (PWA) that enables field officers to continue accessing critical information in areas with limited or intermittent connectivity.
- Complete internationalization. Expand multilingual support across the entire user interface, providing a seamless experience for users throughout the IGAD region.
Quick Start
cp .env.example .env      # Optional: add Copernicus EWDS and Gemini credentials
docker compose up --build
| Service | URL |
|---|---|
| Frontend | http://localhost:3000 |
| Backend API | http://localhost:8080 |
| TiTiler | http://localhost:8600 |
On first startup, MHEWAS automatically downloads administrative boundaries and WorldPop population datasets for all eight IGAD member states. Within approximately 5–15 minutes, the platform is ready to begin generating district-level hazard intelligence.
To manually trigger data processing instead of waiting for the scheduled execution:
./floodctl      # Run the flood analysis pipeline
./geodatactl    # Download and prepare administrative boundaries and population data
Data Sources
MHEWAS integrates authoritative datasets from leading international organizations to provide comprehensive, evidence-based early warning across the Horn of Africa, including:
- Copernicus EWDS / CEMS-GloFAS
- Open-Meteo (weather forecasts, flood forecasts, and soil moisture)
- GDACS
- WHO Disease Outbreak News
- ReliefWeb (OCHA)
- UCDP Georeferenced Conflict Events
- FloodScan
- HDX Common Operational Datasets (Administrative Boundaries)
- WorldPop
- HydroSHEDS (HydroBASINS and HydroRIVERS)
- Geofabrik OpenStreetMap Extracts
Together, these datasets provide the environmental, demographic, humanitarian, and geospatial intelligence required to support timely, accurate, and actionable early warning across the IGAD region.
License
Developed for the IGAD Climate Prediction and Applications Centre (ICPAC) as part of the IGAD Multi-Hazard Early Warning and Early Action initiative.

Log in or sign up for Devpost to join the conversation.