-
-
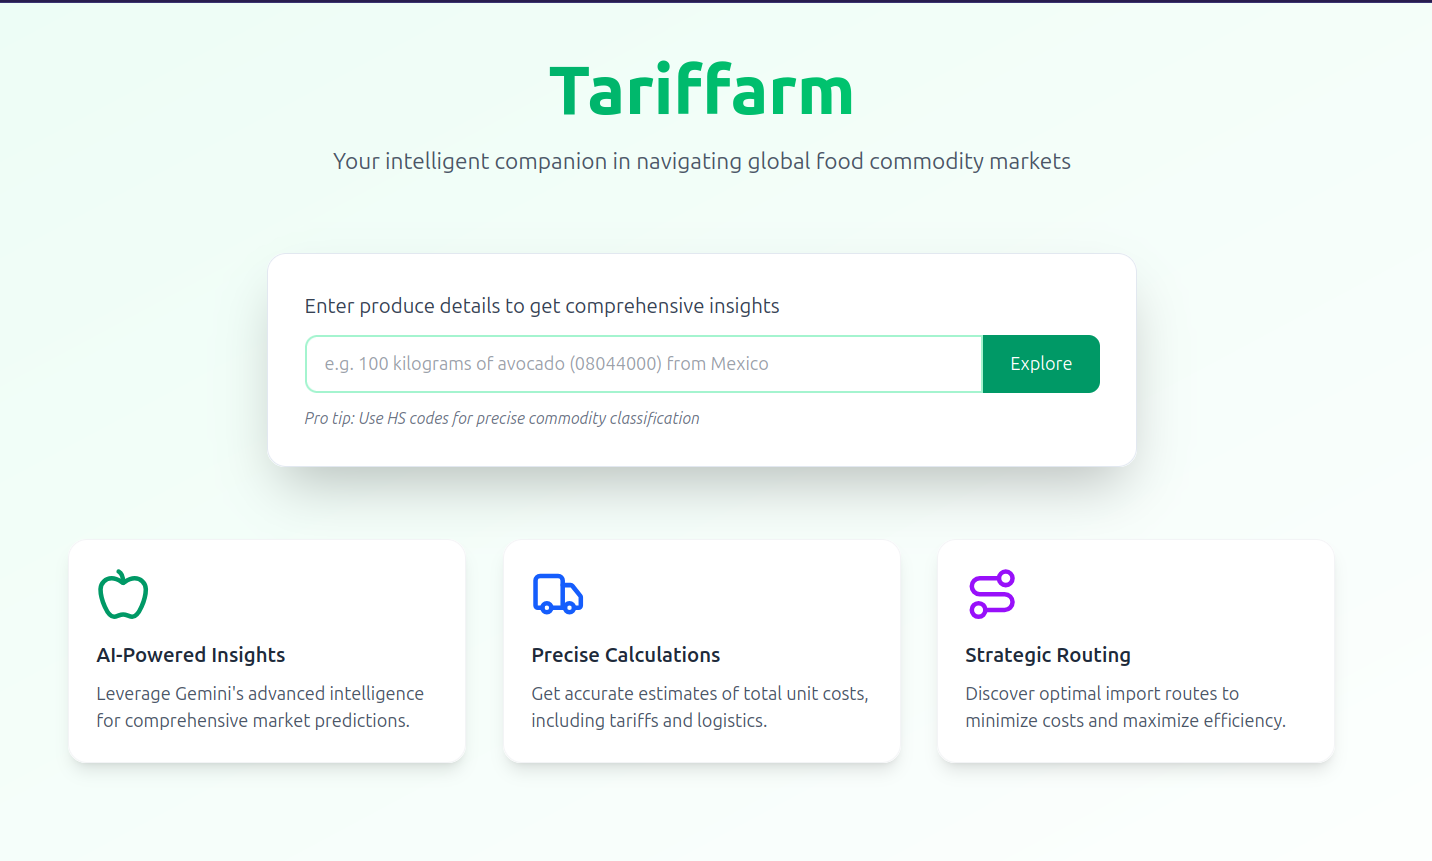
landing page
-
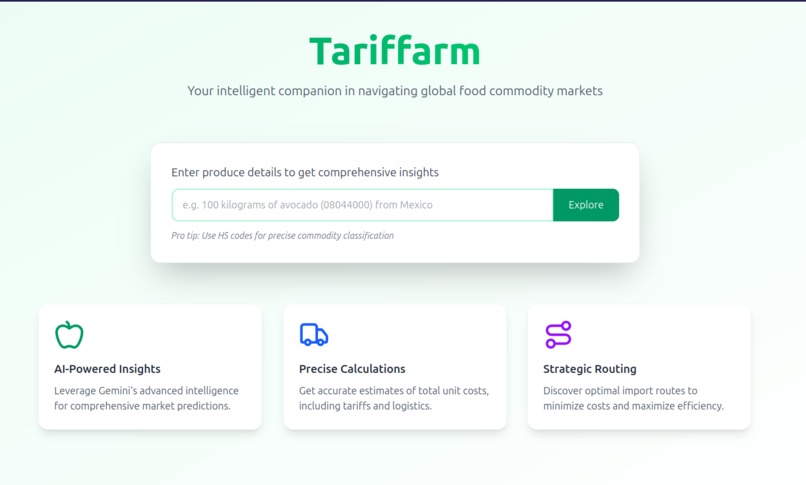
smart search bar powered by Gemini
-
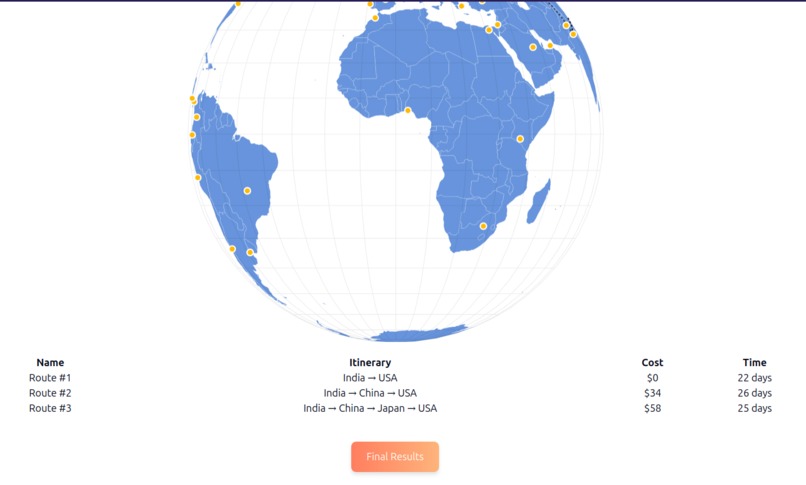
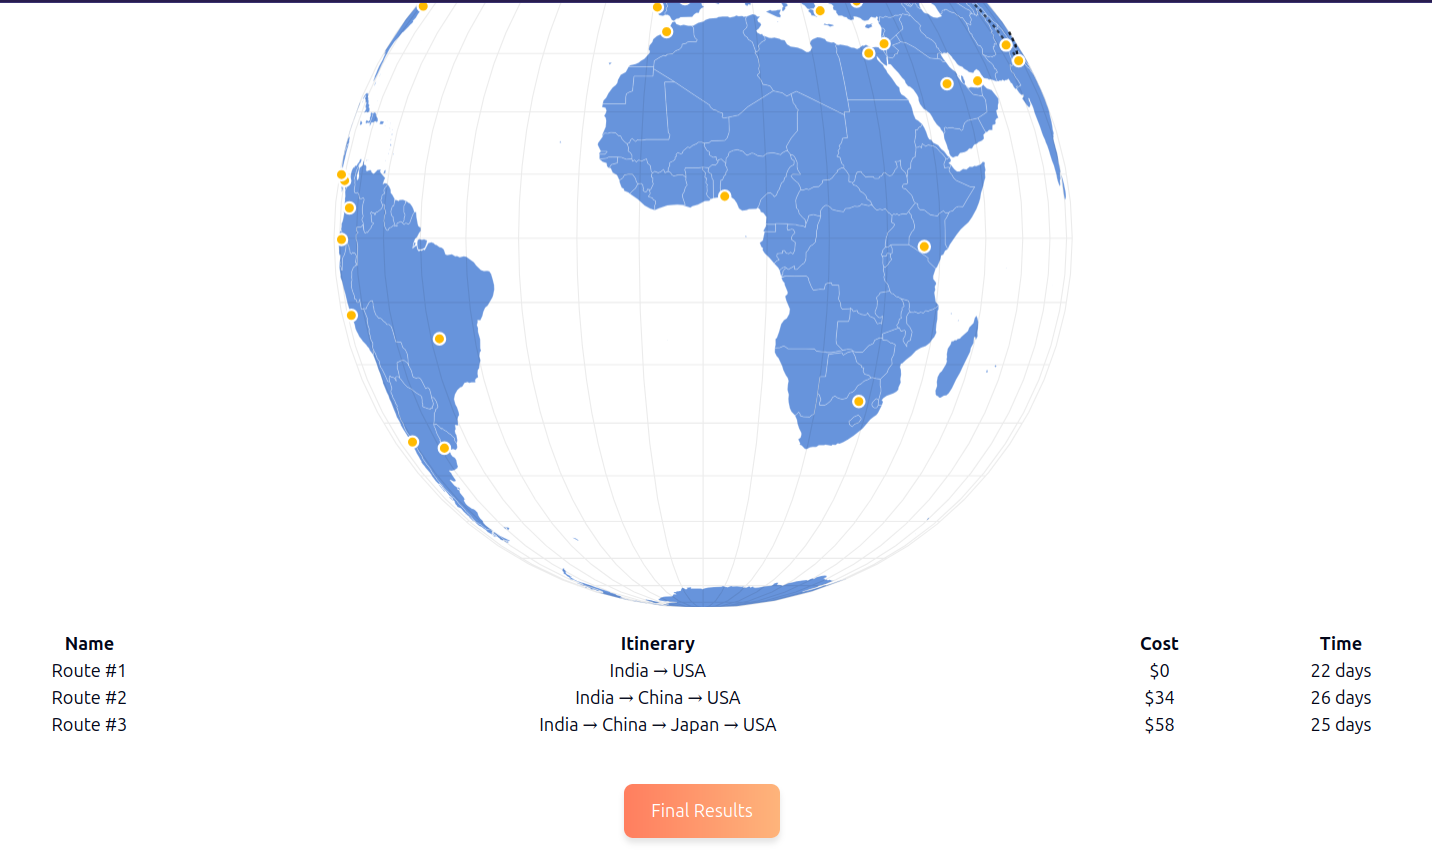
shortest routes and cheapest fees
🌾 Inspiration
We were inspired by the recent changes in tariff policies introduced under the Trump administration, which have significantly impacted global trade dynamics. A study we came across highlighted how smallholder farmers and mid-sized exporting companies often bear the brunt of these sudden policy changes. These groups typically lack access to real-time, transparent trade data.
This gap motivated us to build TARIFFARM — a tool designed to bring clarity, accessibility, and insight to agricultural trade for those who need it most.
🚀 What it does
TARIFFARM is a web-based platform that helps users calculate and visualize the full cost of importing agricultural goods and meat into the U.S.
By entering the product type and origin country, users get:
- 📦 Applicable tariffs, duties, and regulatory fees
- 🛳 Suggested shipping routes (land, sea, or air)
- 🧭 Visuals of transit ports, customs points, and logistics hubs
- 💸 Estimated total cost and delivery time
- 📊 Detailed cost breakdowns (freight, handling, permits, cold chain logistics, customs)
🛠 How we built it
We started by wireframing the platform in Figma to define our user flows and features.
Then, we moved on to development, starting with backend logic and progressing to frontend integration.
Tech stack:
- 💻 Python – backend calculations
- ⚛️ React + Next.js – frontend framework
- 🎨 Tailwind CSS – responsive styling
- 🌐 amCharts – interactive 3D globe visualizations
- 🤖 Gemini AI – logic augmentation & dynamic responses
- 🧩 HTML, CSS, JavaScript – core UI and customizations
- 🚀 Vercel – deployment
🧩 Challenges we ran into
- On day one, we accidentally merged incorrectly, causing a major conflict in the repo.
- We lost over 2 hours of progress and had to restart our repo — not once, but twice.
- Later, when integrating amCharts 3D, we ran into persistent bugs while customizing the globe for our data layers.
Despite all this, we pushed through.
🏆 Accomplishments that we're proud of
- Successfully implemented tools we’d never used before, like Gemini AI and amCharts 3D
- Navigated complex visualizations and customizations under pressure
- Most importantly, we finished a full working MVP in under 24 hours, even after serious setbacks
We’re proud of the teamwork we showed through it all.
📚 What we learned
- The importance of repo discipline and project backup.
- How to collaborate and resolve conflicts under high pressure
- Best practices for API integration, live data handling, and library extensions
- A real appreciation for planning, tracking progress in smaller commits, and setting boundaries during a build.
🔮 What's next for TARIFFARM
TARIFFARM was designed to adapt as trade policies continue to evolve. Here’s what’s coming next:
- 🌍 Add support for all countries in our database
- 🗺 Introduce city-level routing for more granular logistics mapping
- 📈 Integrate dynamic commodity price APIs for real-time calculations
- 🧠 Enhance our 3D data visualizations to include layered analytics like trade risk and seasonal pricing
We’re excited to keep developing TARIFFARM into a tool that serves farmers, exporters, and traders around the world.


Log in or sign up for Devpost to join the conversation.