-
-
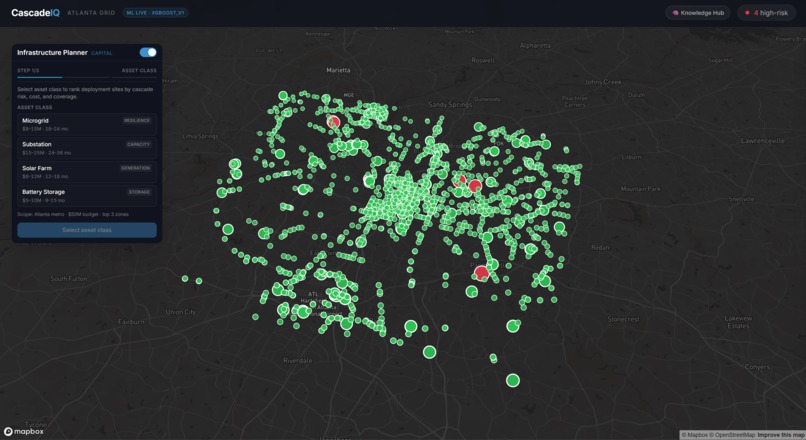
Homepage
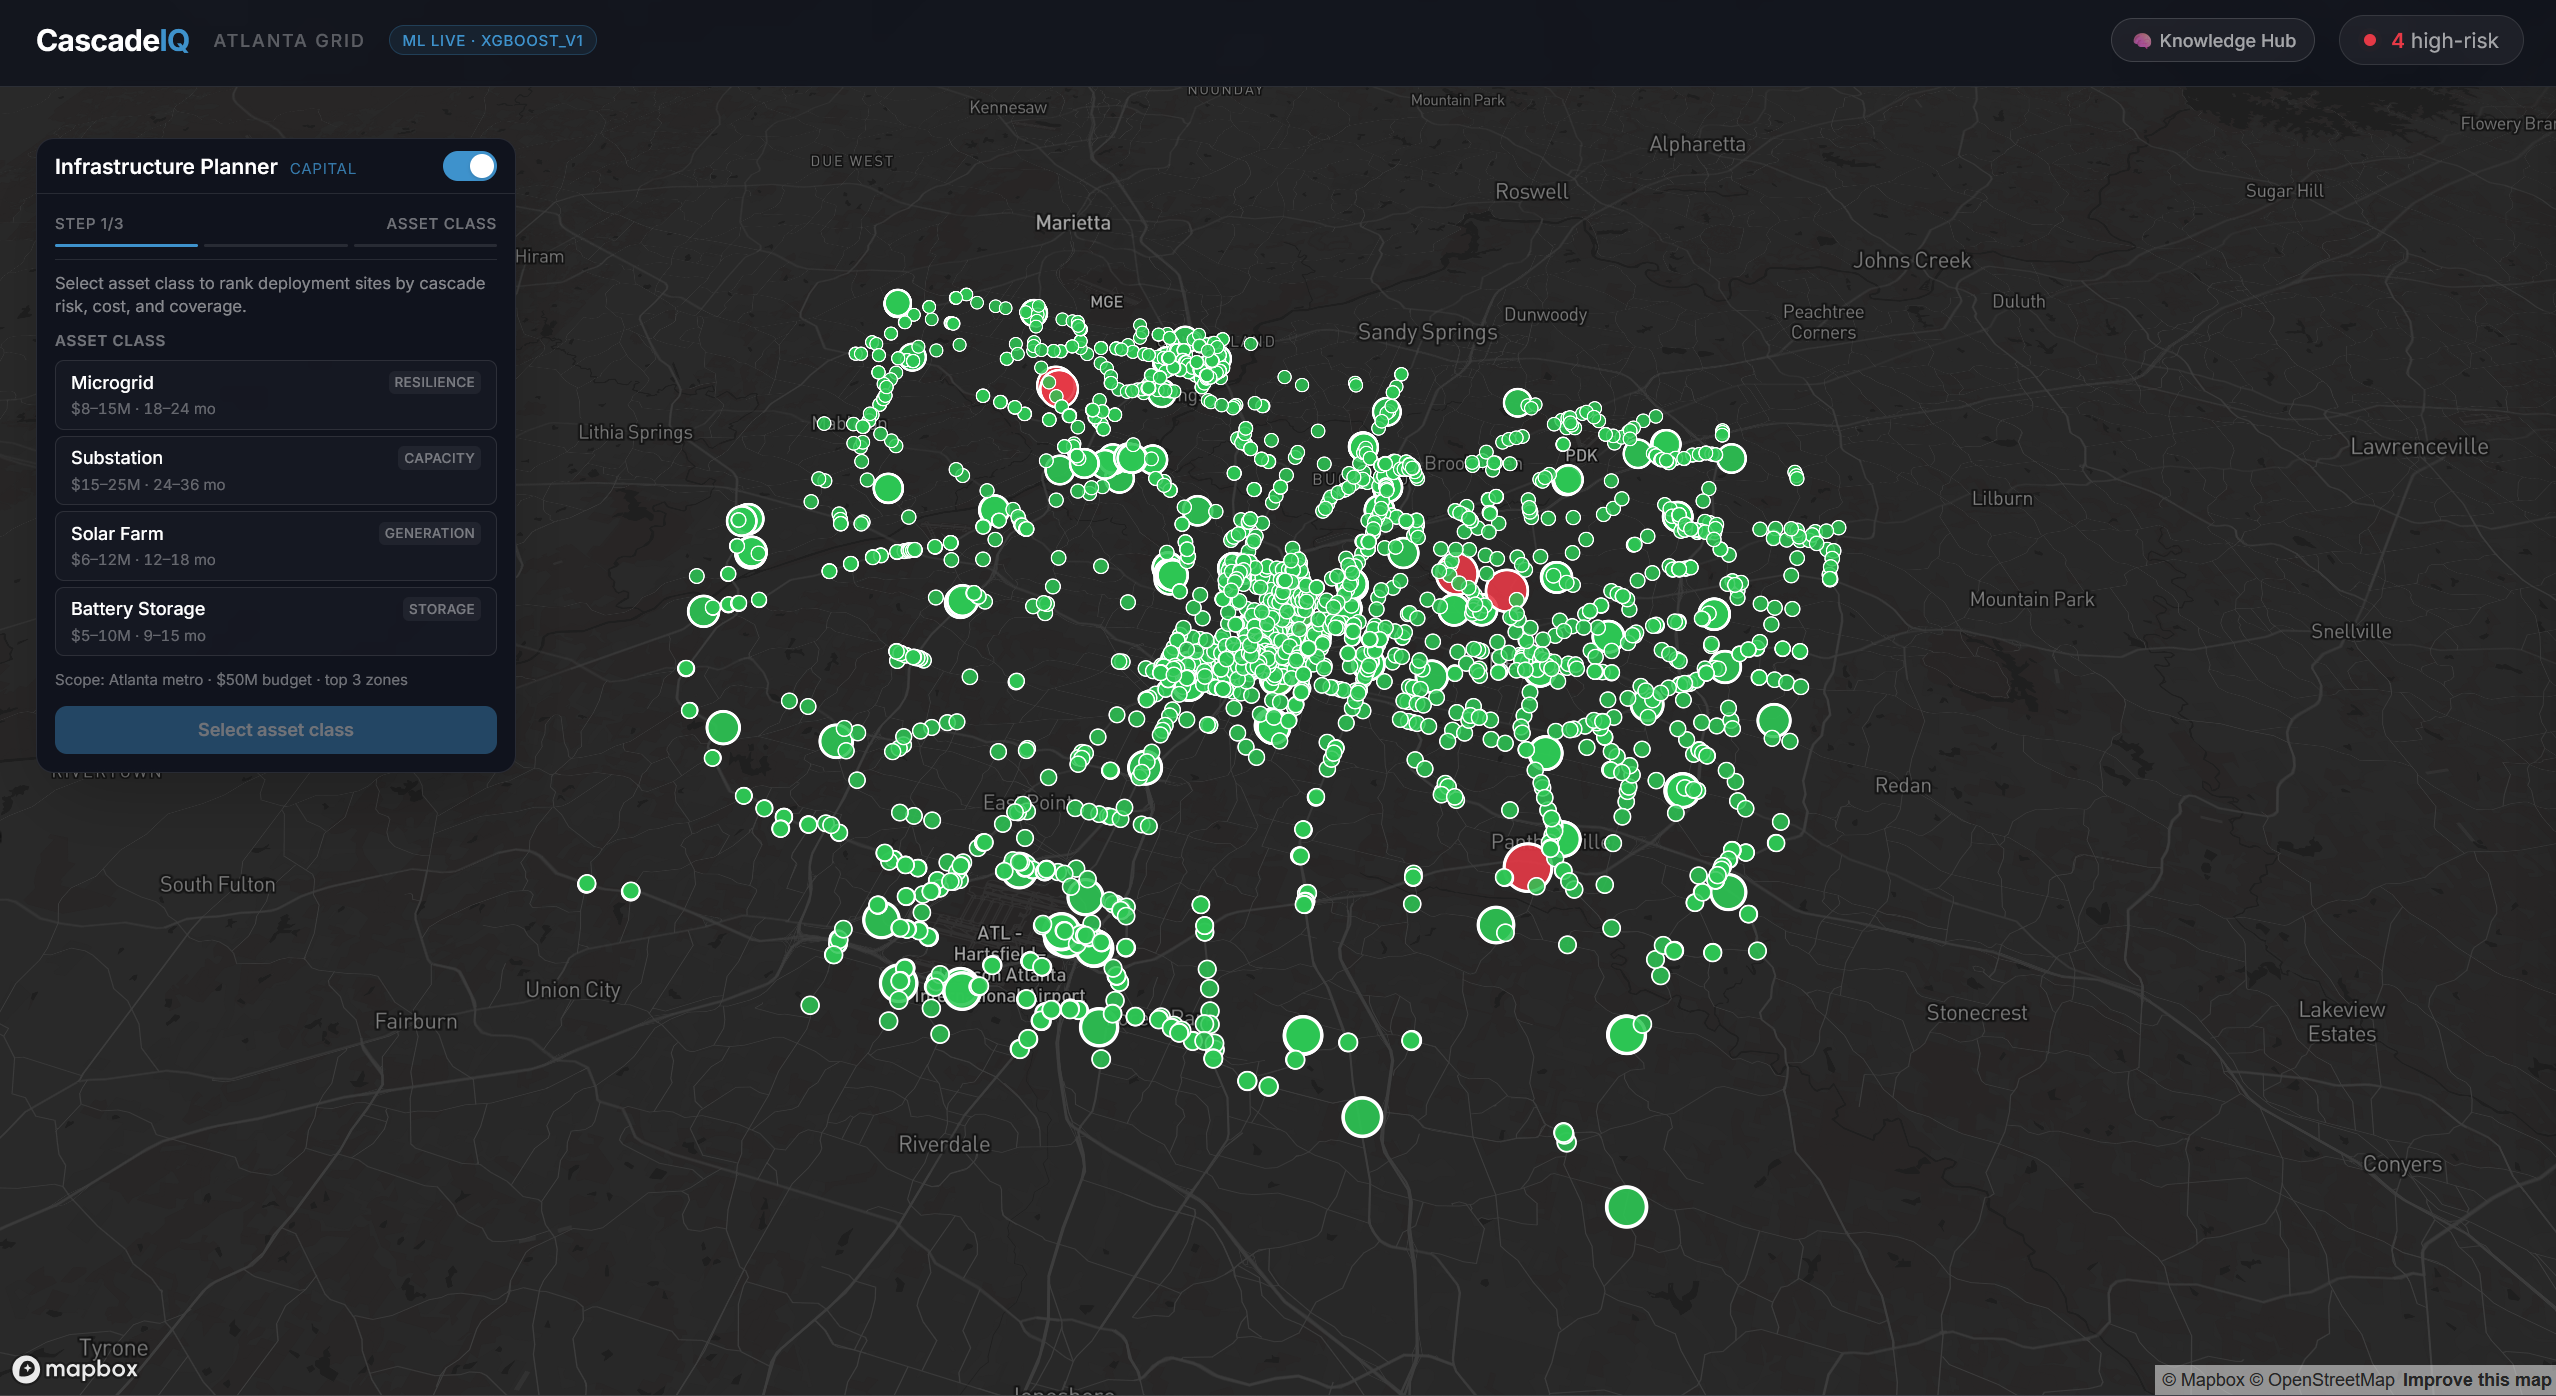
CascadeIQ
3D Infrastructure Resilience Simulation Platform
Cox Play With Purpose Hackathon — Energy Track, Southern Company, Atlanta GA
What It Does
CascadeIQ is a real-time grid intelligence platform that simulates cascade failures across Atlanta's and Macon's energy infrastructure. It combines live risk scoring, AI-powered analysis, and an institutional knowledge layer to answer the question: when a transformer fails, what goes dark — and does anyone know how to fix it?
Core capabilities:
- Interactive 3D map of 2,535 real energy assets (transformers, MARTA stations, hospitals, solar farms, data centers, switching stations, and more)
- Cascade failure simulation — click any transformer to see which hospitals, MARTA stations, and traffic signals go dark
- ML risk scoring (XGBoost + rule-based hybrid) updated in real time
- AI agent (Claude) for natural language infrastructure queries
- Knowledge Intelligence Layer — 20+ years of simulated maintenance records, incident reports, and engineer retirement risk analysis
- Build mode — simulate deploying solar farms, microgrids, and BESS to reduce network risk
Quick Start
Prerequisites: Python 3.10+, Node 18+, Anthropic API key, Mapbox token
1. Clone and set up environment
git clone <repo>
cd InfraIQ
Create C:\InfraIQ\.env:
ANTHROPIC_API_KEY=sk-ant-...
Create C:\InfraIQ\frontend\.env:
VITE_MAPBOX_TOKEN=pk.eyJ1...
VITE_BACKEND_URL=http://localhost:8080
2. Install backend dependencies
cd backend
pip install -r requirements.txt
3. Start the backend
cd C:\InfraIQ\backend
python -m uvicorn main:app --host 0.0.0.0 --port 8080
When you see Application startup complete, the server is ready.
API docs: http://localhost:8080/docs
4. Start the frontend
cd C:\InfraIQ\frontend
npm install
npm run dev
App: http://localhost:5173 (or next available port)
Architecture
InfraIQ/
├── backend/
│   ├── main.py              # FastAPI app, all 14+ endpoints, port 8080
│   └── knowledge_engine.py  # Knowledge extraction engine (Claude + rule-based)
├── frontend/
│   └── src/
│       ├── App.jsx               # Root — state, asset selection, demo flow
│       ├── Map.jsx               # Mapbox GL 3D map layer
│       ├── SidePanel.jsx         # Right panel — risk scores, cascade impact
│       ├── KnowledgePanel.jsx    # Left panel — Timeline / Knowledge / Ingest tabs
│       ├── KnowledgeDashboard.jsx # Full overlay — 4-section knowledge hub
│       ├── BuildMode.jsx         # Infrastructure build simulation UI
│       ├── AgentInput.jsx        # Natural language AI query bar
│       └── api.js                # All backend API calls
├── data/
│   ├── raw/
│   │   ├── maintenance_records.json  # 300 work orders (2003–2026)
│   │   ├── incident_reports.json     # 40 incidents (2020–2024)
│   │   ├── retirement_records.json   # 8 engineers
│   │   └── procedures.json           # 25 SOPs (11 outdated)
│   └── processed/
│       ├── assets.json          # 2,535 grid assets
│       ├── assets.geojson       # GeoJSON for map rendering
│       └── graph.json           # Dependency graph for cascade simulation
└── scripts/
    ├── fetch_new_assets.py      # Pulls from Overpass API (OSM)
    └── gen_company_data_final.py # Generates all simulated records
API Endpoints
All endpoints at http://localhost:8080
| Method | Path | Description |
|---|---|---|
| GET | /health |
Server status + asset count |
| GET | /assets |
GeoJSON of all 2,535 assets + map_config |
| GET | /stats |
Network health grade, cost exposure, by-type breakdown |
| GET | /top-risks |
Top 10 highest-risk transformers |
| GET | /cascade/{asset_id} |
Cascade failure simulation for an asset |
| POST | /optimize |
Budget optimization for infrastructure investments |
| POST | /agent |
AI agent — natural language queries |
| GET | /asset/{asset_id}/knowledge |
Knowledge for a specific asset |
| GET | /knowledge/stats |
Overall knowledge health metrics |
| GET | /knowledge/blindspots |
Assets with zero documentation |
| GET | /knowledge/retirement-risk |
Retiring engineers and at-risk assets |
| GET | /knowledge/patterns |
Cross-asset patterns discovered by AI |
| GET | /knowledge/procedures |
SOPs with outdated procedure detection |
| GET | /knowledge/timeline/{asset_id} |
Chronological event history for an asset |
| POST | /knowledge/ingest |
Paste any document; AI extracts and attaches knowledge |
Knowledge Intelligence Layer
The Knowledge Intelligence Layer addresses a real problem in utility companies: critical operational knowledge lives in engineers' heads, not in any system. When a 38-year veteran retires, so does the knowledge of which transformer shares a grounding bus with MARTA, which switching sequence takes 11 hours instead of 3, and which units can safely run at 115% nameplate for 4 hours.
What it does
- 300 maintenance records spanning 2003–2026, authored by 10 technicians with realistic field notes
- 40 incident reports including the 2021 Atlanta heat dome, 2022 Hurricane Ian, 2023 ice storm, and 2024 data center overload
- 8 retirement records tracking knowledge risk as engineers leave (Dave Morrison: 8% captured; James Harrison: 5% captured)
- 25 SOPs, 11 flagged as outdated (referencing discontinued equipment: Westinghouse BG-3, GE HV-1, ABB type 27)
- Knowledge extraction engine (
knowledge_engine.py) matches records to assets by lat/lon proximity (500m radius), extracts patterns using Claude, identifies blind spots, and scores knowledge risk
How to use in the UI
- Click any asset on the map — the Knowledge Panel slides in from the left (Timeline tab shows chronological history; Knowledge tab shows AI-extracted patterns and health trajectory; Ingest tab lets you paste any document for AI extraction)
- Click "🧠 Knowledge Hub" in the header — opens the full dashboard showing coverage grade, retiring engineers, most dangerous blind spots, and cross-asset patterns
- Red assets in Knowledge View = blind spots (zero documentation + high failure risk)
Demo Flow
The panel shortcut Ctrl+Shift+D (or Cmd+Shift+D) runs an automated demo sequence.
Manual demo for judges:
- Map loads with 2,535 assets across Atlanta and Macon
- Click "🧠 Knowledge Hub" → show the F-grade knowledge coverage (only 14.3% of transformers documented)
- See "Dave Morrison retiring" — 38 years experience, 8% captured, 47 assets at risk
- Close dashboard, click a red transformer on the map
- Right panel: high failure probability, cascade impacts 7 MARTA stations
- Left panel (Timeline tab): scroll through 20 years of field notes — senior engineers flagging the same thermal issue every August since 2008
- Left panel (Knowledge tab): AI-extracted pattern — "recurring thermal stress, unit undersized for 1987 load profile"
- Left panel (Ingest tab): paste a work order → AI extracts facts and attaches to asset
- Ask the agent: "Which transformers need urgent action before summer?"
Data Sources
- Asset locations: OpenStreetMap via Overpass API (transformers, substations, solar farms, MARTA stations, hospitals, power plants, data centers, EV charging)
- Risk scores: XGBoost ML model + rule-based scoring (age, load, thermal history, cascade score)
- Maintenance records: Simulated from realistic Southern Company operational patterns
- Geographic coverage: Atlanta Metro + Macon GA (statewide Georgia view auto-detected)
Team
Built for the Cox Play With Purpose Hackathon — Energy Track, powered by Southern Company infrastructure data and the Atlanta grid.

Log in or sign up for Devpost to join the conversation.