Inspiration
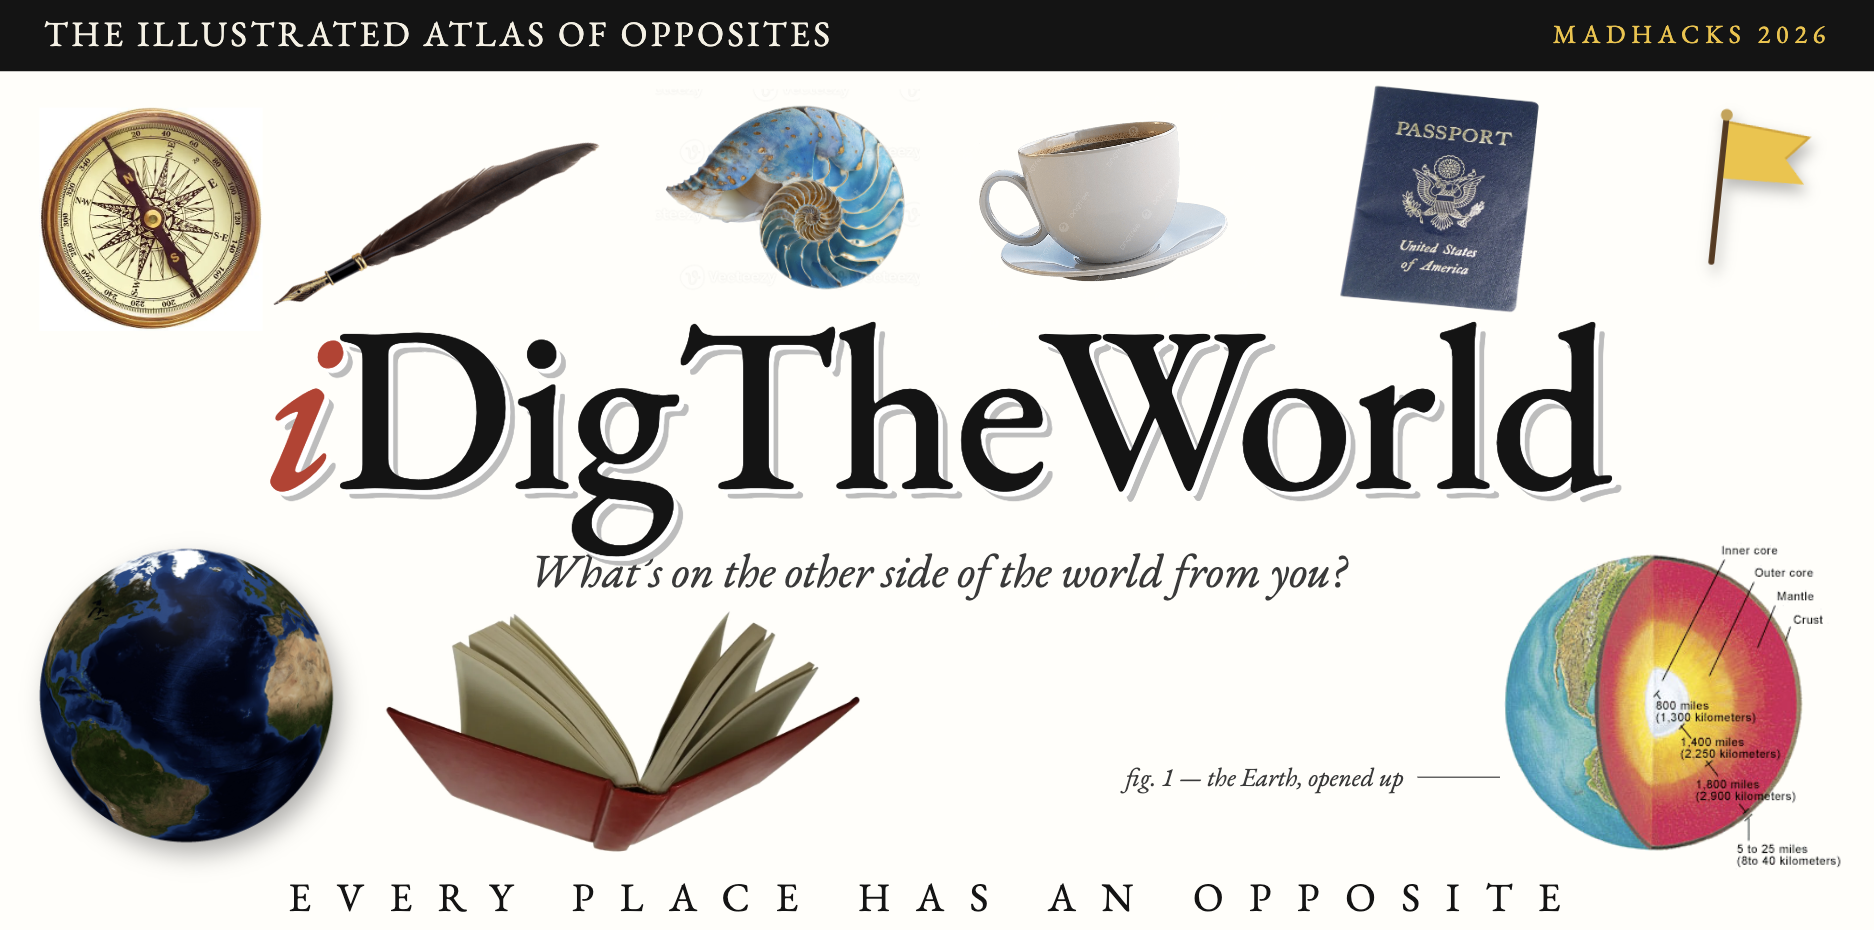
As kids, we've all wondered what would happen if we dug straight down. Would we end up in China? (Spoiler: from most of the US, you'd end up in the Indian Ocean!!!) We wanted to turn that childhood question into a way to learn about the world, and to build it in the style of the wonder-inspiring, magical illustrated encyclopedias and CD-ROMs of the 1990s, a look now called "Utopian Scholastic".
You could say we took "let's dig in" quite literally!
What it does
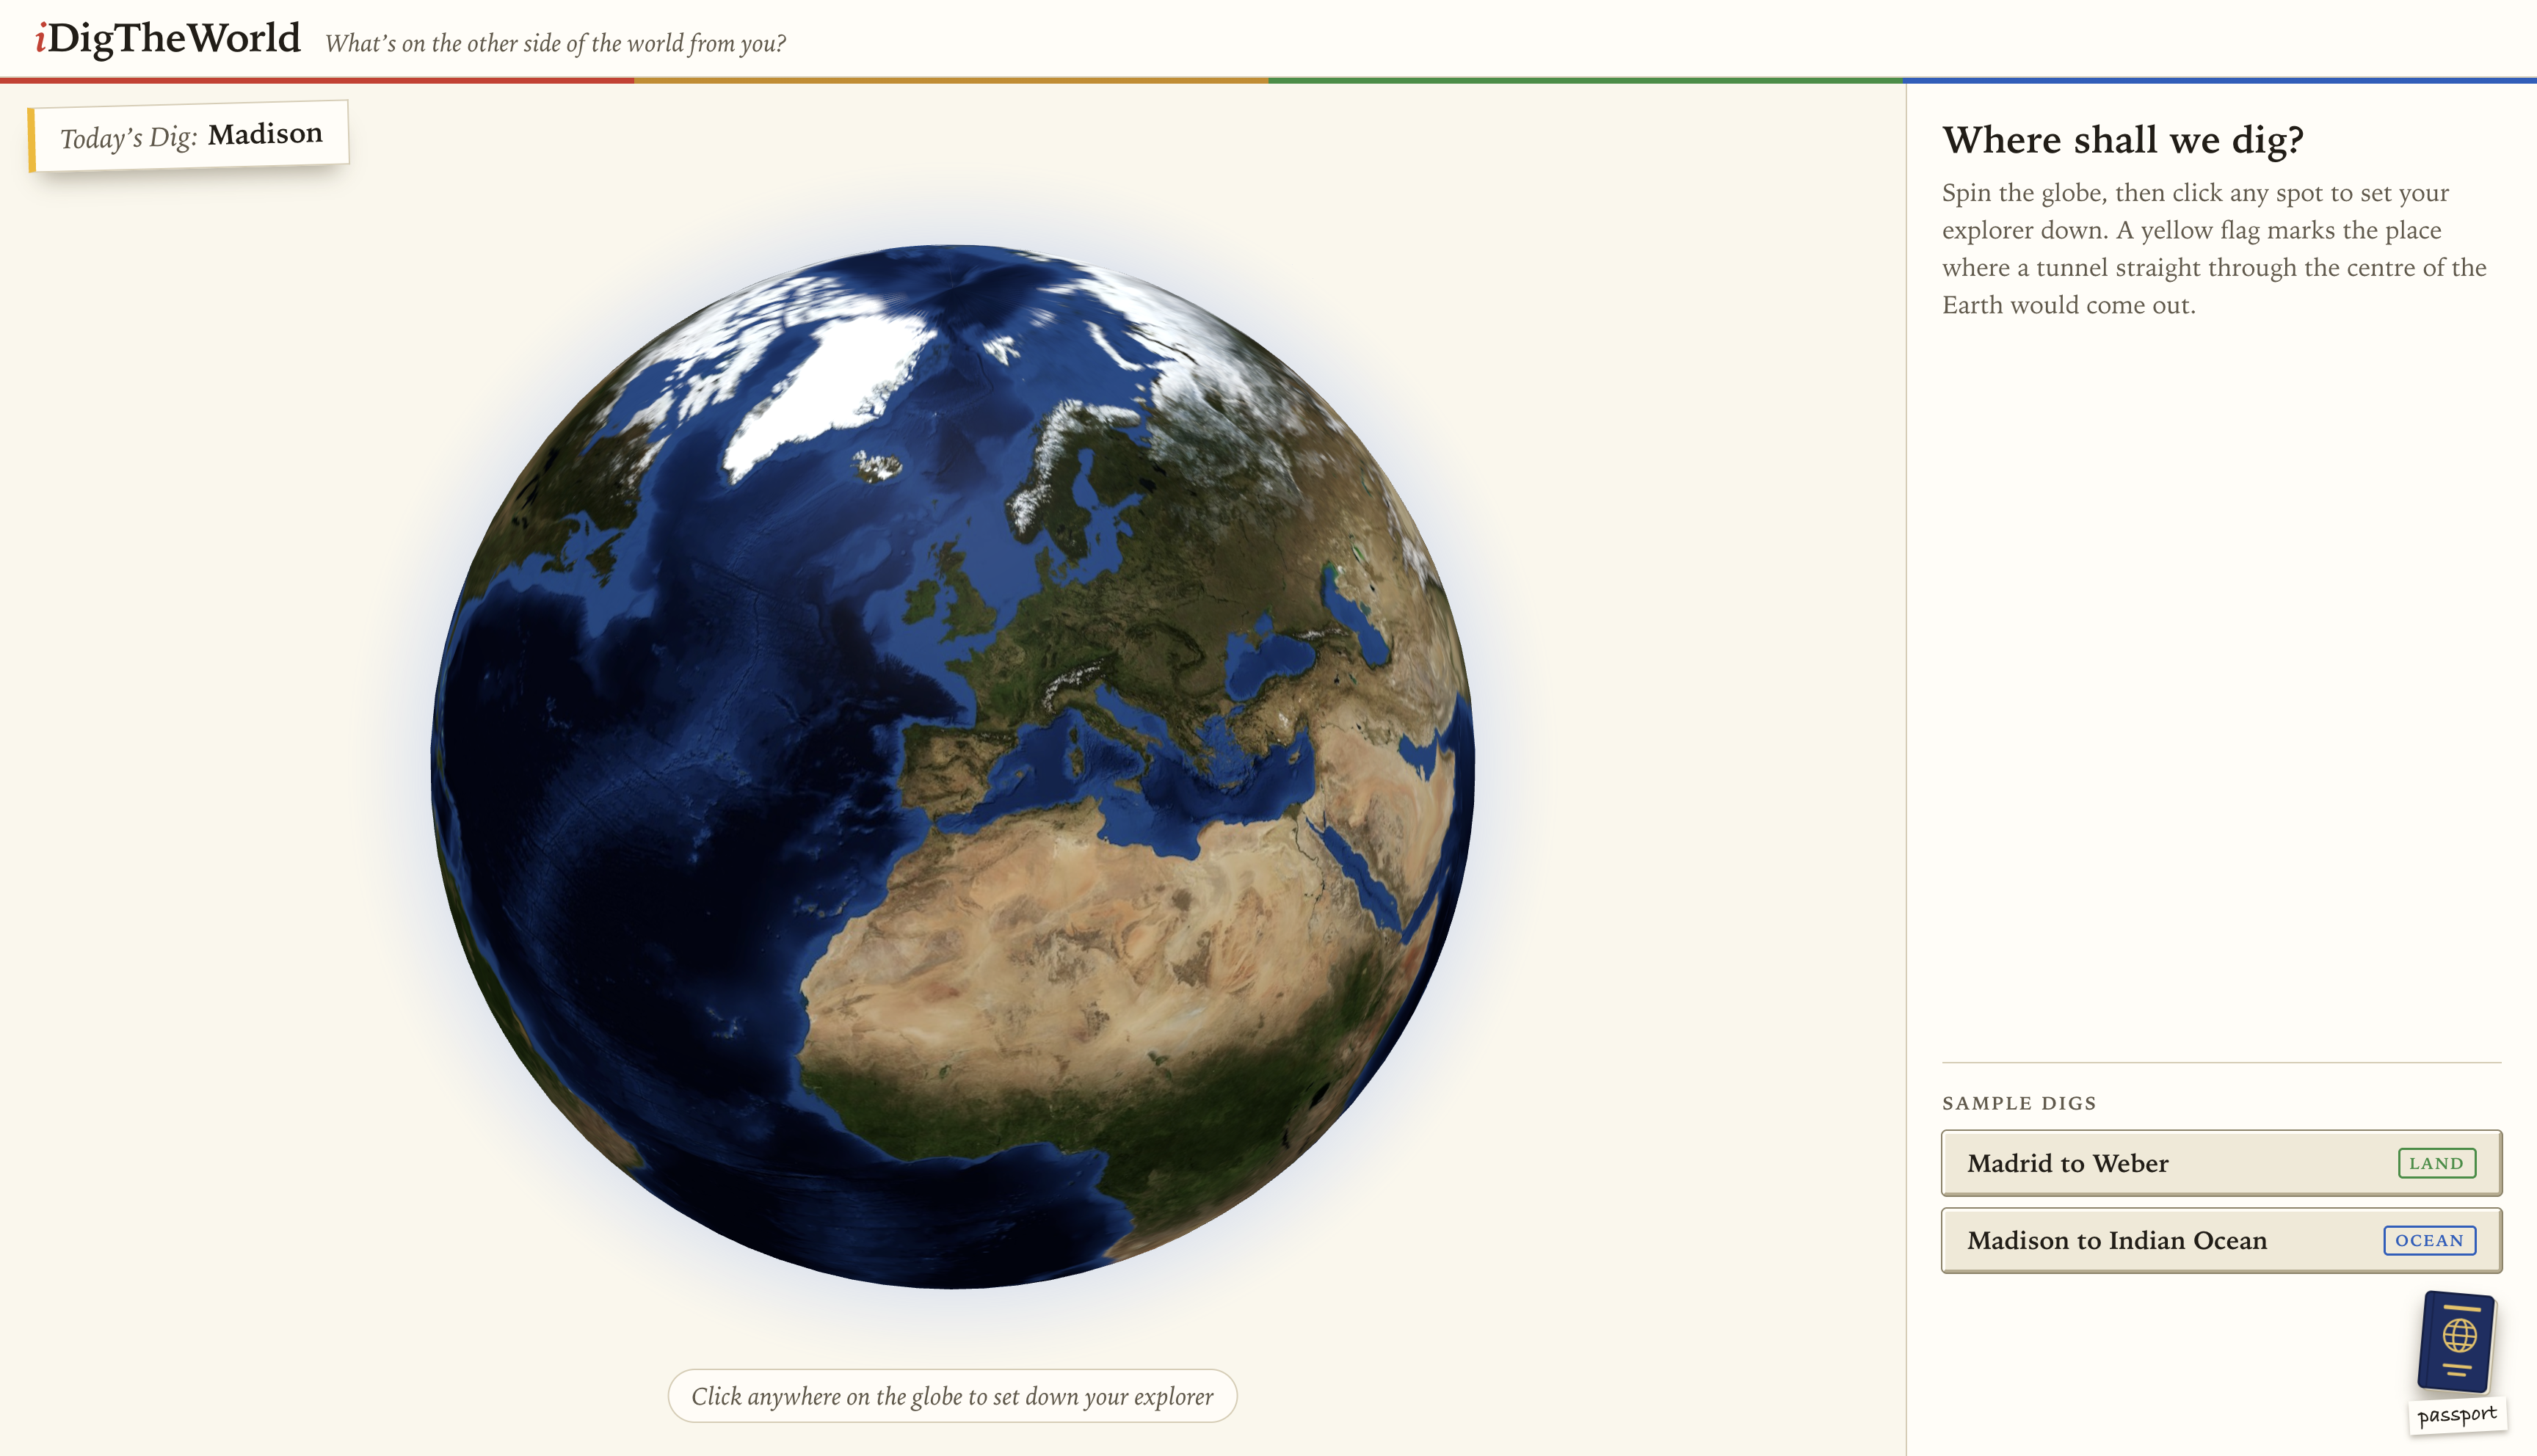
iDigTheWorld starts with a 3D globe. Drop your explorer anywhere, learn about where you're standing, then flick down to tunnel through the crust, mantle and core, and surface at your exact antipode.
- Surface anywhere. You arrive to a full-screen photo of the place, with its name laid over it like an encyclopedia spread and a parchment scroll of field notes drawn from Wikipedia.
- Swim to shore. Most antipodes are open ocean, so we name the sea you came up in and help you swim to the nearest coastline.
- Keep digging in. Cut-out objects on the page open AI-written cards about the place's cuisine, culture, history and wildlife, and each card offers new sub-topics to dig into.
- Hidden sticker. To celebrate MadHacks, we've hidden a collectible sticker somewhere on the globe. Find the right spot, dig, and it's yours, along with everything there is to learn about where it was hiding.
How we built it
- Front end: React, TypeScript and Vite, with
react-globe.gl(three.js) for the globe. The look is modelled on 1990s illustrated encyclopedias. - AI: Llama 4 Maverick through the Databricks Foundation Model API. Every card is written from Wikipedia text about its own subject and returned as validated JSON, and the app falls back to the encyclopedia entry if the model fails.
- Data: OpenStreetMap Nominatim for place names, Wikipedia and Wikimedia Commons for text and credited photos, and bundled Natural Earth data for naming oceans and finding coastlines.
- Hosting: a small dependency-free Node server on Databricks Apps, deployed from GitHub.
Challenges we ran into
- Databricks deployment. Free Edition limits weren't fully documented: premium models were capped, outbound internet from the server was restricted, and apps stop after 24 hours. We added a health-check endpoint to test what the server could reach, and moved most data fetching into the browser.
- Getting reliable output from the model. Llama needed careful prompting to return clean JSON and to stay grounded in real facts instead of inventing them. We added validation, retries, and grounding in Wikipedia text for every card.
- Images that match the place. Searching for photos by coordinates often returned unrelated or low-quality images, especially for remote spots and open ocean. We built a fallback chain from nearby Commons photos to the place's Wikipedia image to bundled regional photos, and every photo is credited with its licence.
- The ocean problem. Reverse geocoders return nothing for open water, so we had to detect seas ourselves and find the nearest coastline.
Accomplishments that we're proud of
- A visual identity that doesn't look like every other!!
What's next?
- Daily sticker hunts and a leaderboard. New stickers hidden around the world every day, with a leaderboard of explorers, so people come back daily to find them and learn something new each time.
Built With
- databricks
- node.js
- nominatim
- react
- three.js
- typescript
- vite


