-
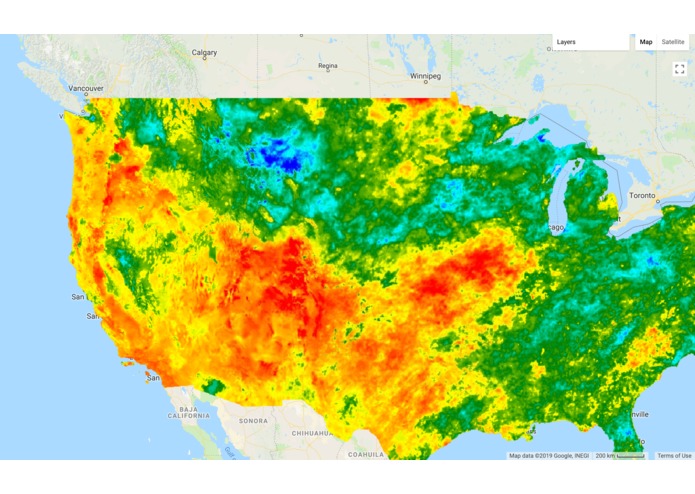
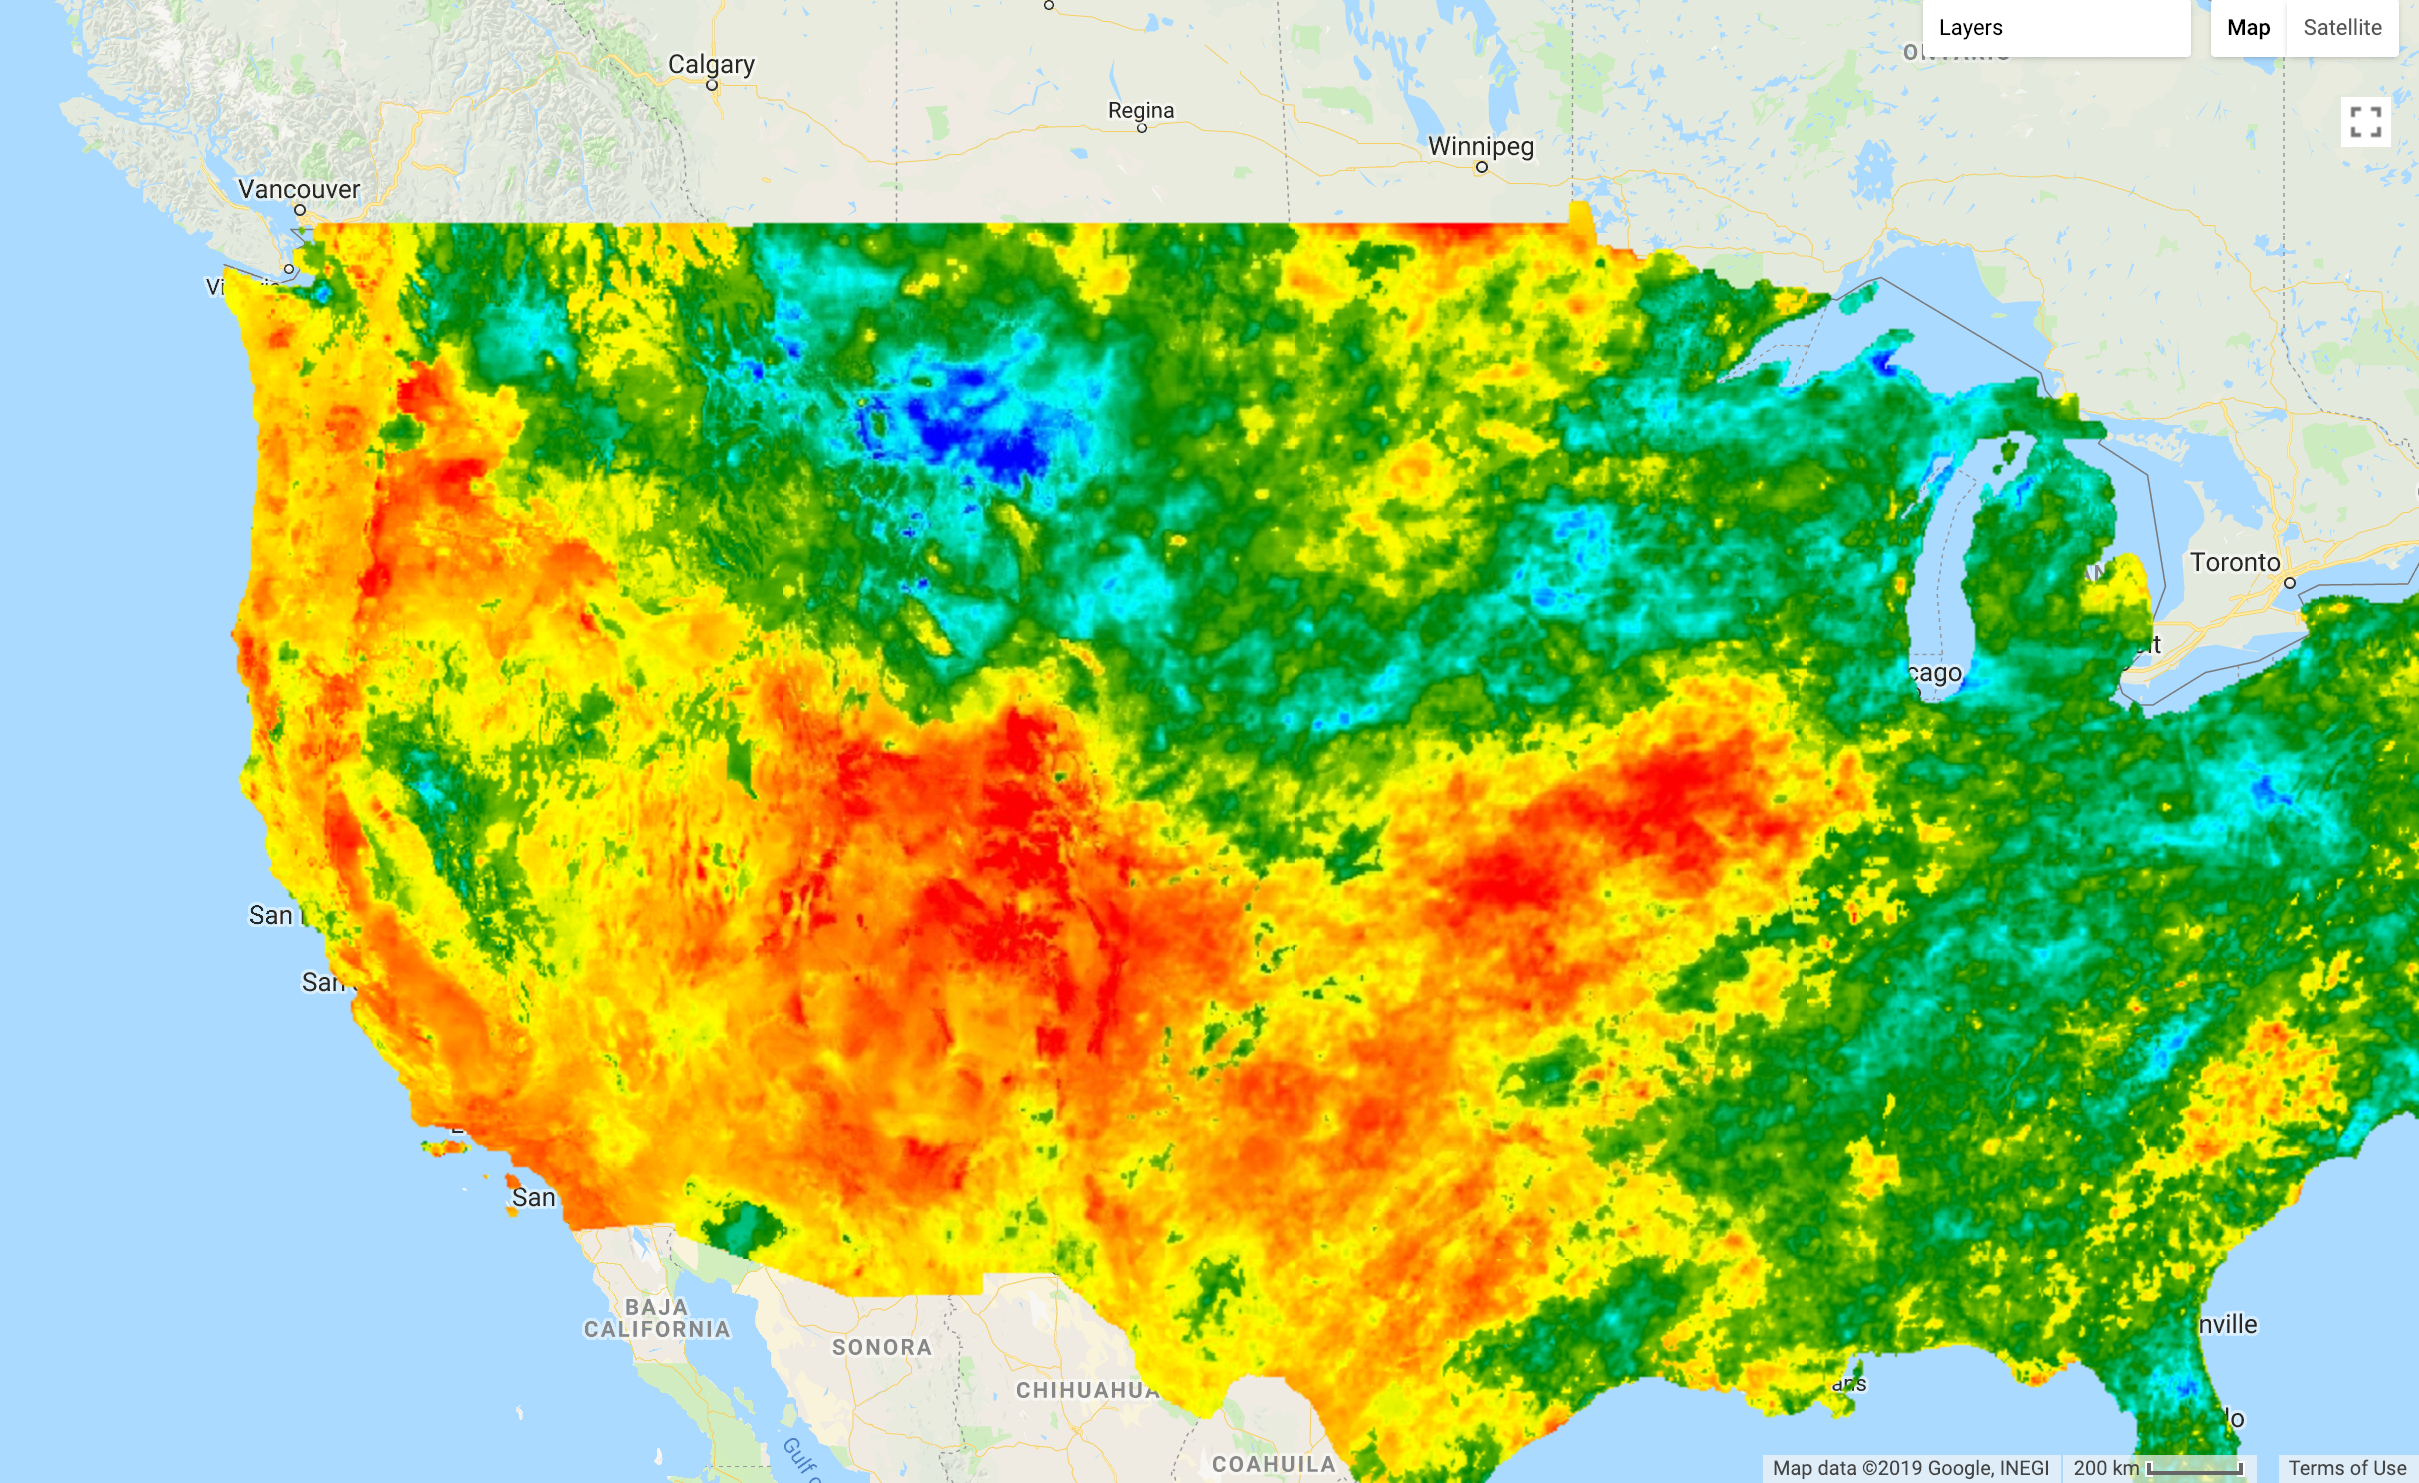
Temperature Heat Map in the US (Google Earth Engine API, accessed 27/01/2018)
-
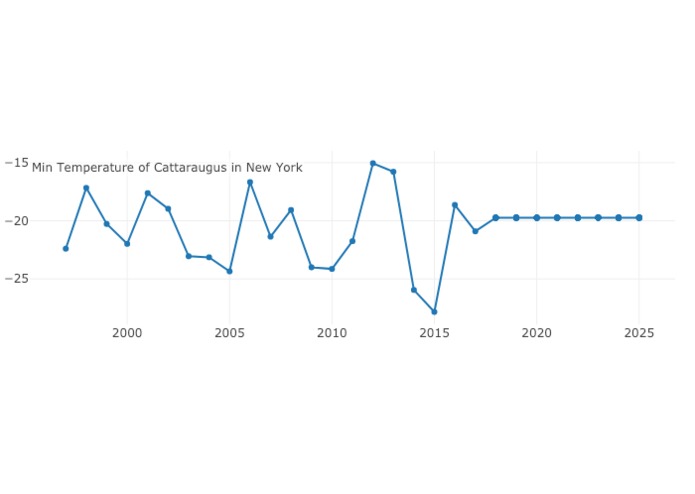
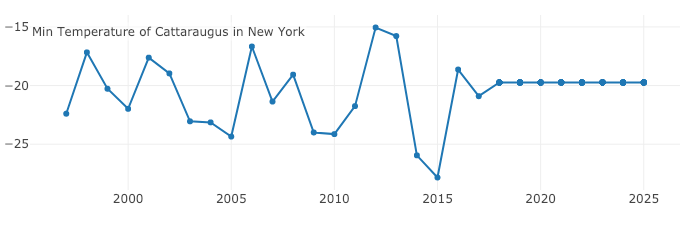
Temporal interactive graph in action! Visit our site to try it out youself :)
-
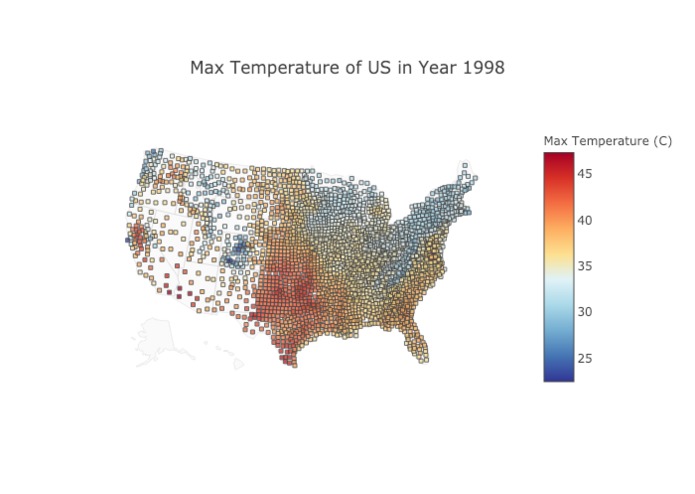
Spatial interactive graph in action! Visit our site to try it out youself :)
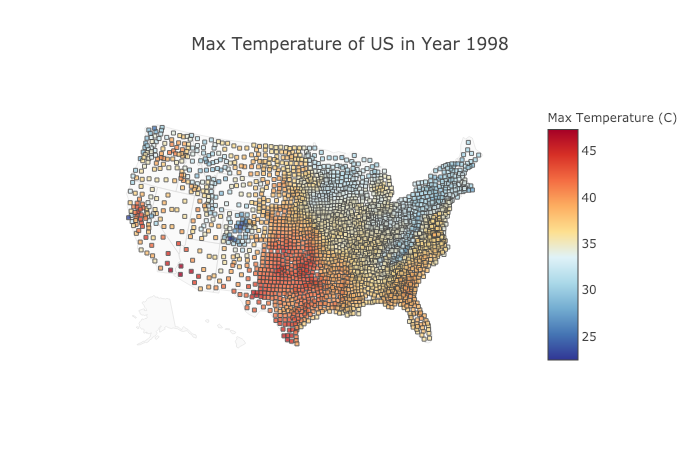
Web Application: http://ichack.tmikey.tech/
Introduction
Our Aim
To use statistics and software engineering to understand climate change and its impacts on our world. We look at extreme distributions of maximum and minimum temperatures, and maximum precipitation across the whole of the US. This has important applications to disaster prevention, agricultural modelling and climate change research.
Allow the public to know more how climate change affects their lives.
Enable researches to present their results in an easy way
Scientific Platform
- Flexible and scalable statistical machine learning models: Autoregressive time series models, Bayesian Additive Regression Trees (BART) and geostatistical Gaussian processes providing temporal, spatial and spatiotemporal (!) predictions
Computational Platform
The model training was done on a
384 GB AWS EC2server over 30 years of dataThe "Maths NextGen Compute Cluster" provided by the Department of Mathematics, Imperial College London. "HPC (High-Performance Compute) cluster of 34 Linux computer servers providing 340 processors plus additional servers for test & development purposes ... of short or lengthy computation jobs, either singly or in parallel."
Time series modelling: We embraced the concept of
parallel programmingto build an ARIMA(p,d,q) model at all the spatial knots individually. This computation scaled the computation from half-an-hour to a couple of seconds.Spatial modelling: Since the computational complexity of BART is almost O(n), we easily fit the whole spatial domain in 1 model using Markov chain Monte Carlo and do inference using Monte Carlo integration.
Spatiotemporal modelling: We used computationally intensive inference techniques via Gaussian processes, and these were run on the
EC2and theMaths NextGen Compute Cluster. In Statistics, this is known as kriging.
Application Platform
- Webpage hosted on another
EC2instance, together withMongoDB. The same server hasRStudio serverrunning to enable rapid prototyping.
Data Platform:
- Latest satellite imagery and data scraped from
Google Earth EnginePython API. Exploratory data analysis completed in Google Earth Engine the Javascript platform.
Discussion
Due to time constraints, we were not able to tune our advanced models and so if given more time, we would have focused more on this
Naturally if we draw from an unknown distribution F and look at the distribution of maximas and minimas, then by Fisher, Tippett & Gdnenko theorem this follows a generalised extreme value distribution. Furthermore, one can also look at max-stable processes.
Interface
Easy to use web application for interactive display of time series and spatial distribution of climate data based on
FlaskandPlotlySome data could be missing because it is not provided by the data source and the models we build can perform predictions to fill in the missing data
Further Applications
- The tool is a framework for scientific research and publications since the tools used are lightweight and flexible.

Log in or sign up for Devpost to join the conversation.