-
-
Logo
-
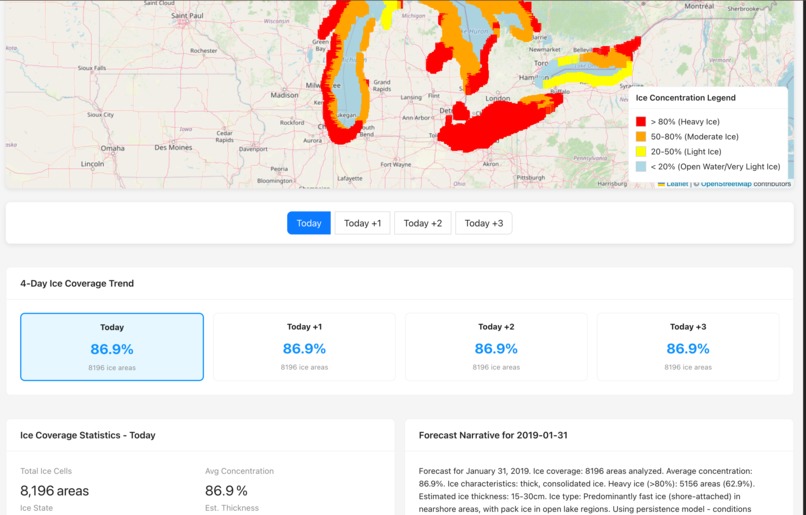
Map
-

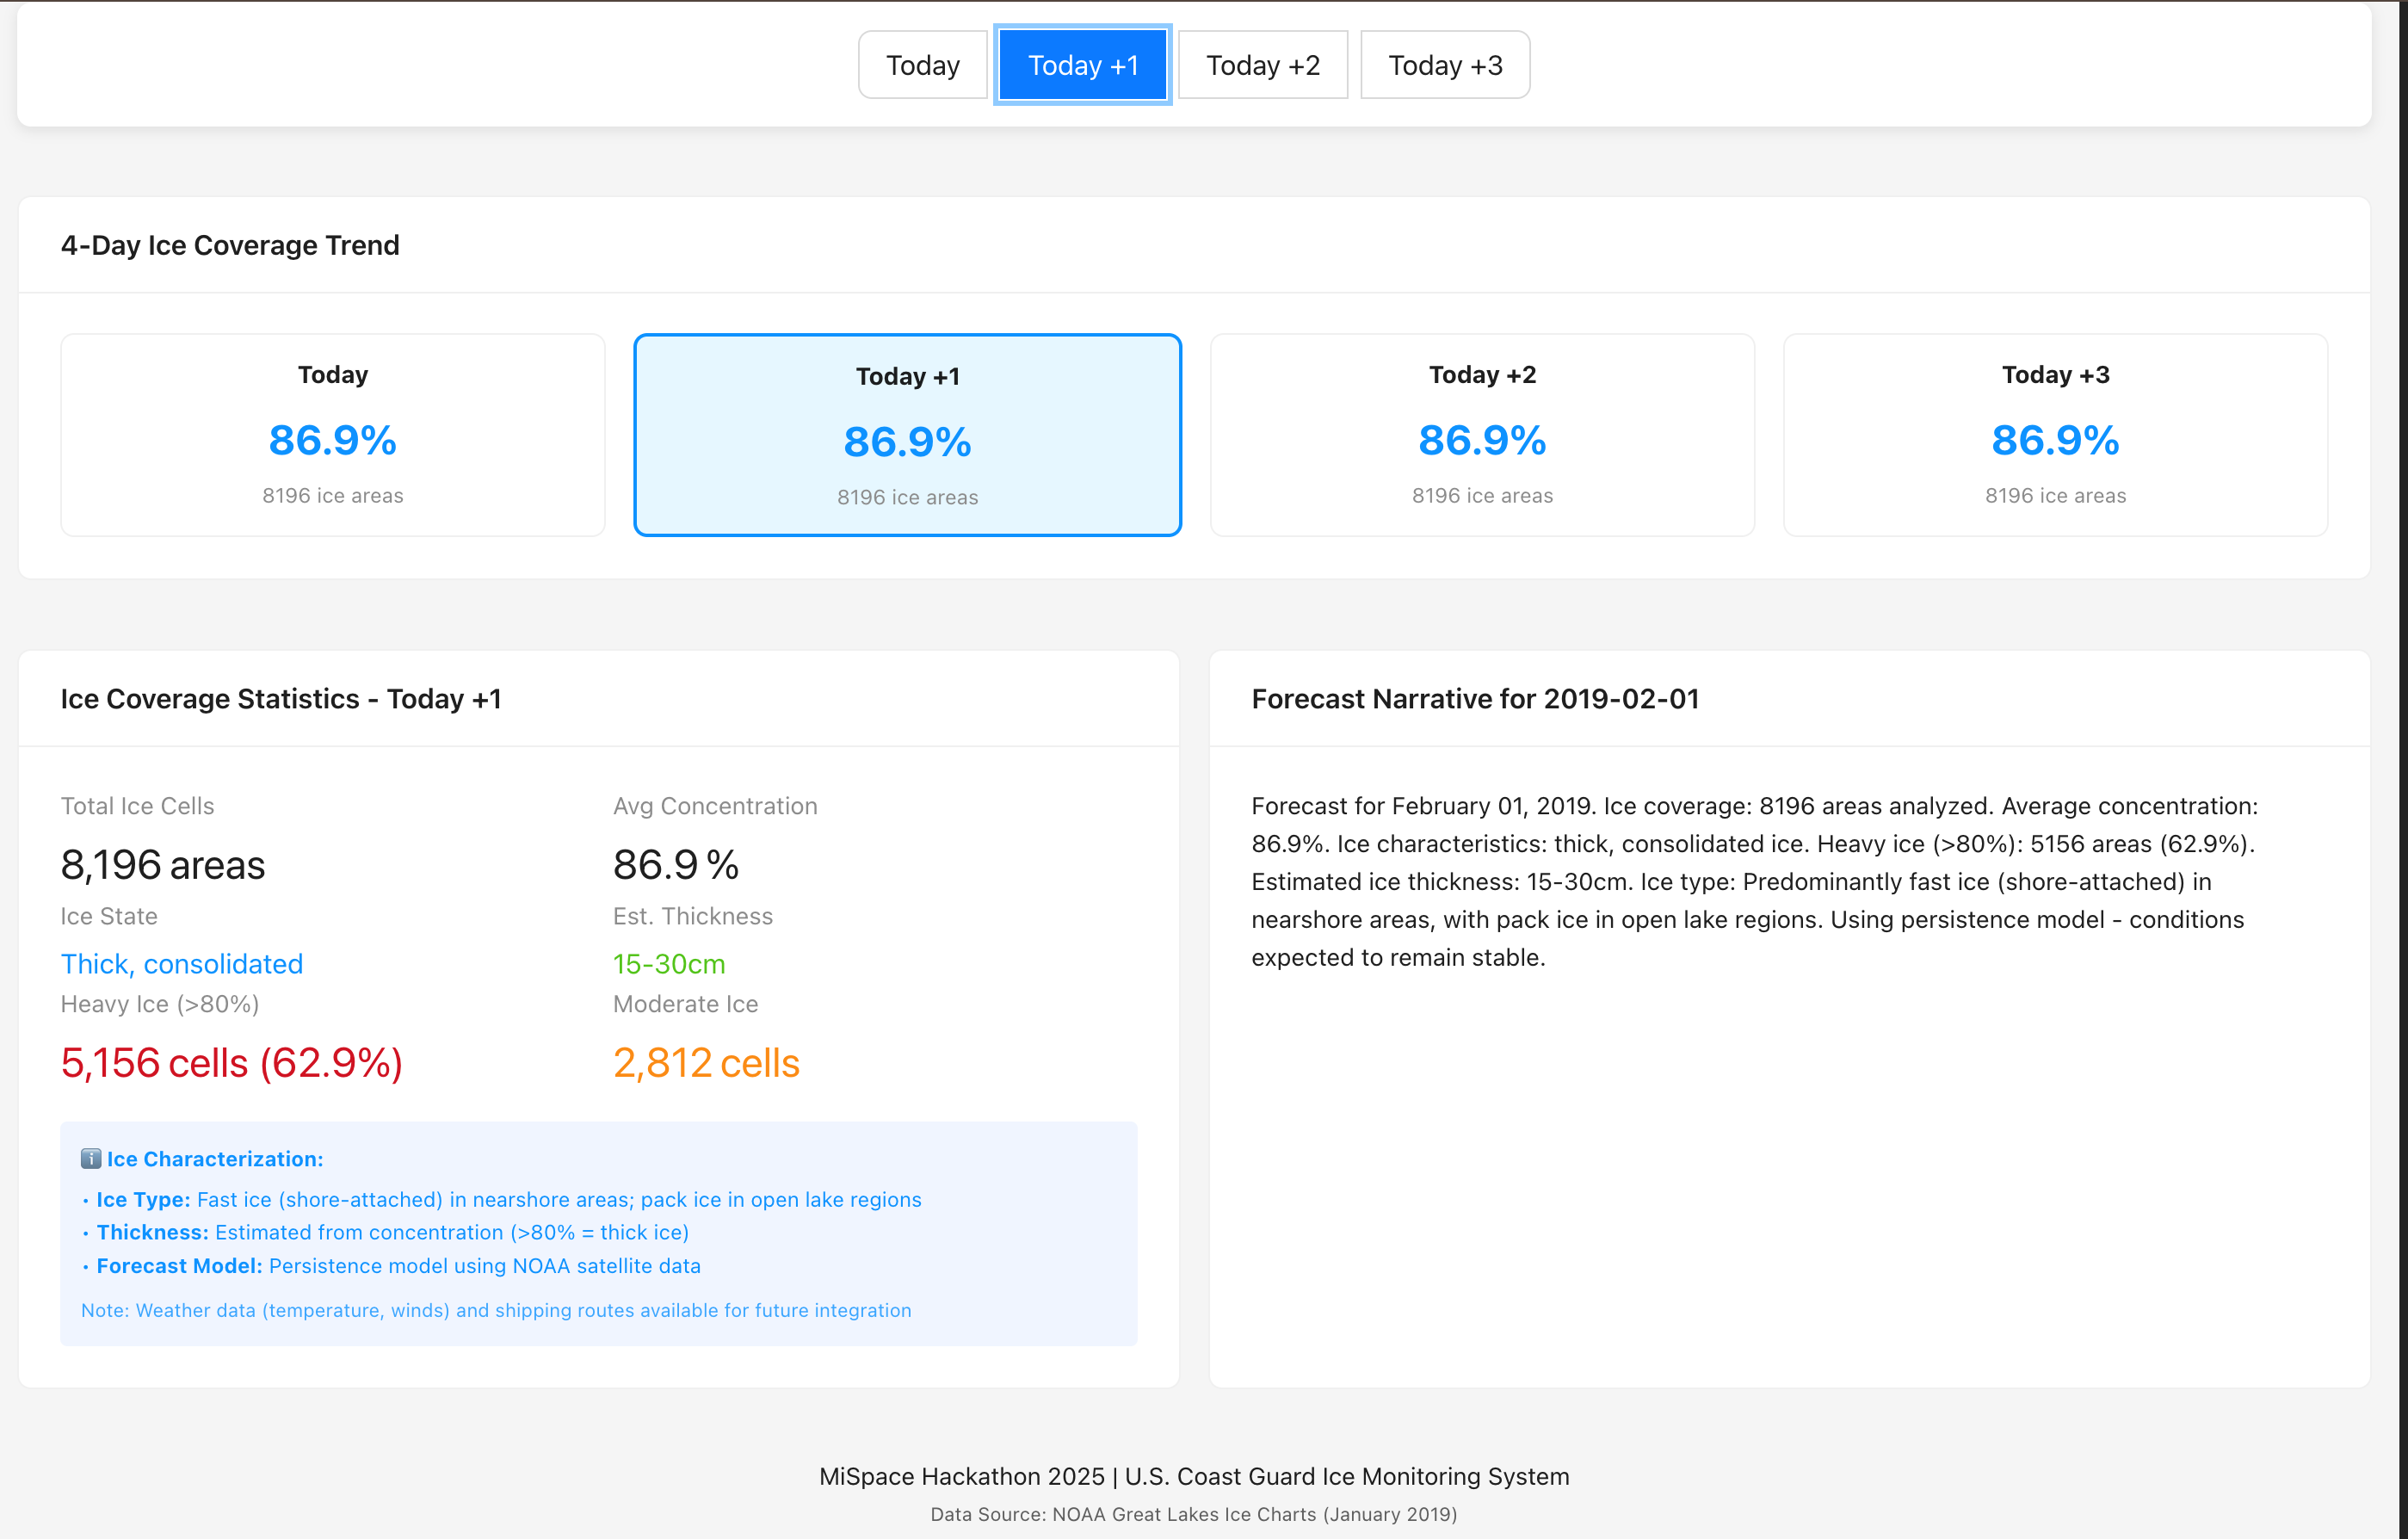
Control

Inspiration
The U.S. Coast Guard still relies on fragmented reports and outdated maps to plan ice-breaking missions across the Great Lakes. Our team wanted to give crews—and anyone coordinating shipping or emergency response—a single, trustworthy dashboard that shows where ice is thick today and how it will evolve over the next few days.
What it does
The Great Lakes Ice Monitoring System ingests NOAA ice concentration data, converts 82,000 measurement points into 8,196 grid cells, and exposes a fast React+Leaflet map. Users can hover any cell to see precise ice coverage, step through four forecast days, and read an auto-generated narrative that summarizes changing conditions.
How we built it
- Data pipeline (Python): a persistence-model forecaster built on
process_data.pyautomatically fetches the latest NOAA shapefiles, samples 10×, converts points to polygons, and outputsfrontend/public/forecast.json(<15 MB). - Frontend (React 19 + Vite + Ant Design + Leaflet): renders the geo-grid, color-codes concentration bands, shows tooltips, legend, and forecast narrative with day selector.
- Deployment: optimized build (717 KB bundle) and published via Vercel (
https://frontend-ofdgg1w73-hles-projects.vercel.app).
Challenges we ran into
- Data volume: raw shapefiles were ~181 MB; required aggressive sampling and polygon aggregation to stay under 15 MB without losing coastal detail.
- Temporal coverage: NOAA data is daily, so we implemented a lightweight persistence forecaster and validation hooks to keep four-day projections consistent.
- Leaflet performance: rendering thousands of polygons needed memoized GeoJSON layers and simplified styling to keep interaction buttery smooth.
Accomplishments that we're proud of
- Fully automated pipeline from NOAA ingest → cleaned GeoJSON → deploy-ready frontend in under an hour.
- Interactive map with sub-second hover feedback despite heavy geo data.
- Clear documentation suite (README, deployment guide, submission checklist) so anyone can reproduce the system.
What we learned
- Persistence models, when paired with solid visualization, deliver immediate operational value even without complex ML.
- Vite’s rolldown build chain plus Ant Design can handle large geospatial UIs with minimal tuning.
- Careful preprocessing (sampling + grid conversion) is the difference between a 181 MB anchor and a 15 MB deployable asset.
What's next for Ice Monitoring
- Integrate daily satellite refresh + anomaly alerts for Coast Guard command centers.
- Add ML-based short-term forecasting that blends wind, temperature, and historical melt rates.
- Release a public API and embed the dashboard in existing maritime planning tools.


Log in or sign up for Devpost to join the conversation.