Inspiration
Football media treats "clutch" as folklore: a highlight reel of game-winning drives, or at best a single aggregate stat with no denominator, no baseline, and no accounting for sample size. Nobody had ever shown us the number that would let a coach, a scout, or a fan actually check whether a specific quarterback's performance rises, holds, or degrades as leverage increases, and how much of that is real versus noise. The gap wasn't a lack of data. nflverse's public play-by-play has everything needed. The gap was that no one had built the honest version of the metric.
What it does
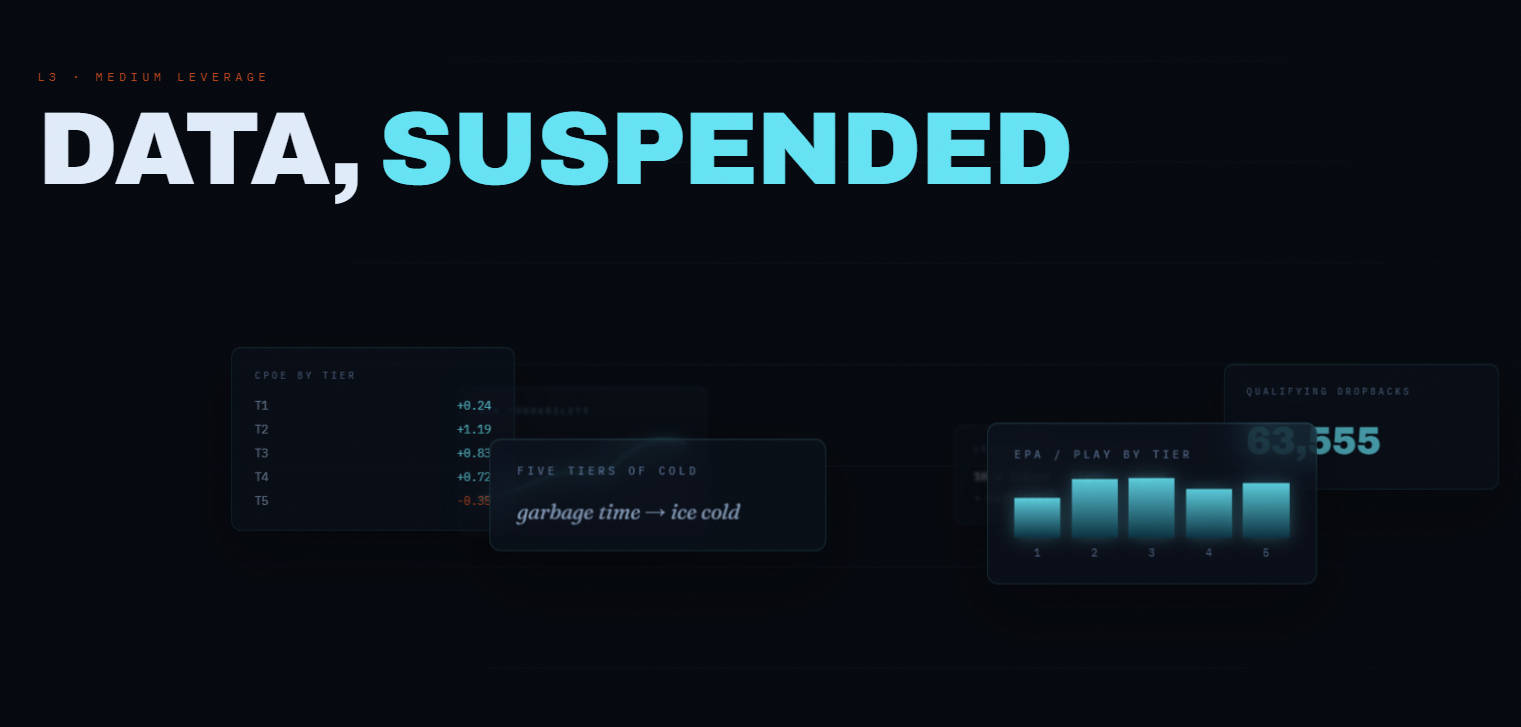
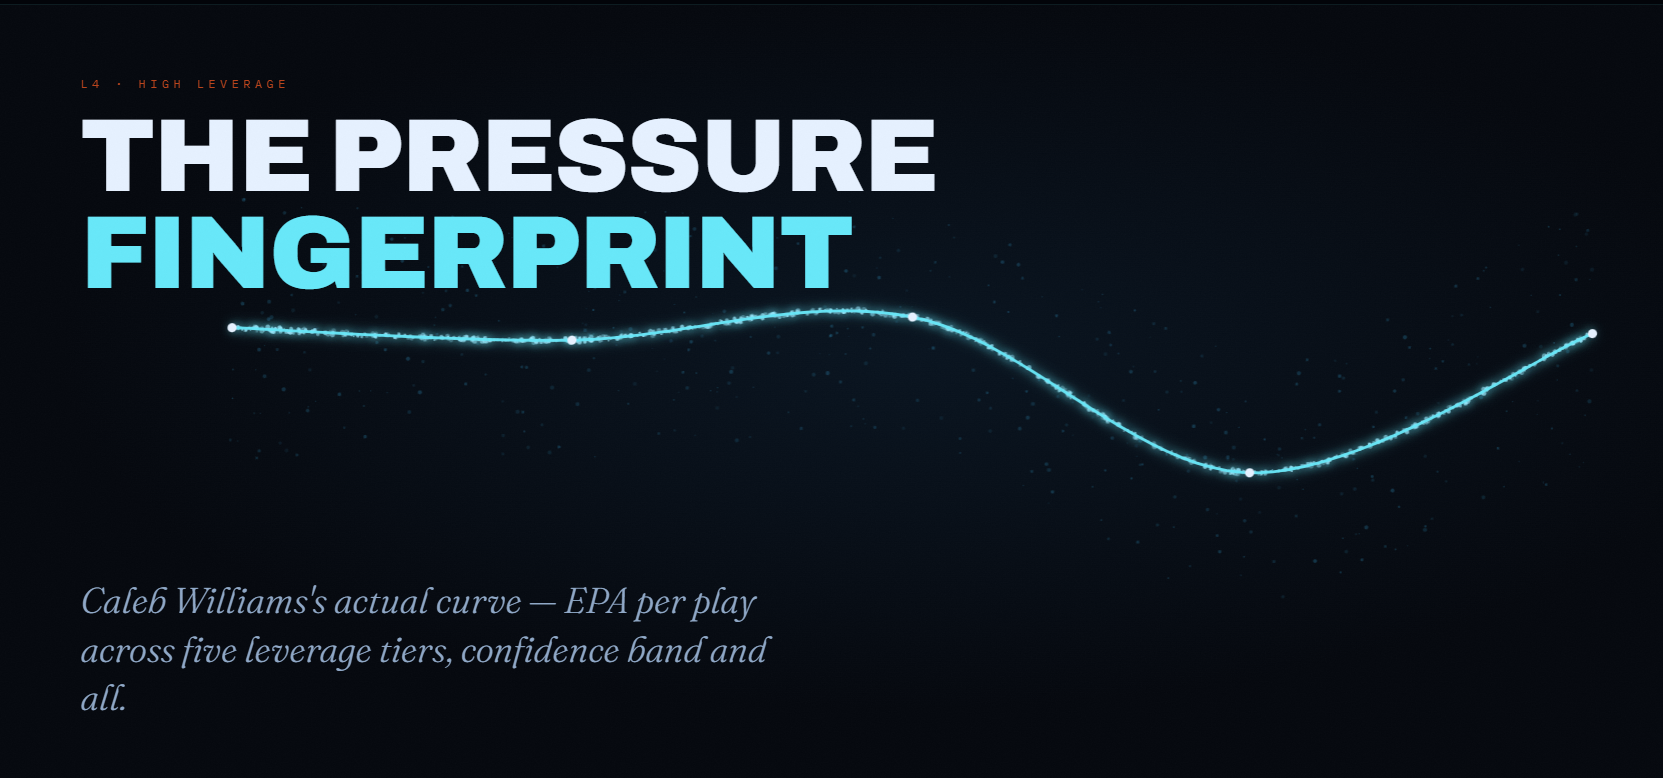
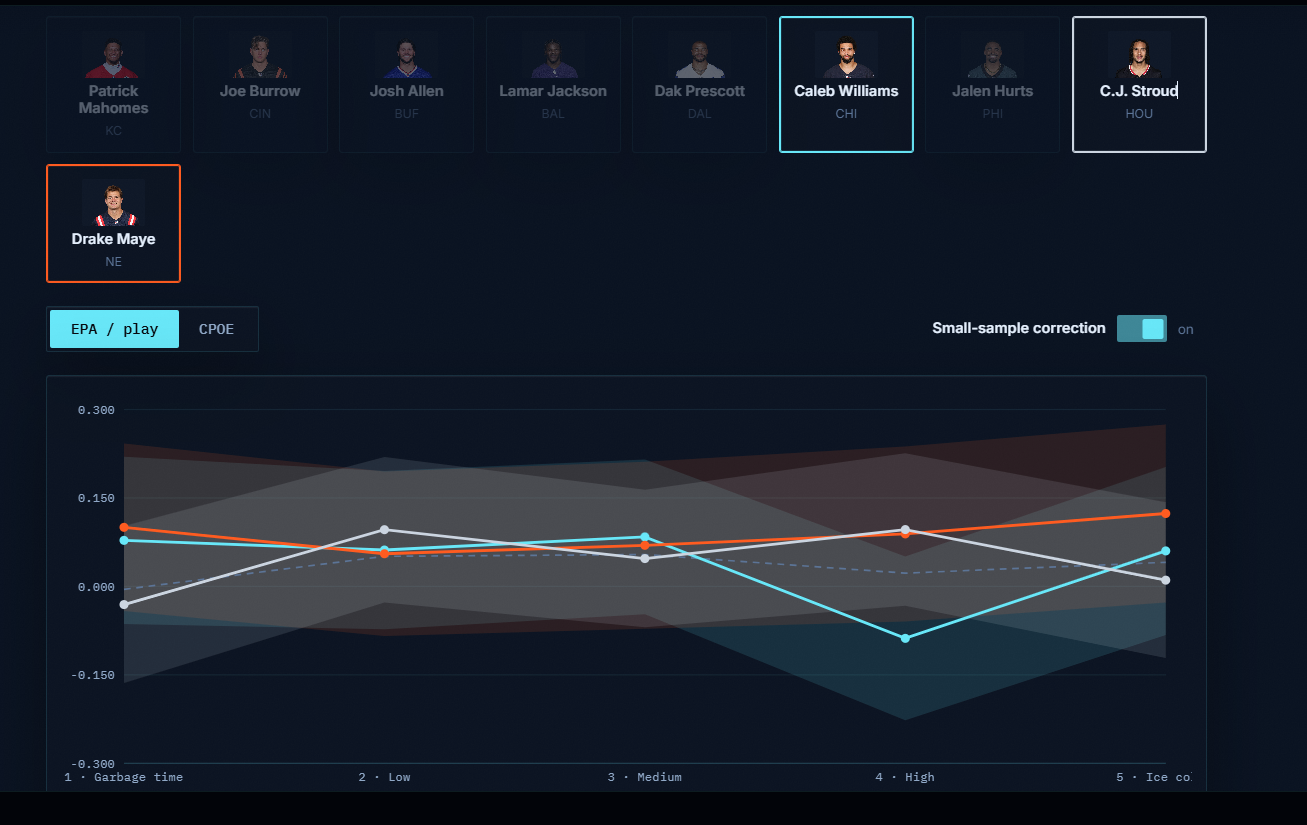
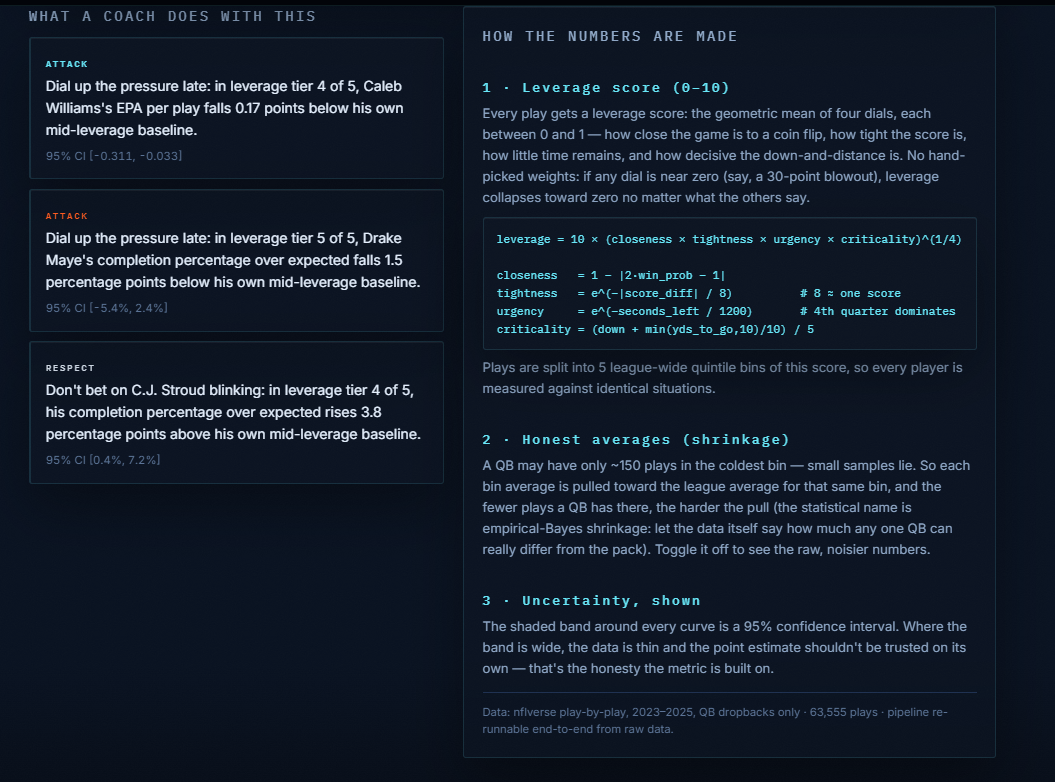
Ice in His Veins computes a Pressure Fingerprint for nine marquee NFL quarterbacks: a curve of EPA/play and CPOE across five leverage tiers, from "garbage time" to "ice cold." Every curve carries a 95% confidence band, and low-sample bins are corrected toward the league average via empirical-Bayes shrinkage, with a live toggle to compare the raw, noisier numbers against the honest ones.
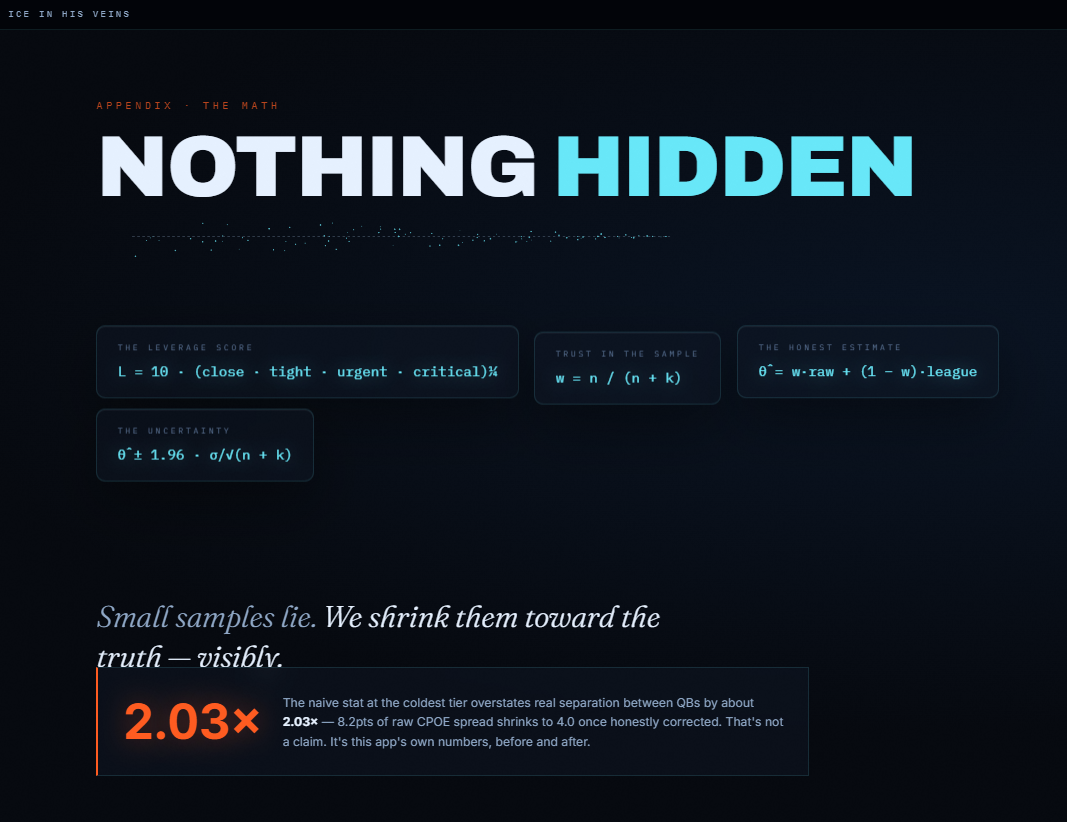
The product proves its own thesis with a real number. At the coldest leverage tier, the naive stat a traditional "clutch" ranking would use overstates true separation between QBs by ~2.0×, computed from the app's own committed data rather than simply asserted.
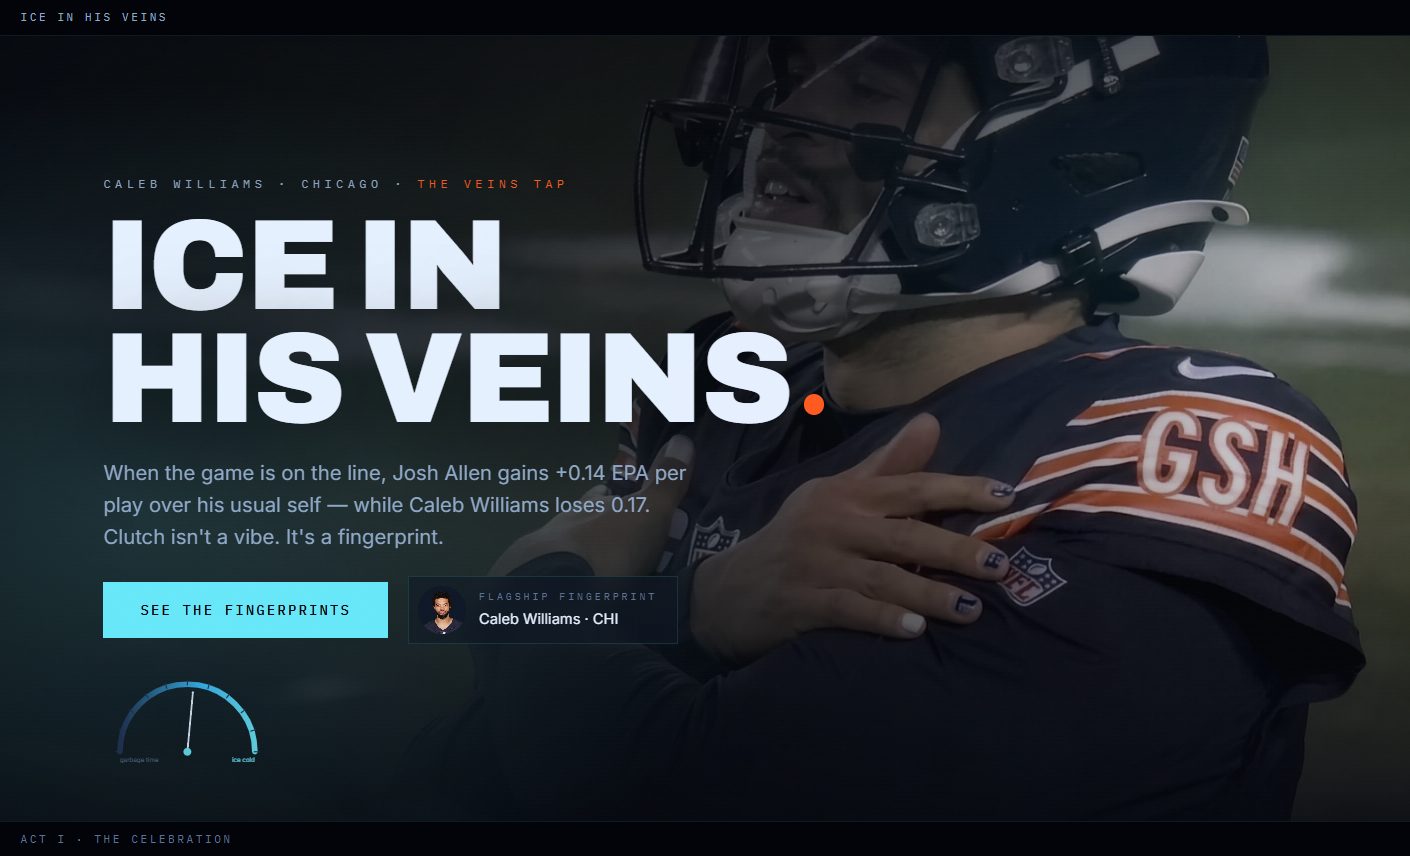
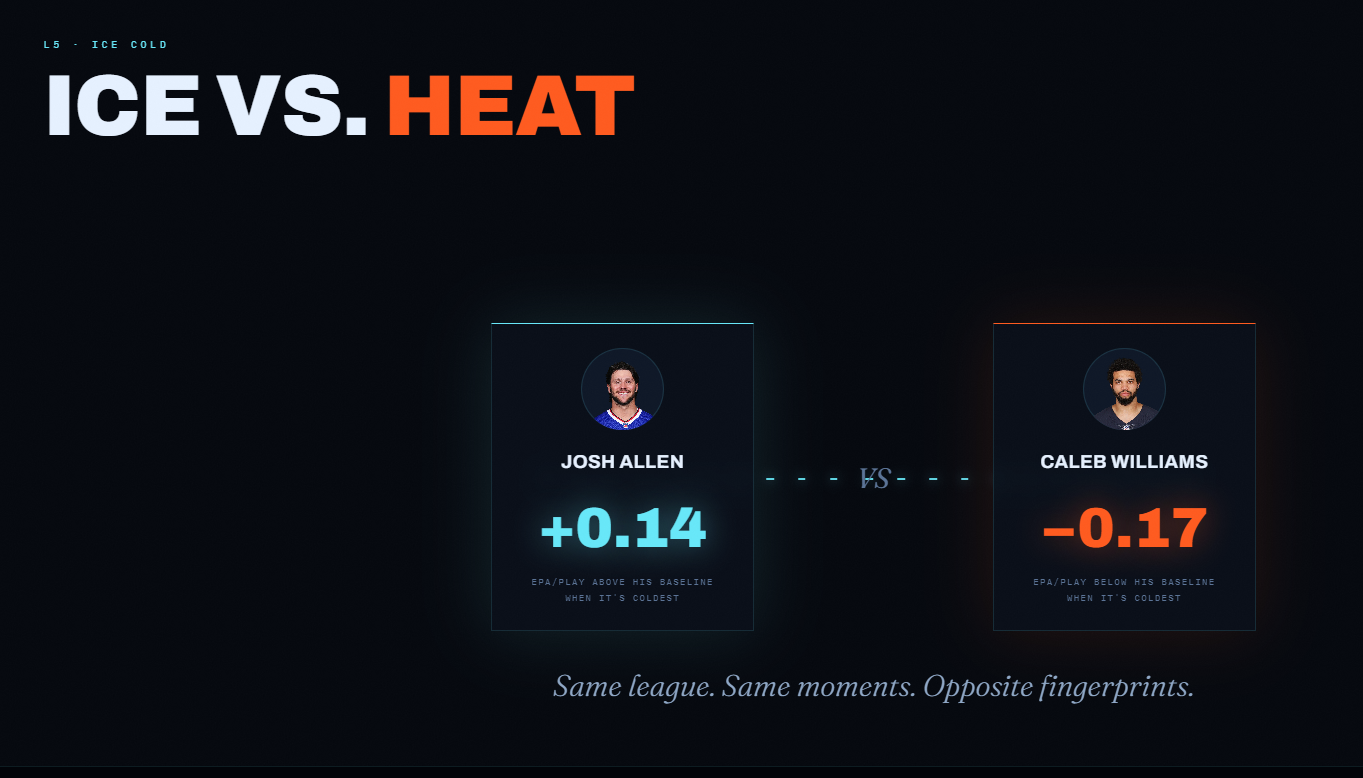
A judge lands on a cinematic, broadcast-framed scroll experience: Caleb Williams's real "ice in his veins" celebration as the hero, a live leverage HUD that climbs as you scroll, and the full interactive dashboard with player comparison, metric and shrinkage toggles, and auto-generated coaching insight sentences with their own confidence intervals sitting at the center of the film instead of being bolted on afterward.
How we built it
Pipeline (Python): ingest nflverse play-by-play, compute a leverage score as the geometric mean of four 0 to 1 factors with no hand-picked weights, bin into five league-wide quantiles, apply empirical-Bayes shrinkage with prior strength estimated from the data itself, auto-generate one actionable rule-based insight sentence per QB, and export validated, schema-checked JSON. Zero live backend. The deployed app is 100% static.
Frontend (React + Vite): a single continuous scroll film built on Lenis smooth scroll and GSAP ScrollTrigger, with seven pinned cinematic acts wrapping an untouched, fully interactive analytics dashboard using Recharts. The dashboard is lazy-loaded to keep the initial bundle under 360 KB.
Deployment: Vercel, static output, with /data committed to the repo so
the live app has zero external runtime dependency.
Challenges we ran into
GSAP ScrollTrigger pin desync. Lazy-loading the dashboard chunk to cut bundle size meant every pinned section after it baked in a scroll position computed before the dashboard's much taller content had mounted. Scrolling through later acts would stall or skip. We fixed this with a one-shot, scroll-position-aware refresh instead of a naive resize listener, which introduced a second bug because refreshing mid-pin reset that section's progress before we landed on the final solution.
Proving the thesis, not just narrating it. The first pass of the film spent five acts asserting that "clutch is mostly noise" without ever showing a number. We went back into the pipeline and computed the actual raw versus shrunk spread compression across all nine QBs so the claim was backed by data already produced by the app.
Keeping the entrance honest. An early version staggered the entire hero, including the title, headline, and CTA, on page load. That caused overlap with the photo and clipping on wide but short browser windows. We reworked it into a pure photo-first load with a scroll-driven reveal.
Accomplishments we're proud of
A statistically defensible metric with an 8-test pytest suite validating the actual math, including leverage bounds, shrinkage weight properties, and confidence interval narrowing, rather than only output schema checks.
The empirical proof panel. The product backs its own headline claim with a reproducible number in
data/shrinkage_proof.json, regenerable by anyone throughpython pipeline/run_pipeline.py.A fully reproducible, one-command pipeline from raw public data to validated static JSON with zero manual steps.
Shipped a cinematic scroll experience without sacrificing a single original feature. The interactive dashboard remains 100% intact inside the experience.
What we learned
Uncertainty is more persuasive than confidence. The single most effective addition to this project wasn't a new visual. It was computing and displaying the 2× overstatement number, which turns "trust our shrinkage" from a claim into a fact that a judge can verify for themselves. We also learned the hard way that animation libraries and async data loading fight each other in scroll-pinned layouts unless you're deliberate about when you recalculate positions.
What's next
Next 2 weeks: opponent-strength adjustment. Right now leverage controls for game state but not defensive quality, which is the strongest legitimate criticism the metric does not yet address.
Next 3 months: extend Pressure Fingerprints to RBs, WRs, and TEs, and turn the offline batch pipeline into a weekly refreshed dataset during the season.
Long-term: build a defensive coordinator tool. "Blitz this QB above leverage tier 4" becomes more than a stat. It becomes a defensible in-game decision.

Log in or sign up for Devpost to join the conversation.