-
Ice Cream Data Visualization
About the Visualization
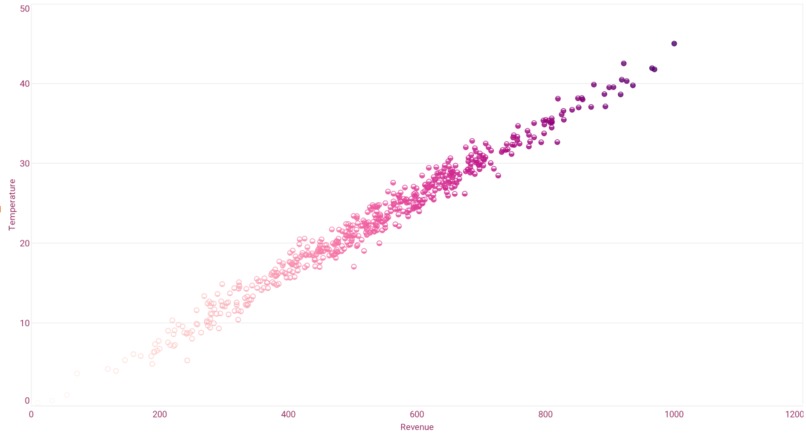
The temperature vs revenue scatter plot tells you the revenue generated by selling ice cream on the basis of the temperature on a particular day.
Built With
- visualize-free
On the basis of the temperature on any day, see how much revenue you are likely to generate.
Ice Cream Data Visualization
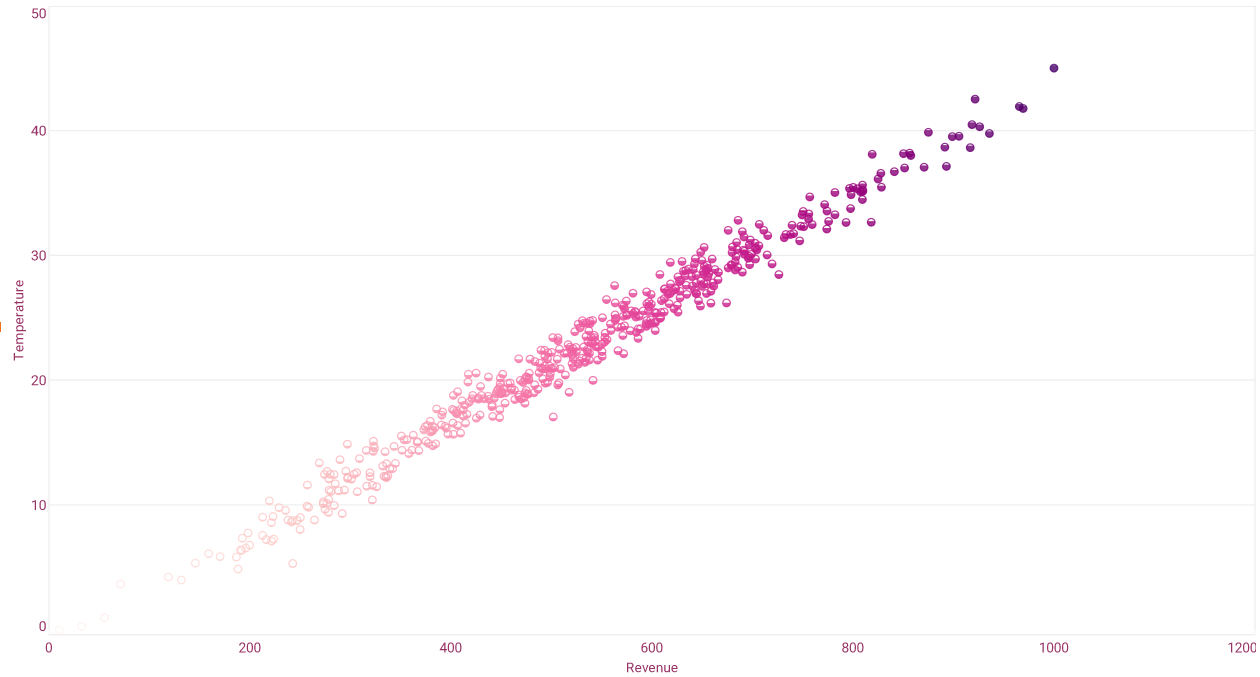
The temperature vs revenue scatter plot tells you the revenue generated by selling ice cream on the basis of the temperature on a particular day.

Leave feedback in the comments!
Log in or sign up for Devpost to join the conversation.