-
-
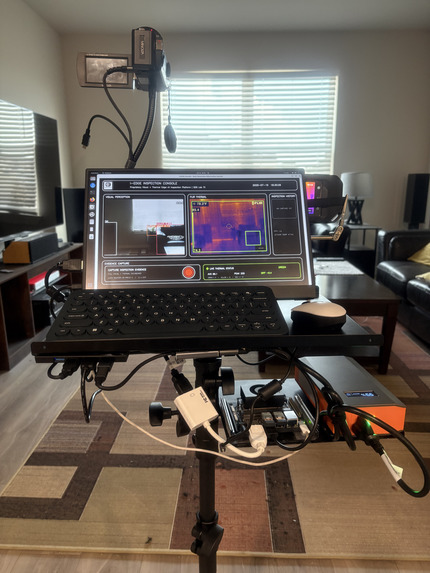
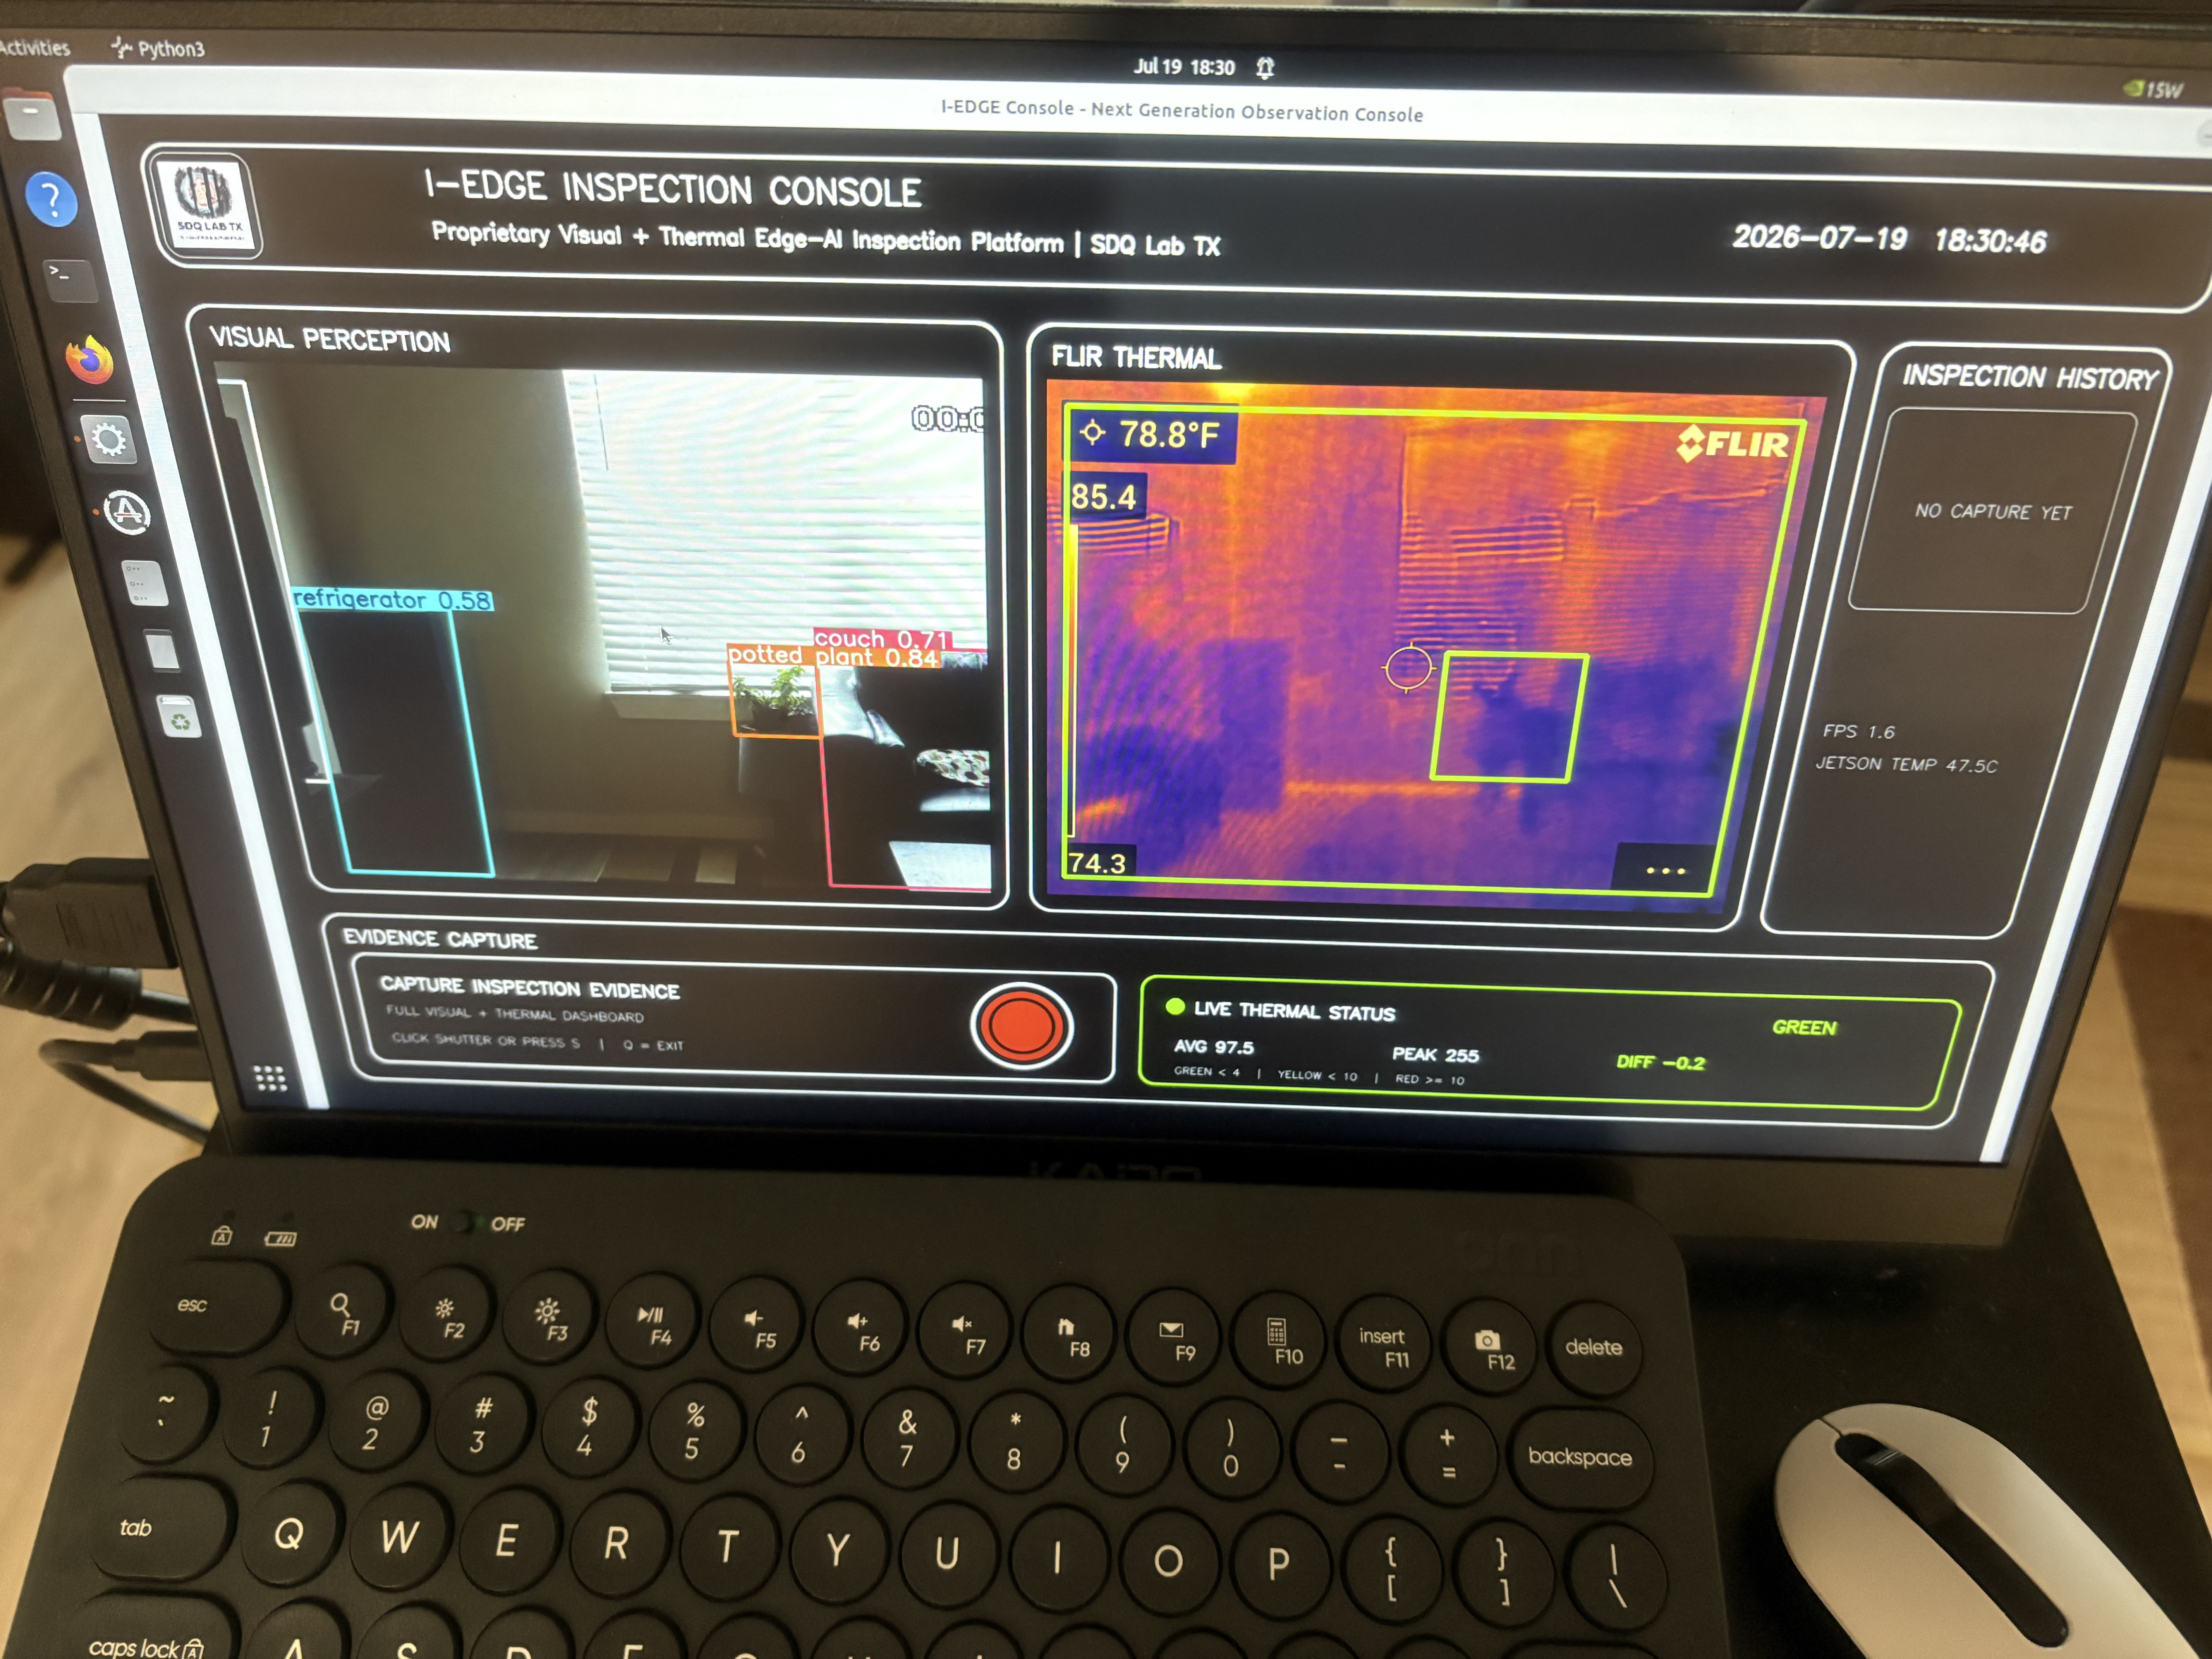
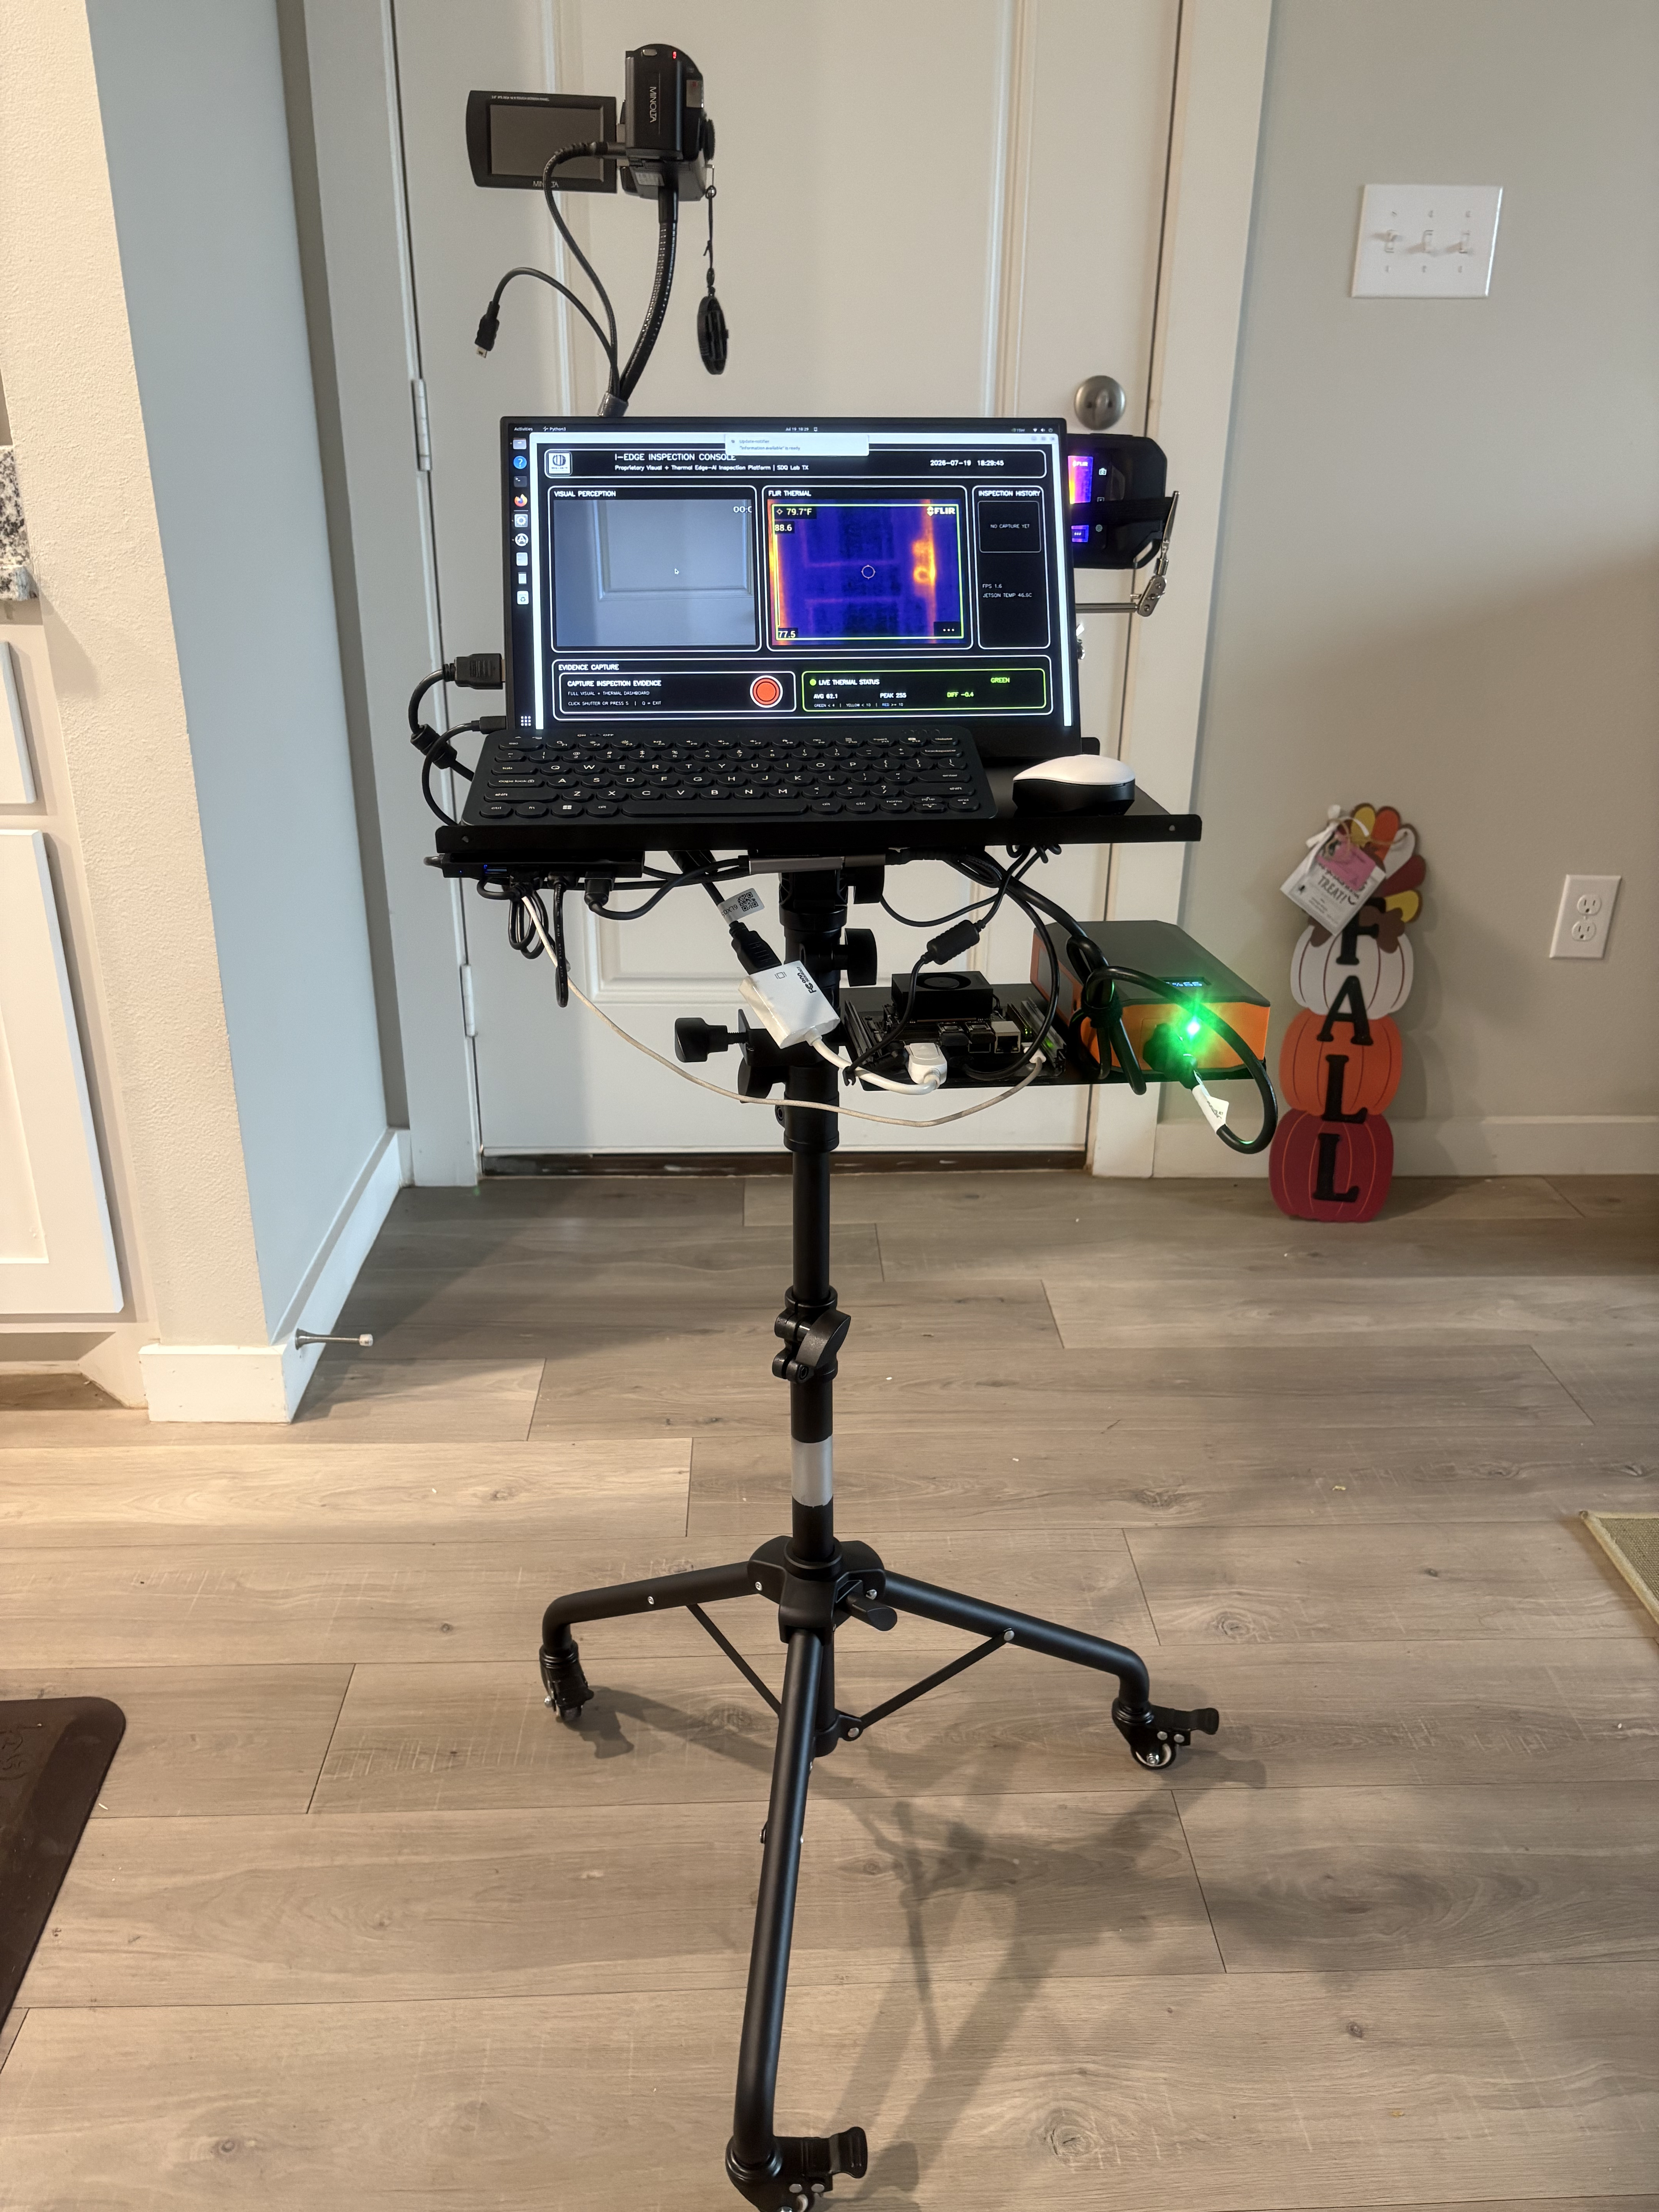
I-EDGE running live RGB and FLIR inspection on NVIDIA Jetson hardware.
-
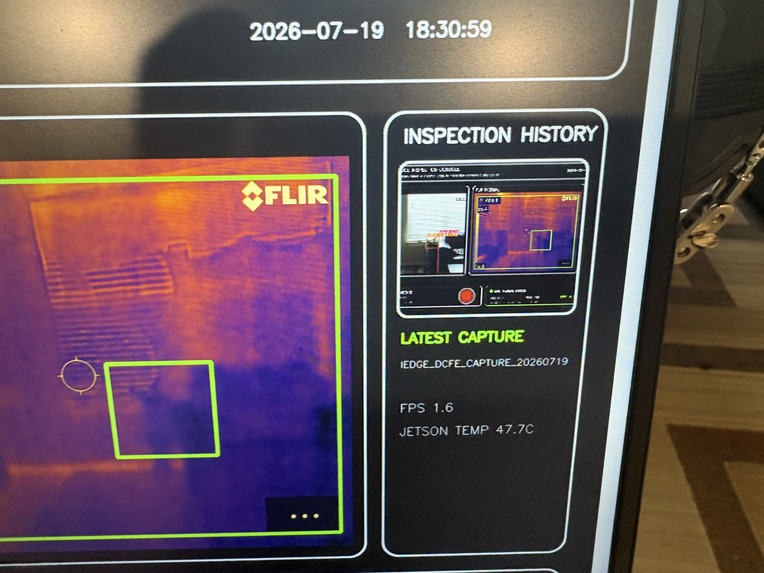
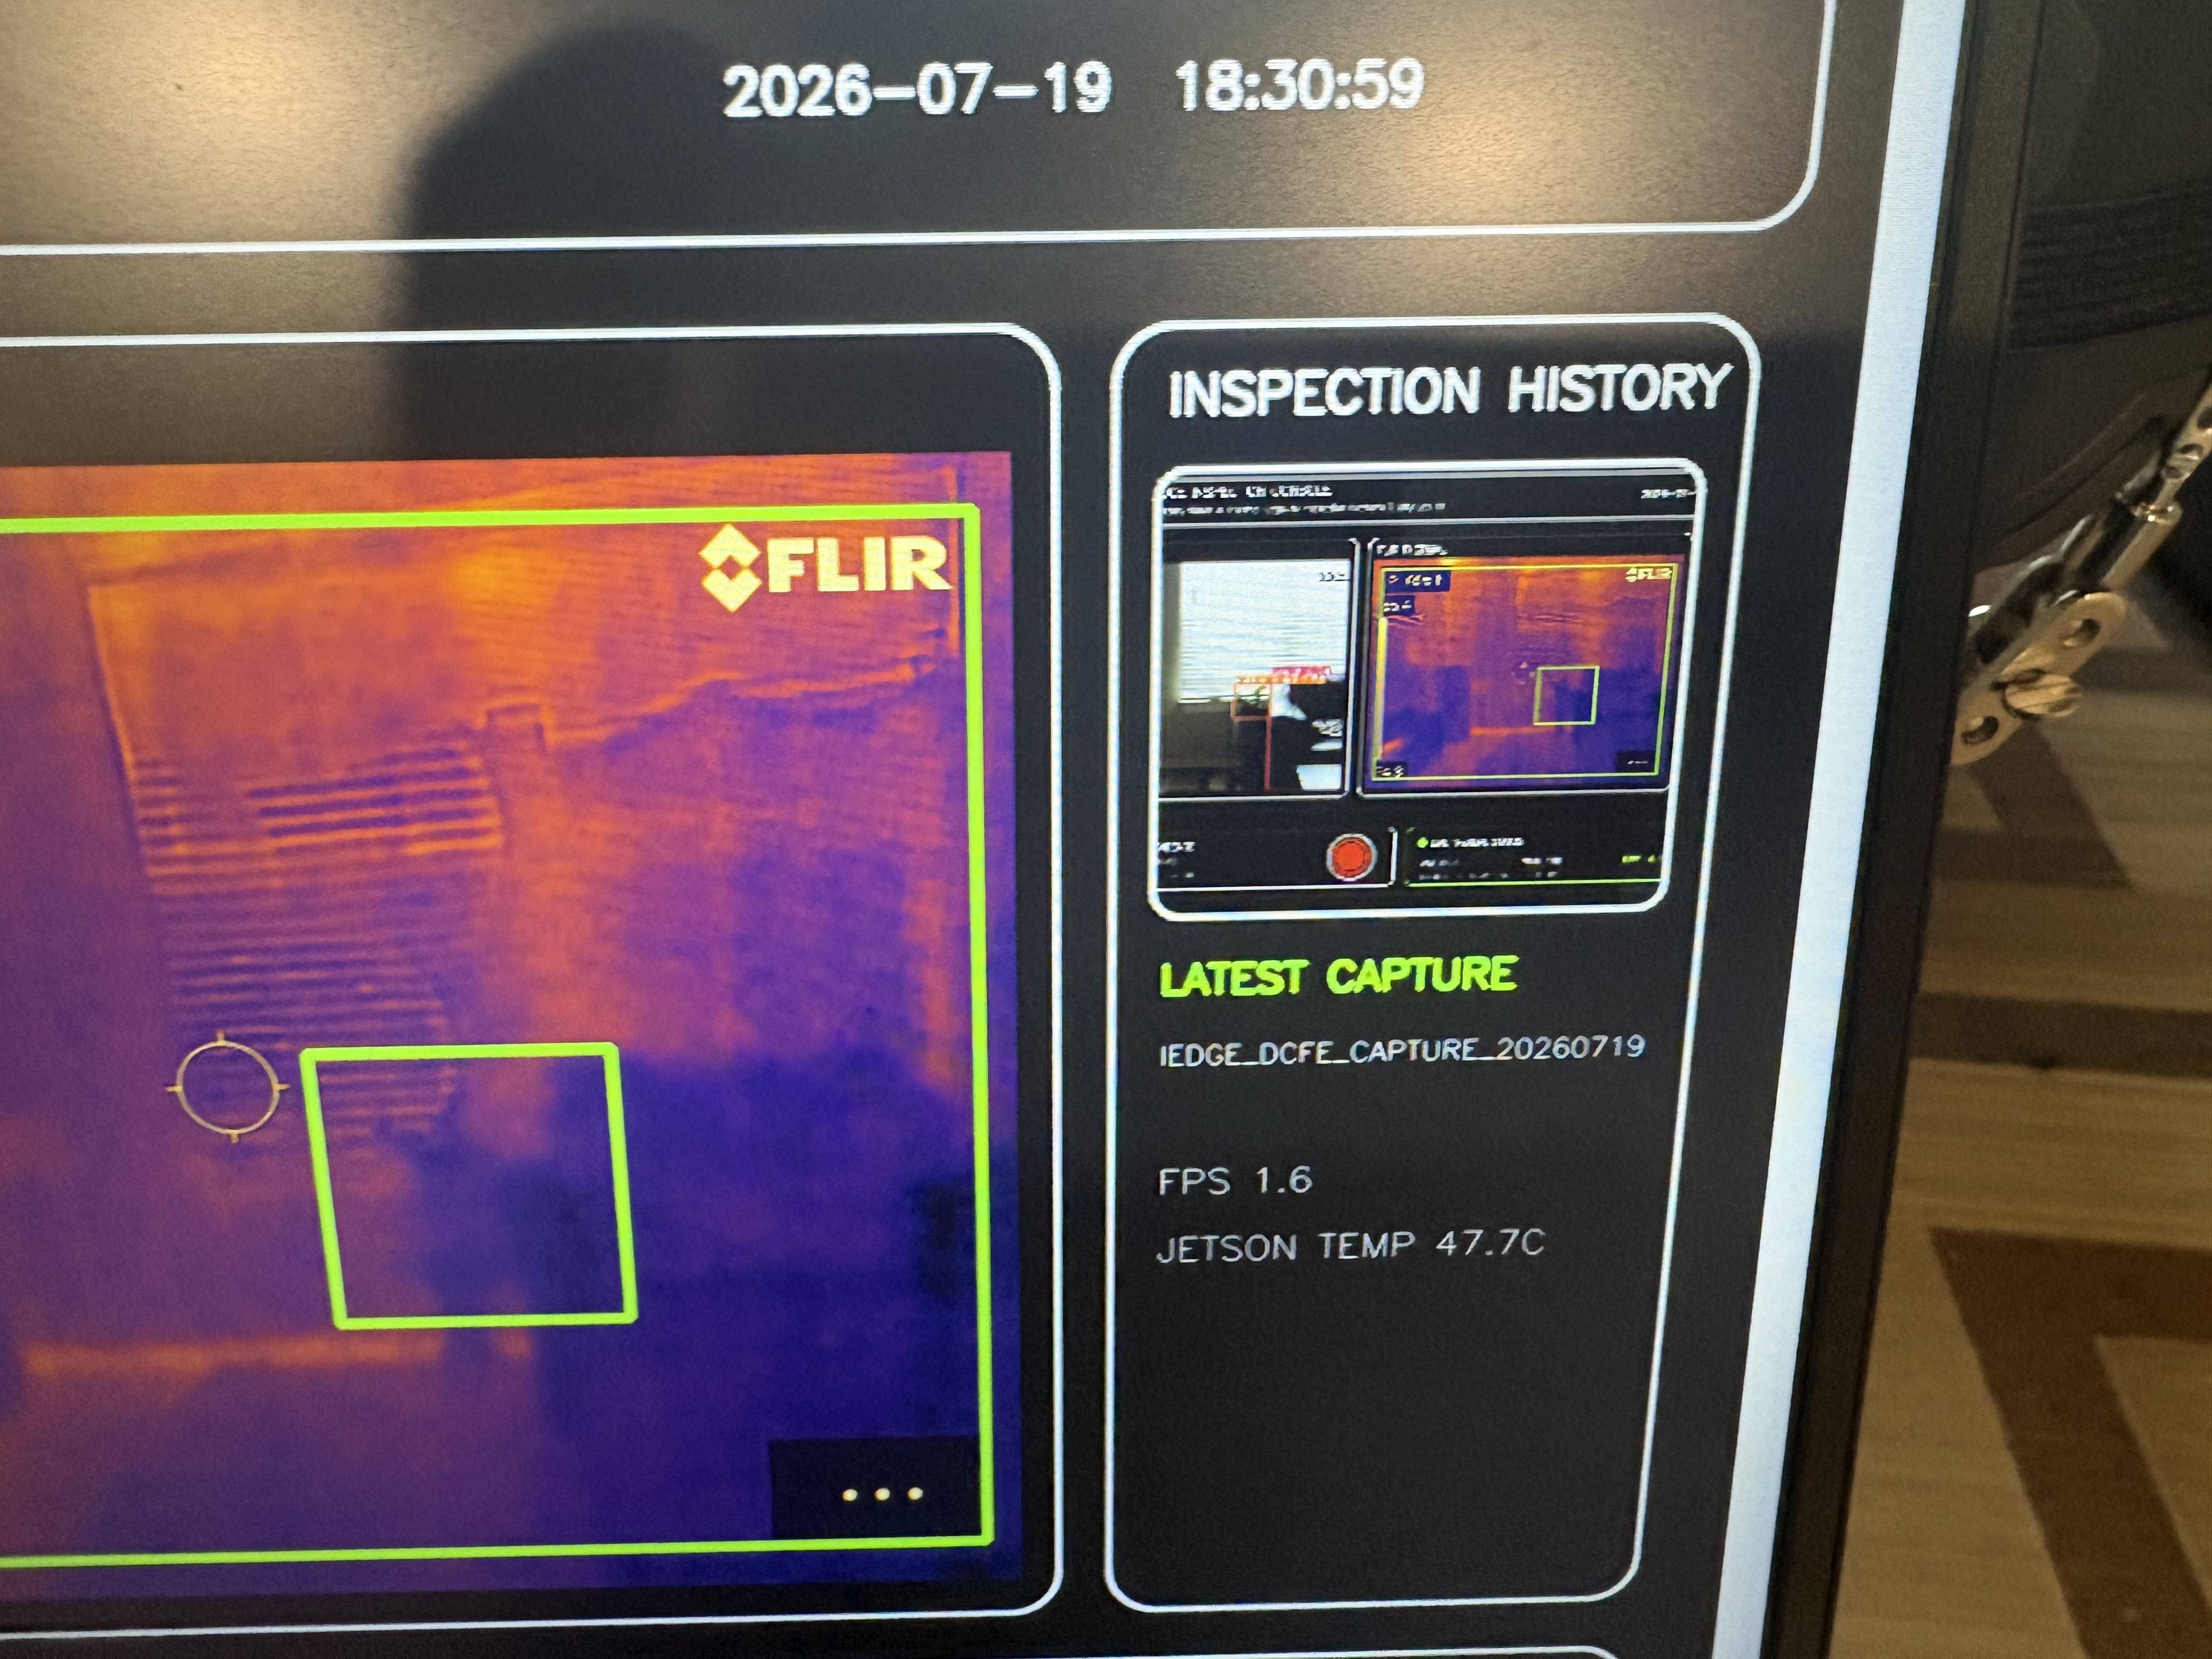
FLIR thermal feed with relative intensity indicators and Inspection History.
-
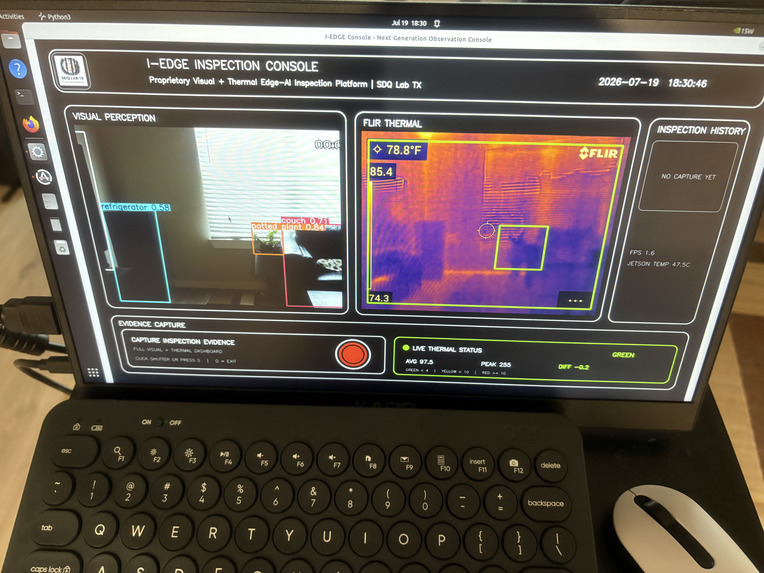
Unified visual-and-thermal dashboard during real-hardware testing.
-
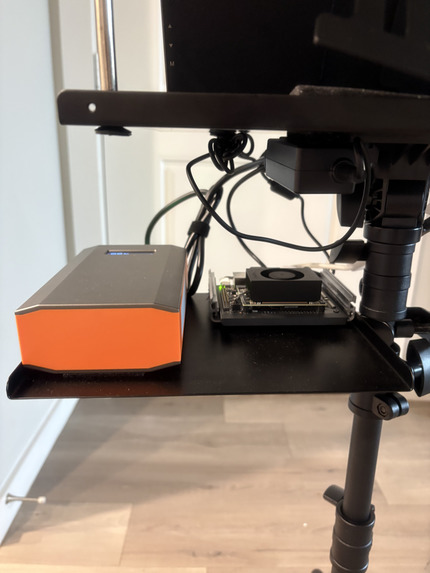
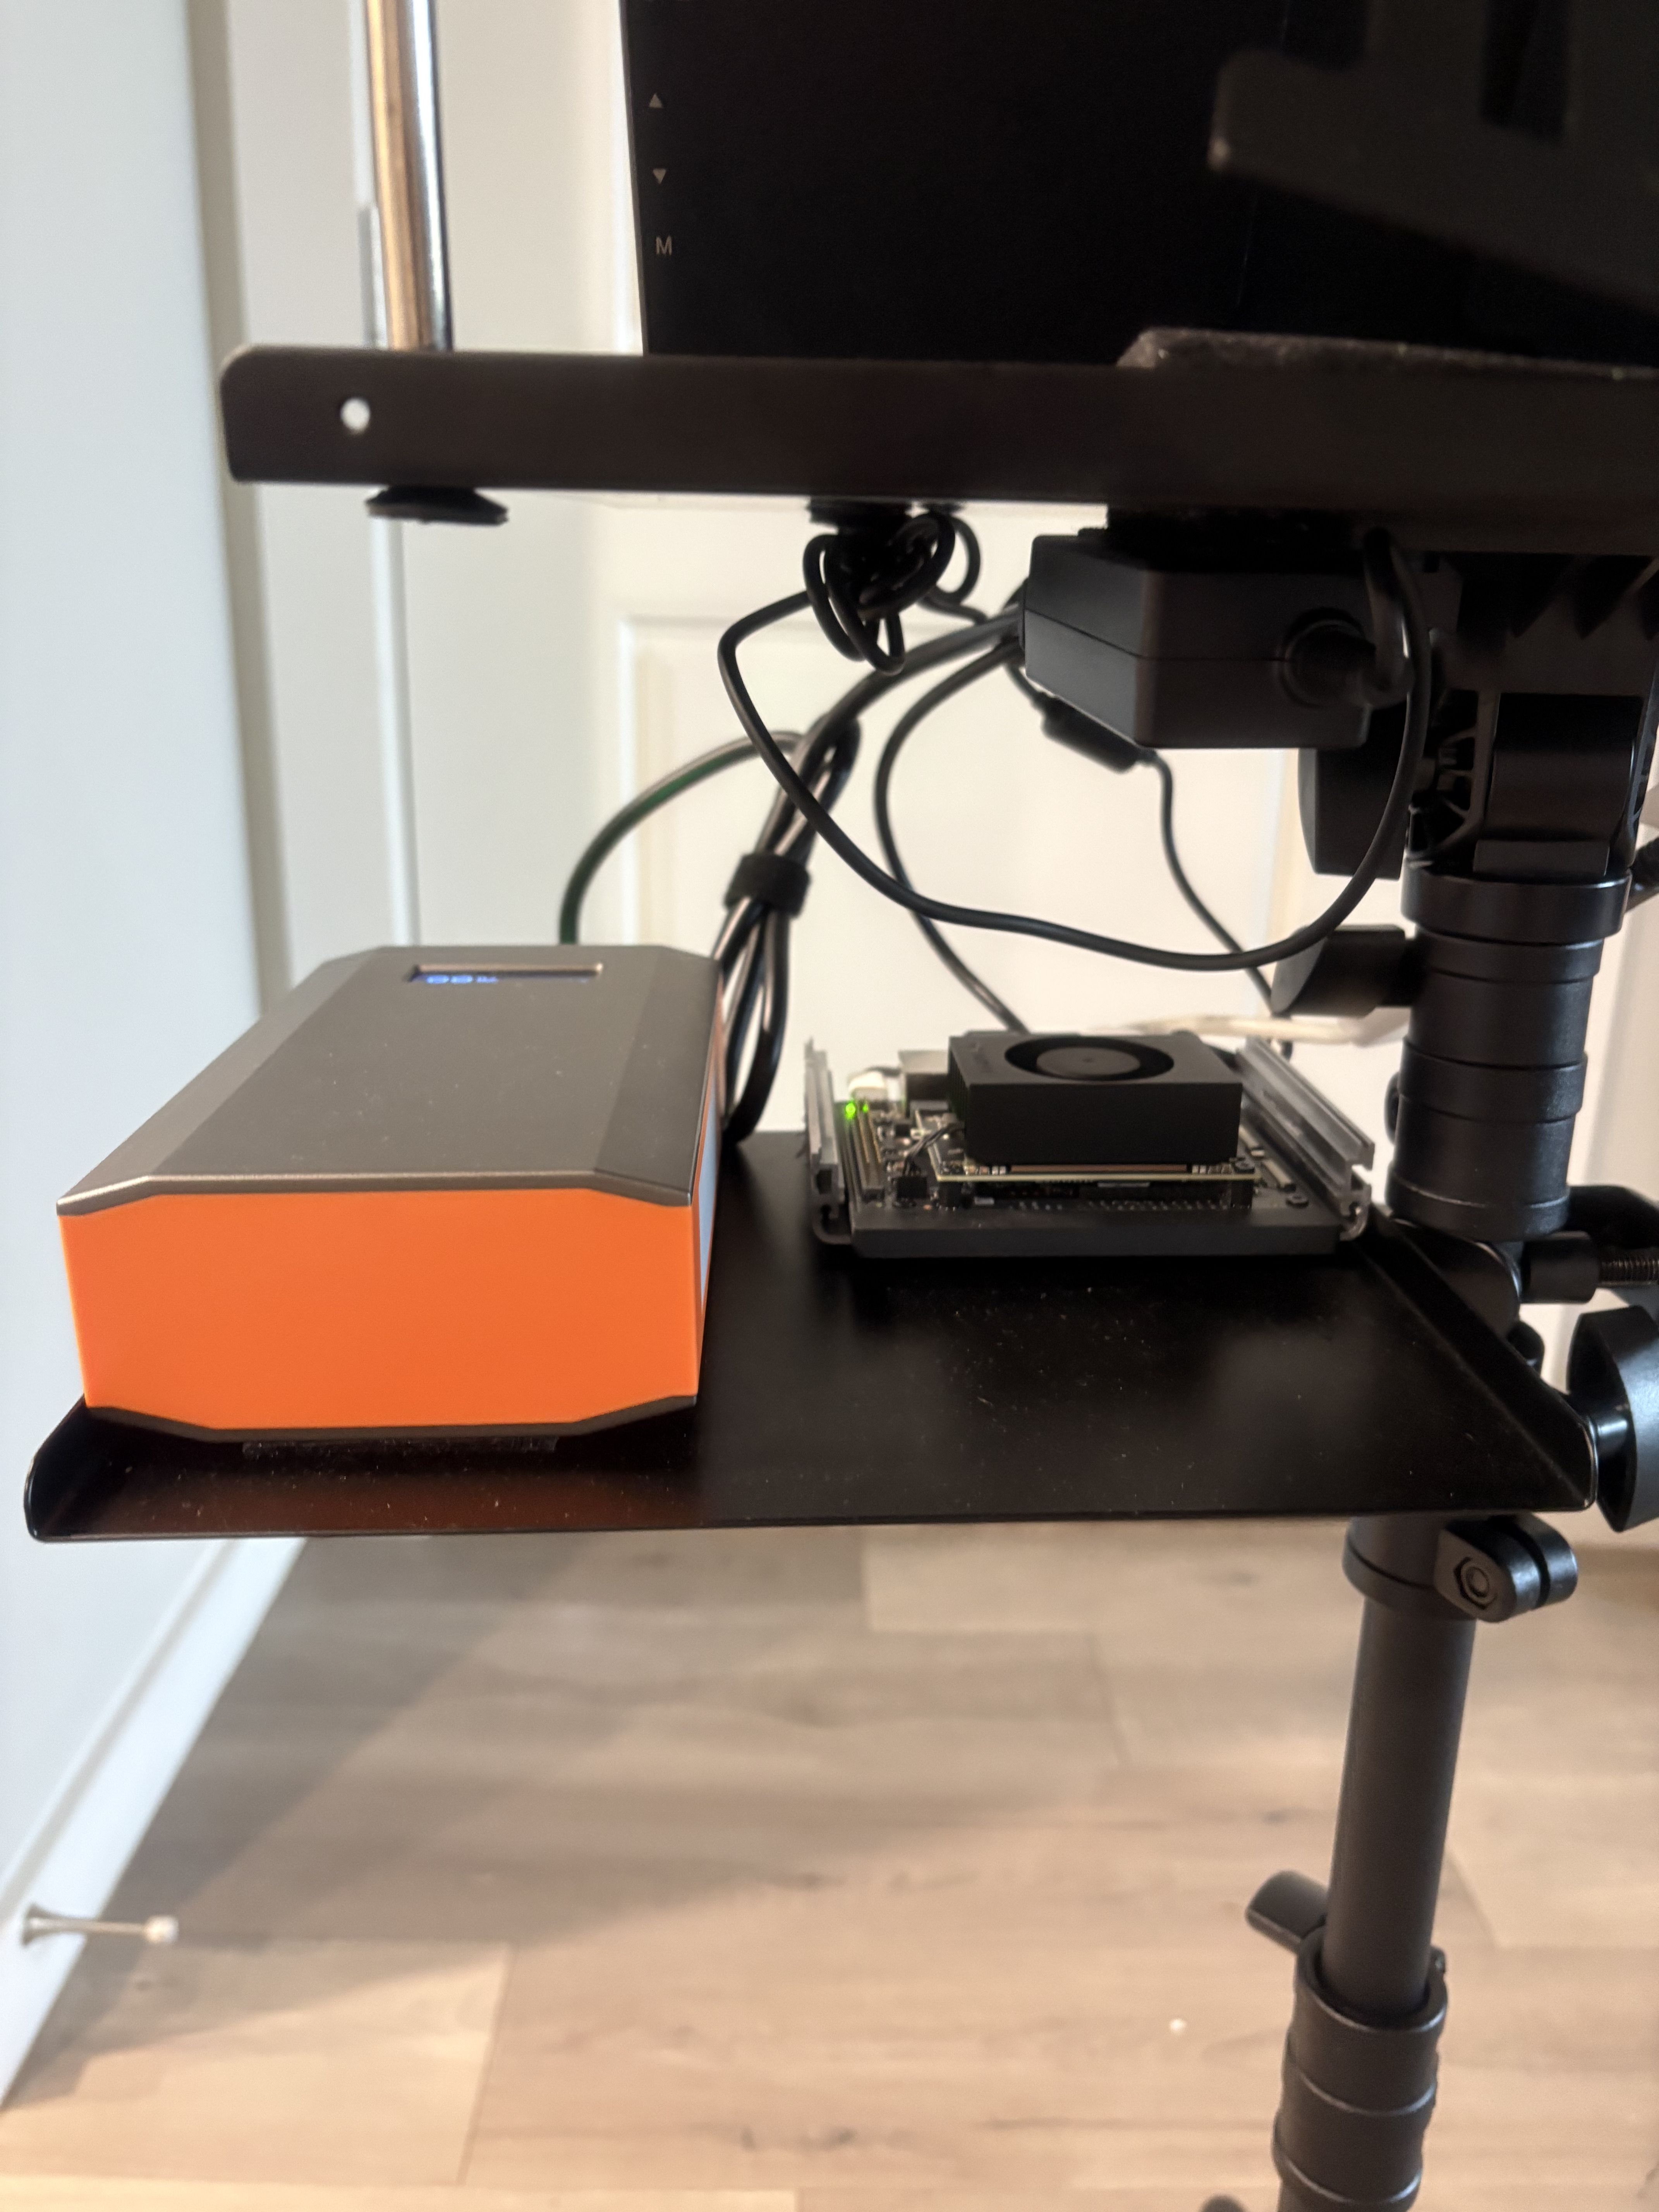
NVIDIA Jetson edge-compute hardware powering the I-EDGE console.
-
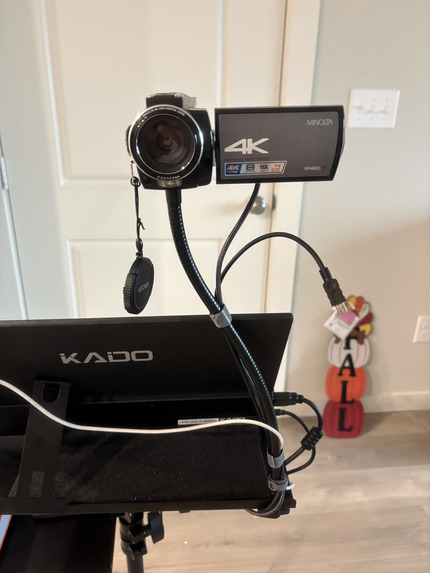
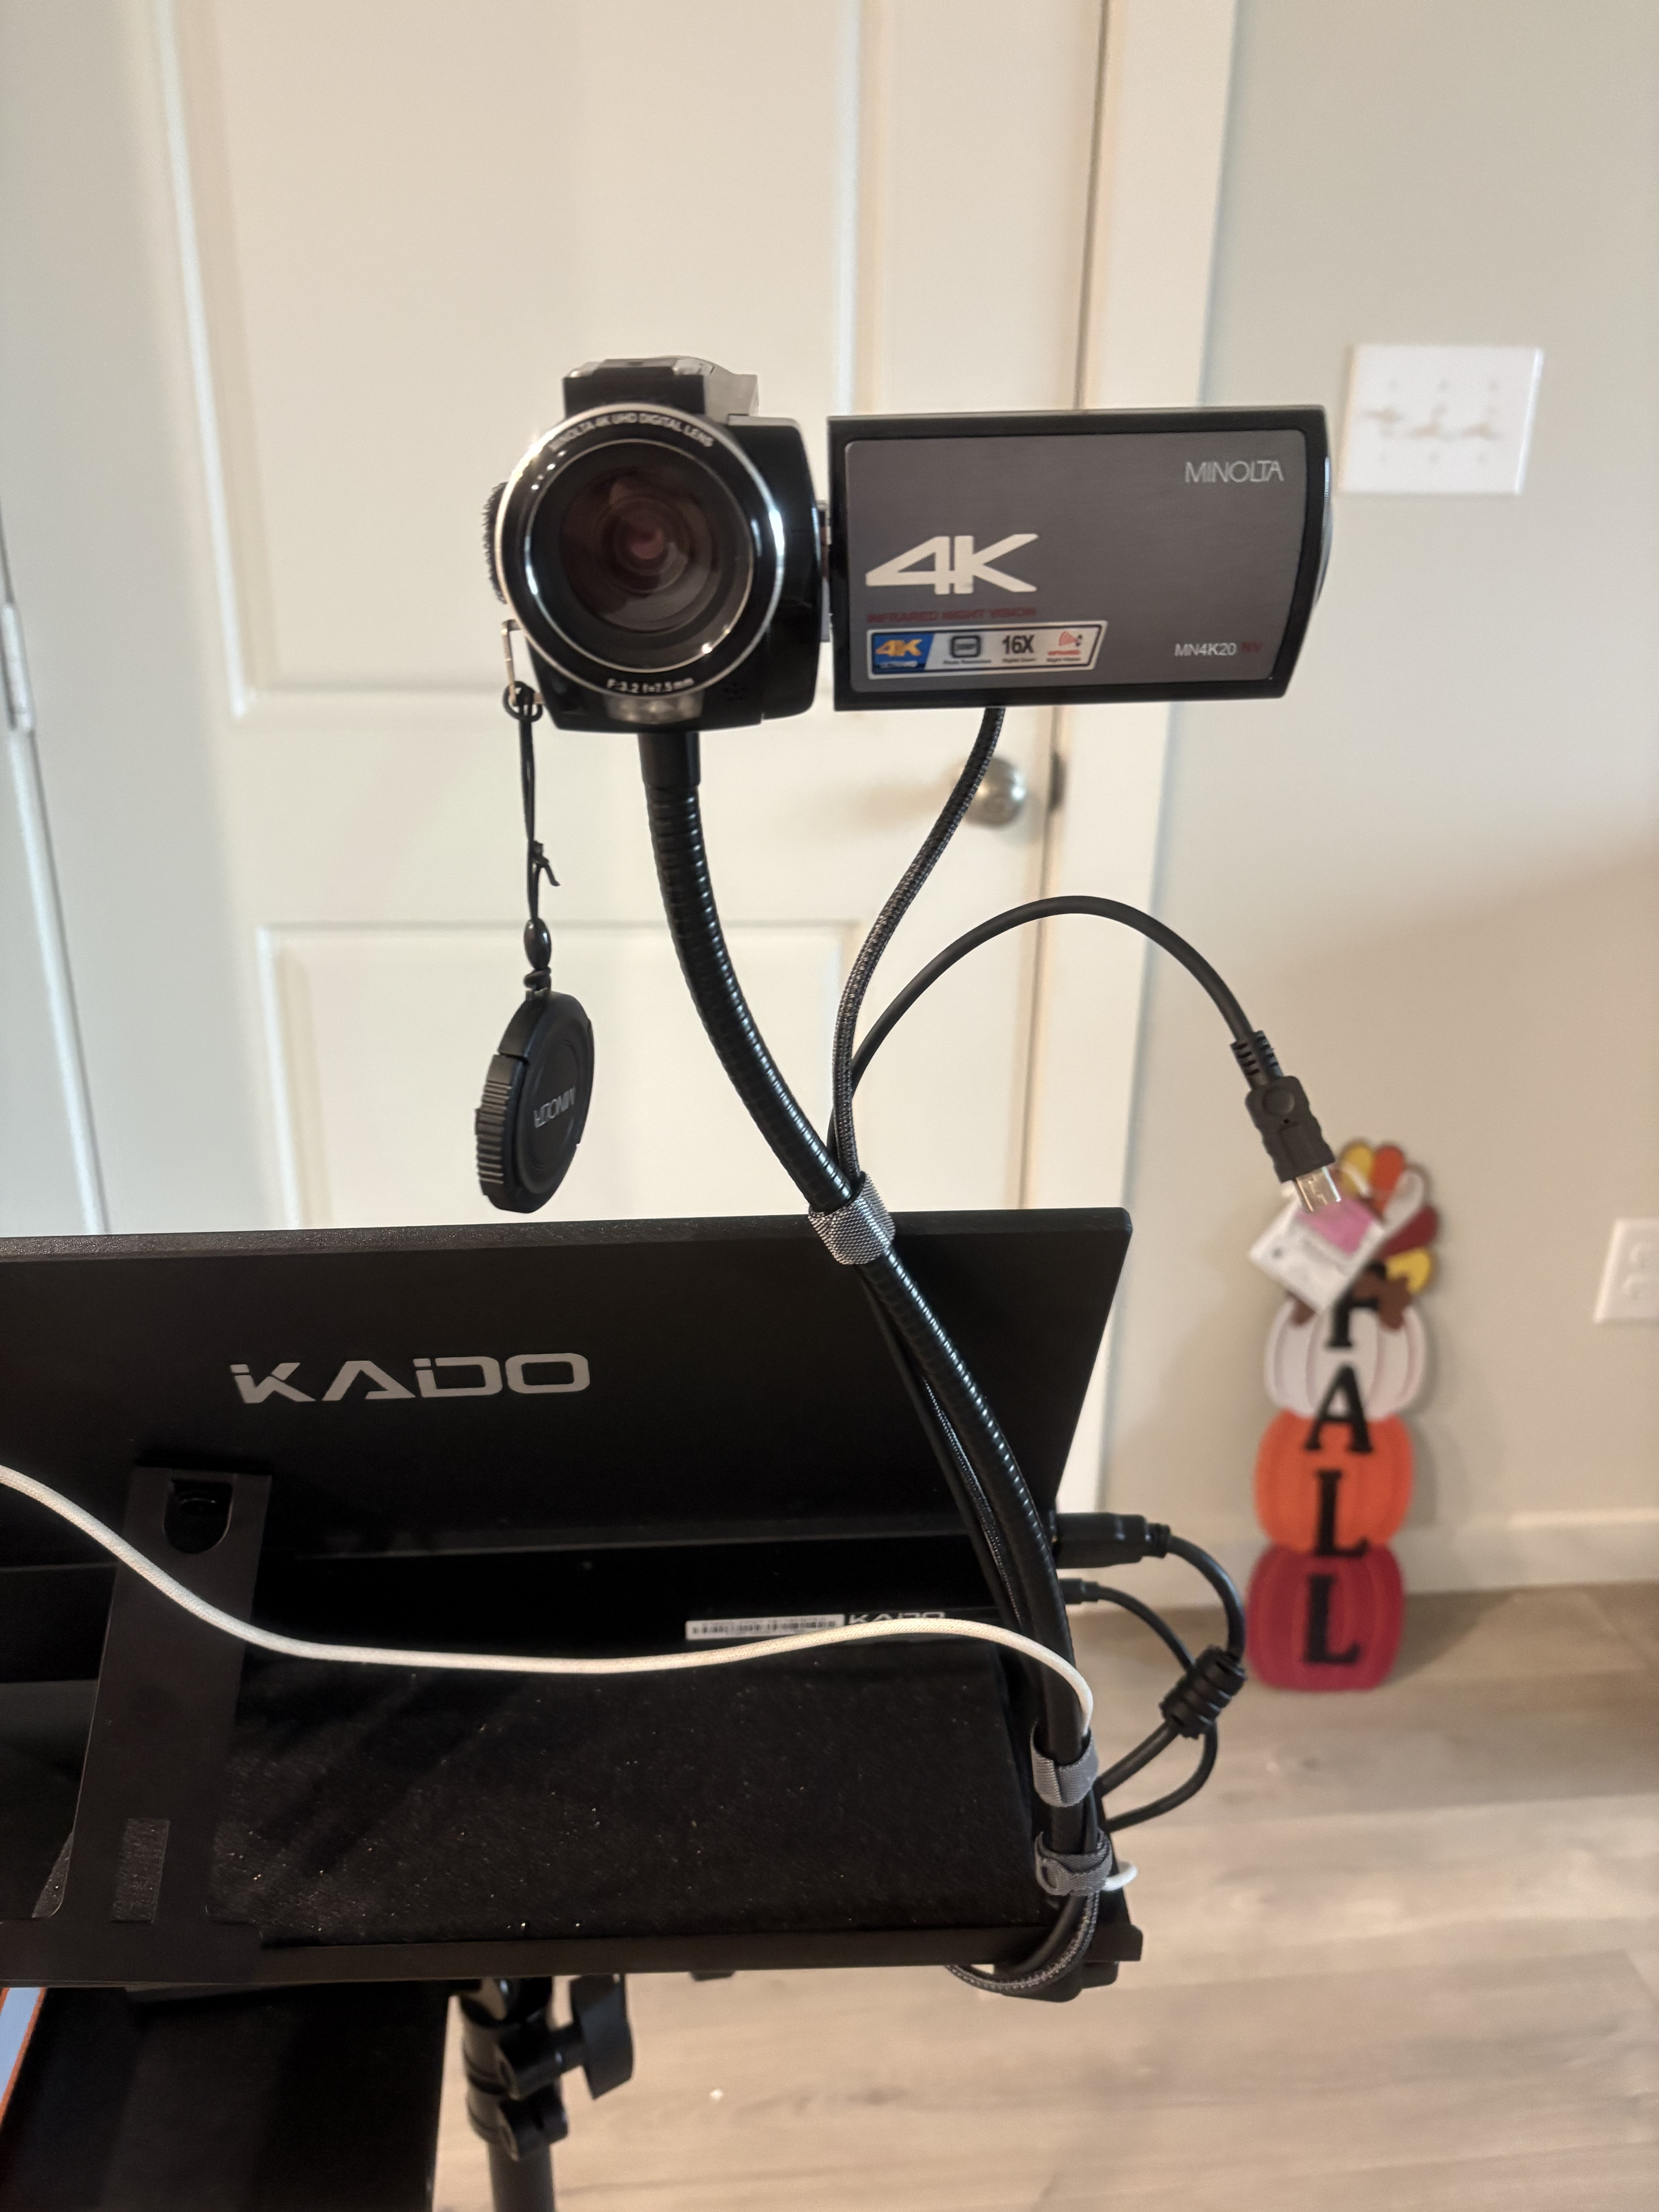
RGB Sensor and display mounting used for the inspection prototype.
-
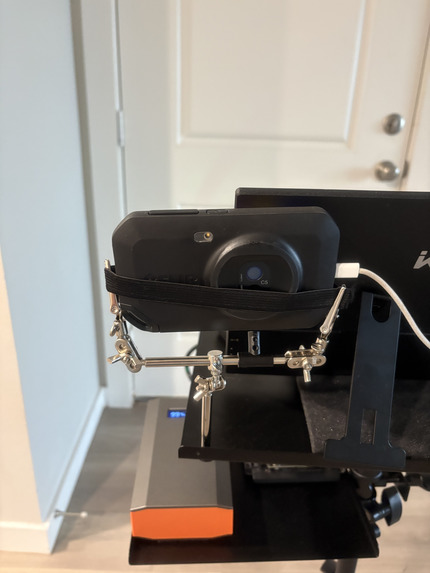
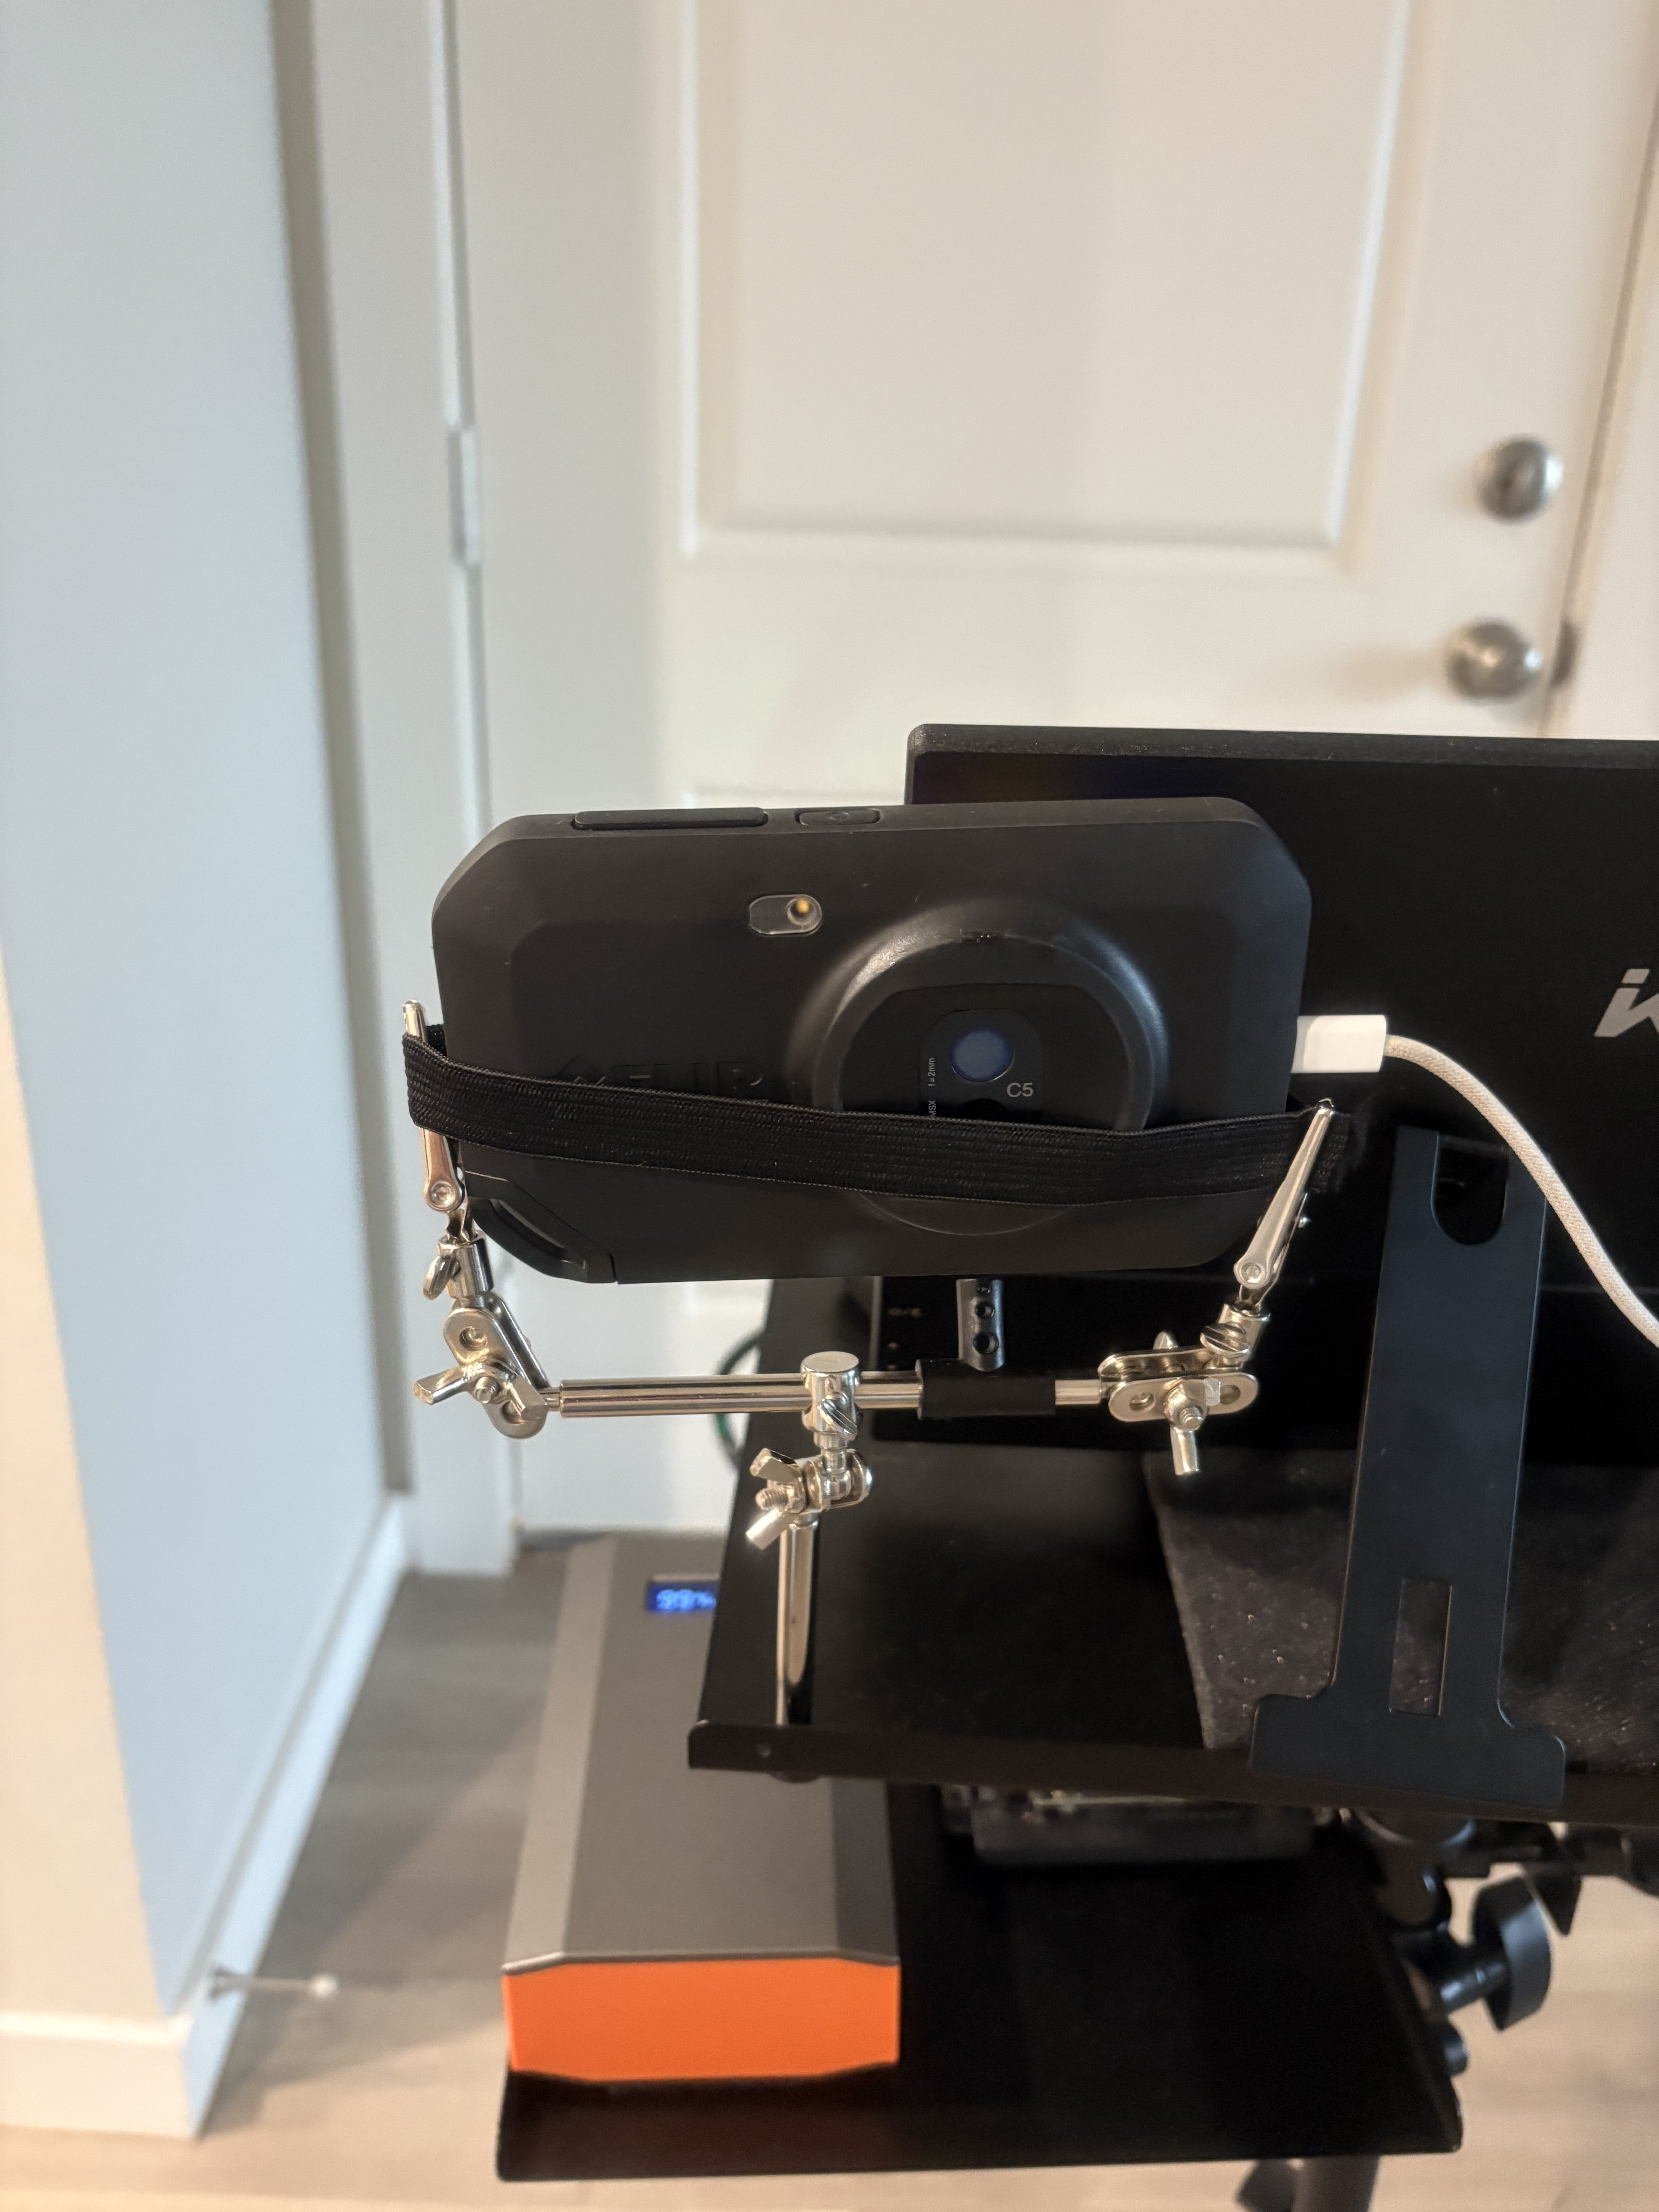
Flir camera used for live object detection and visual evidence capture.
-
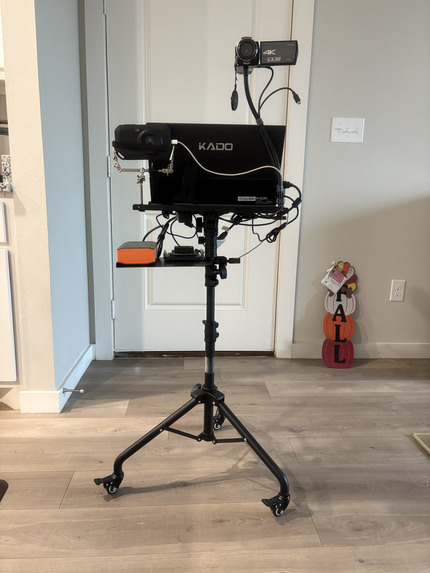
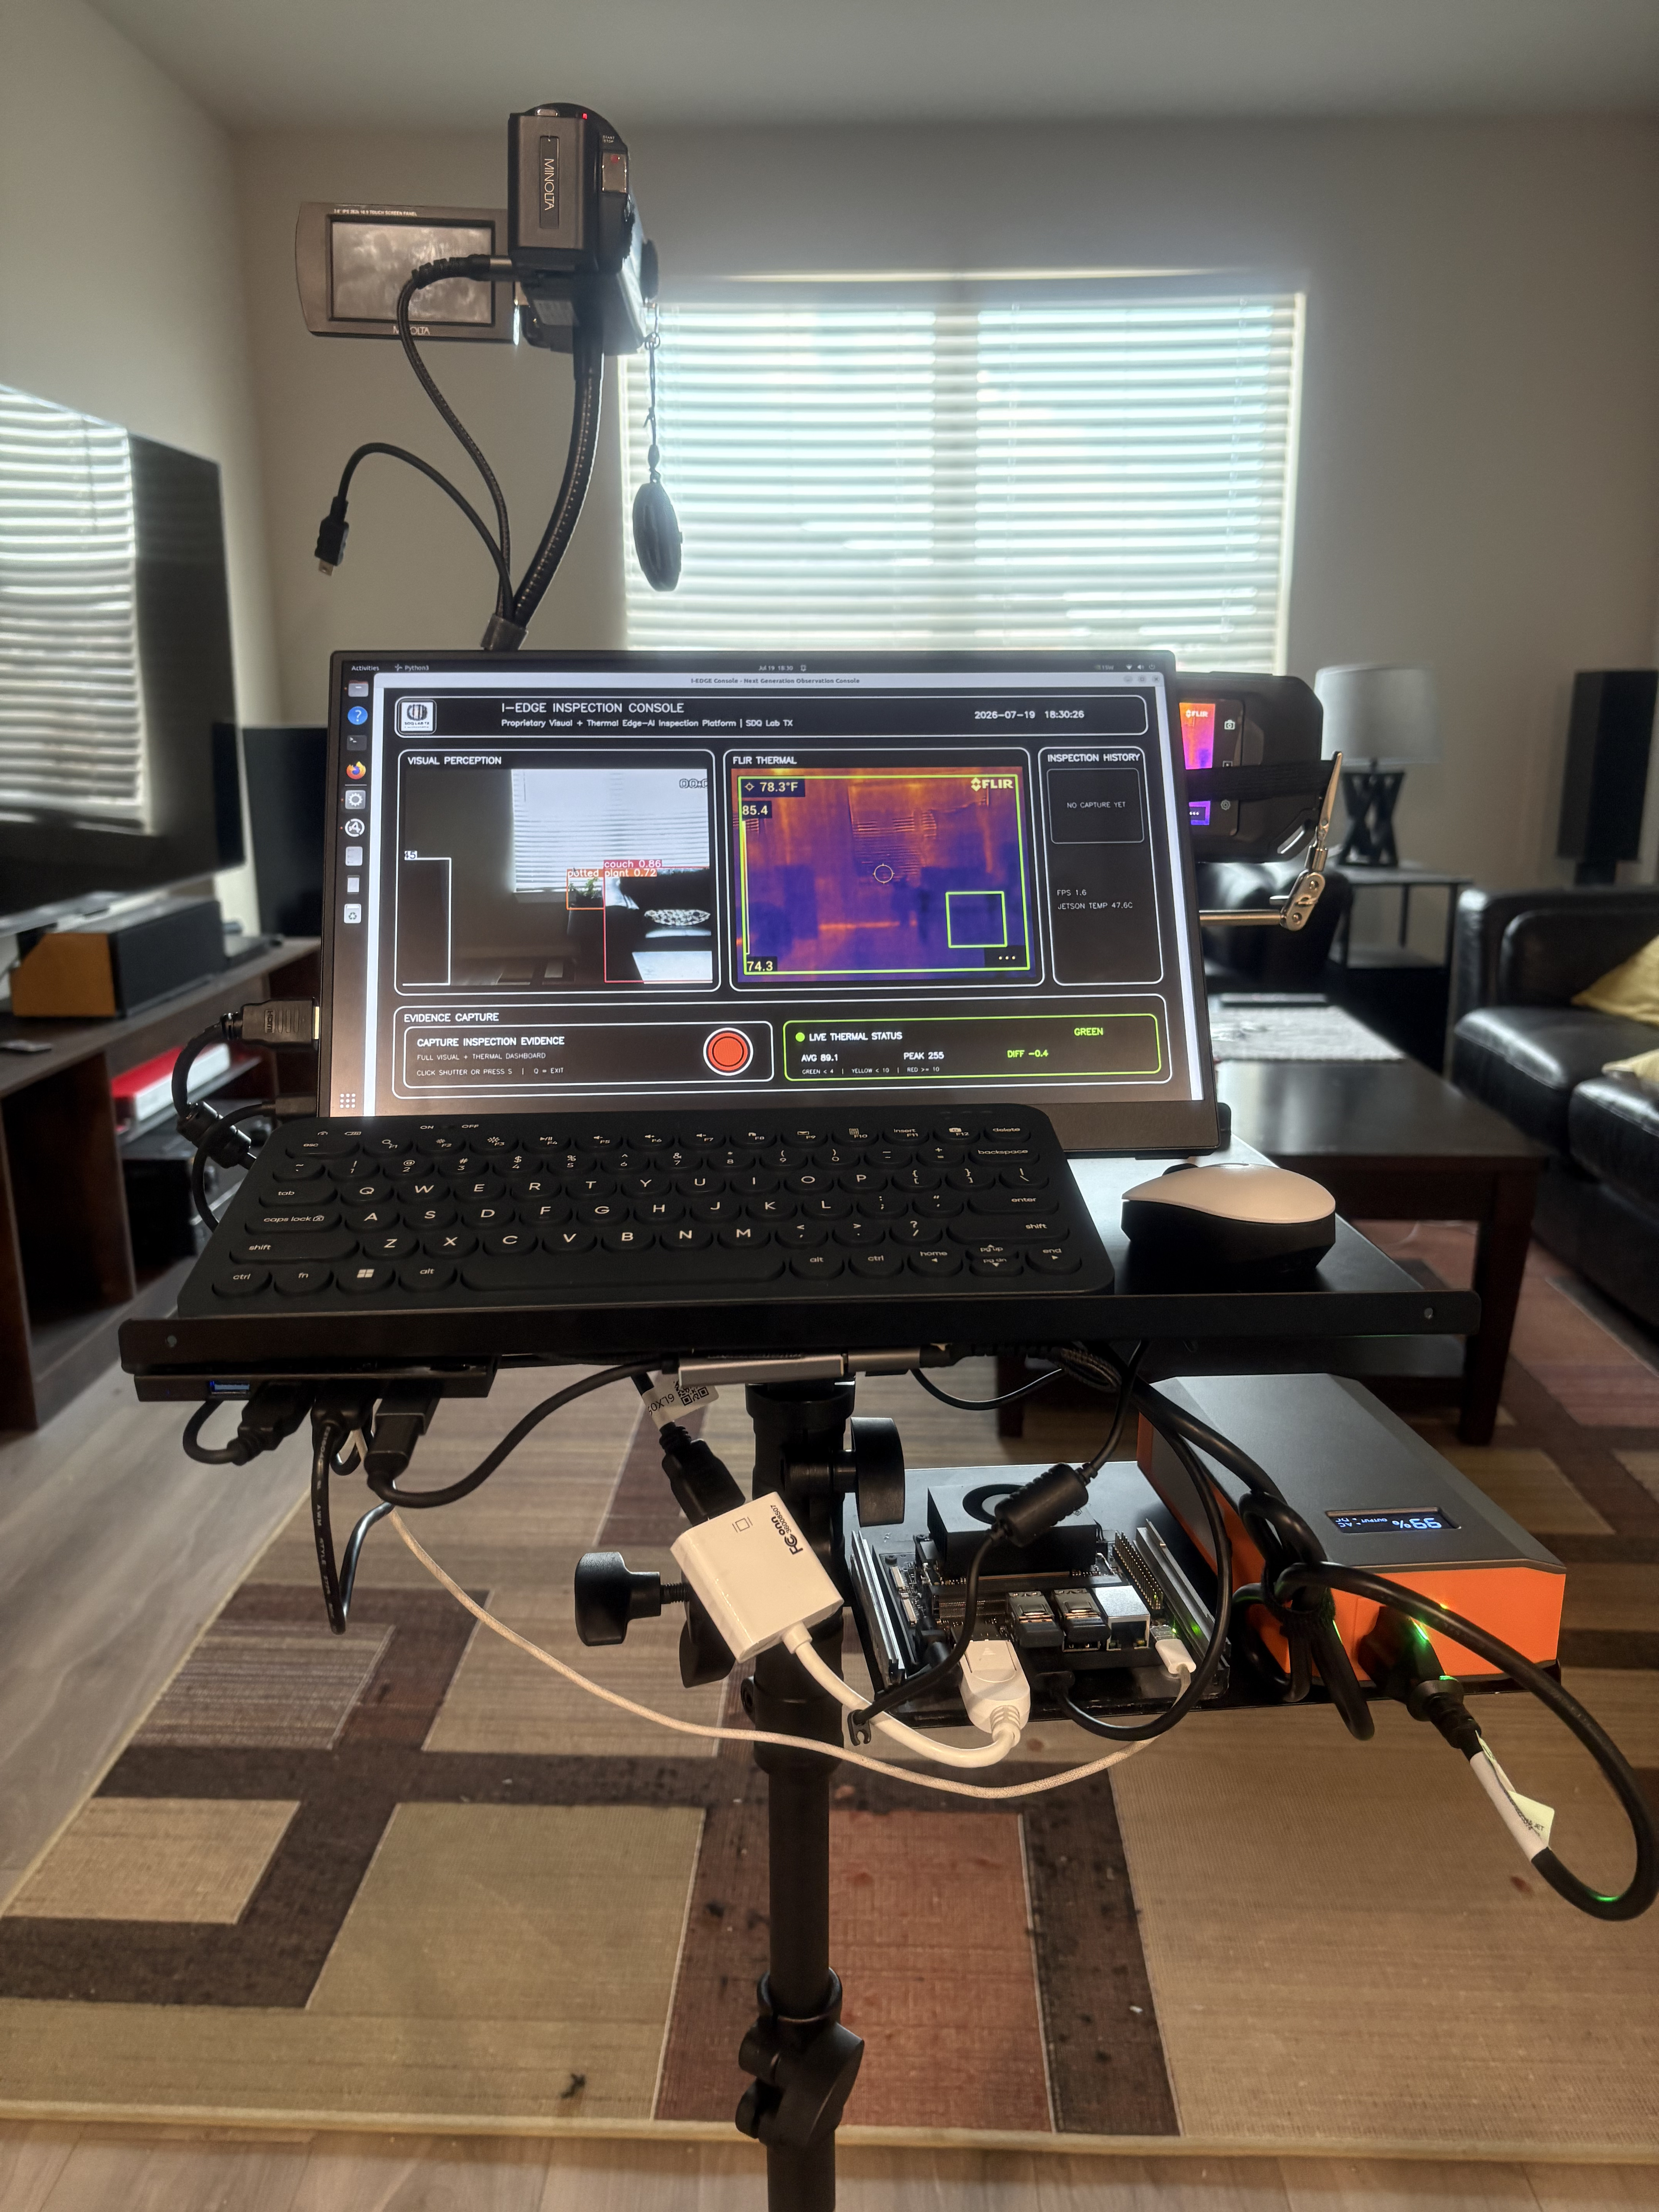
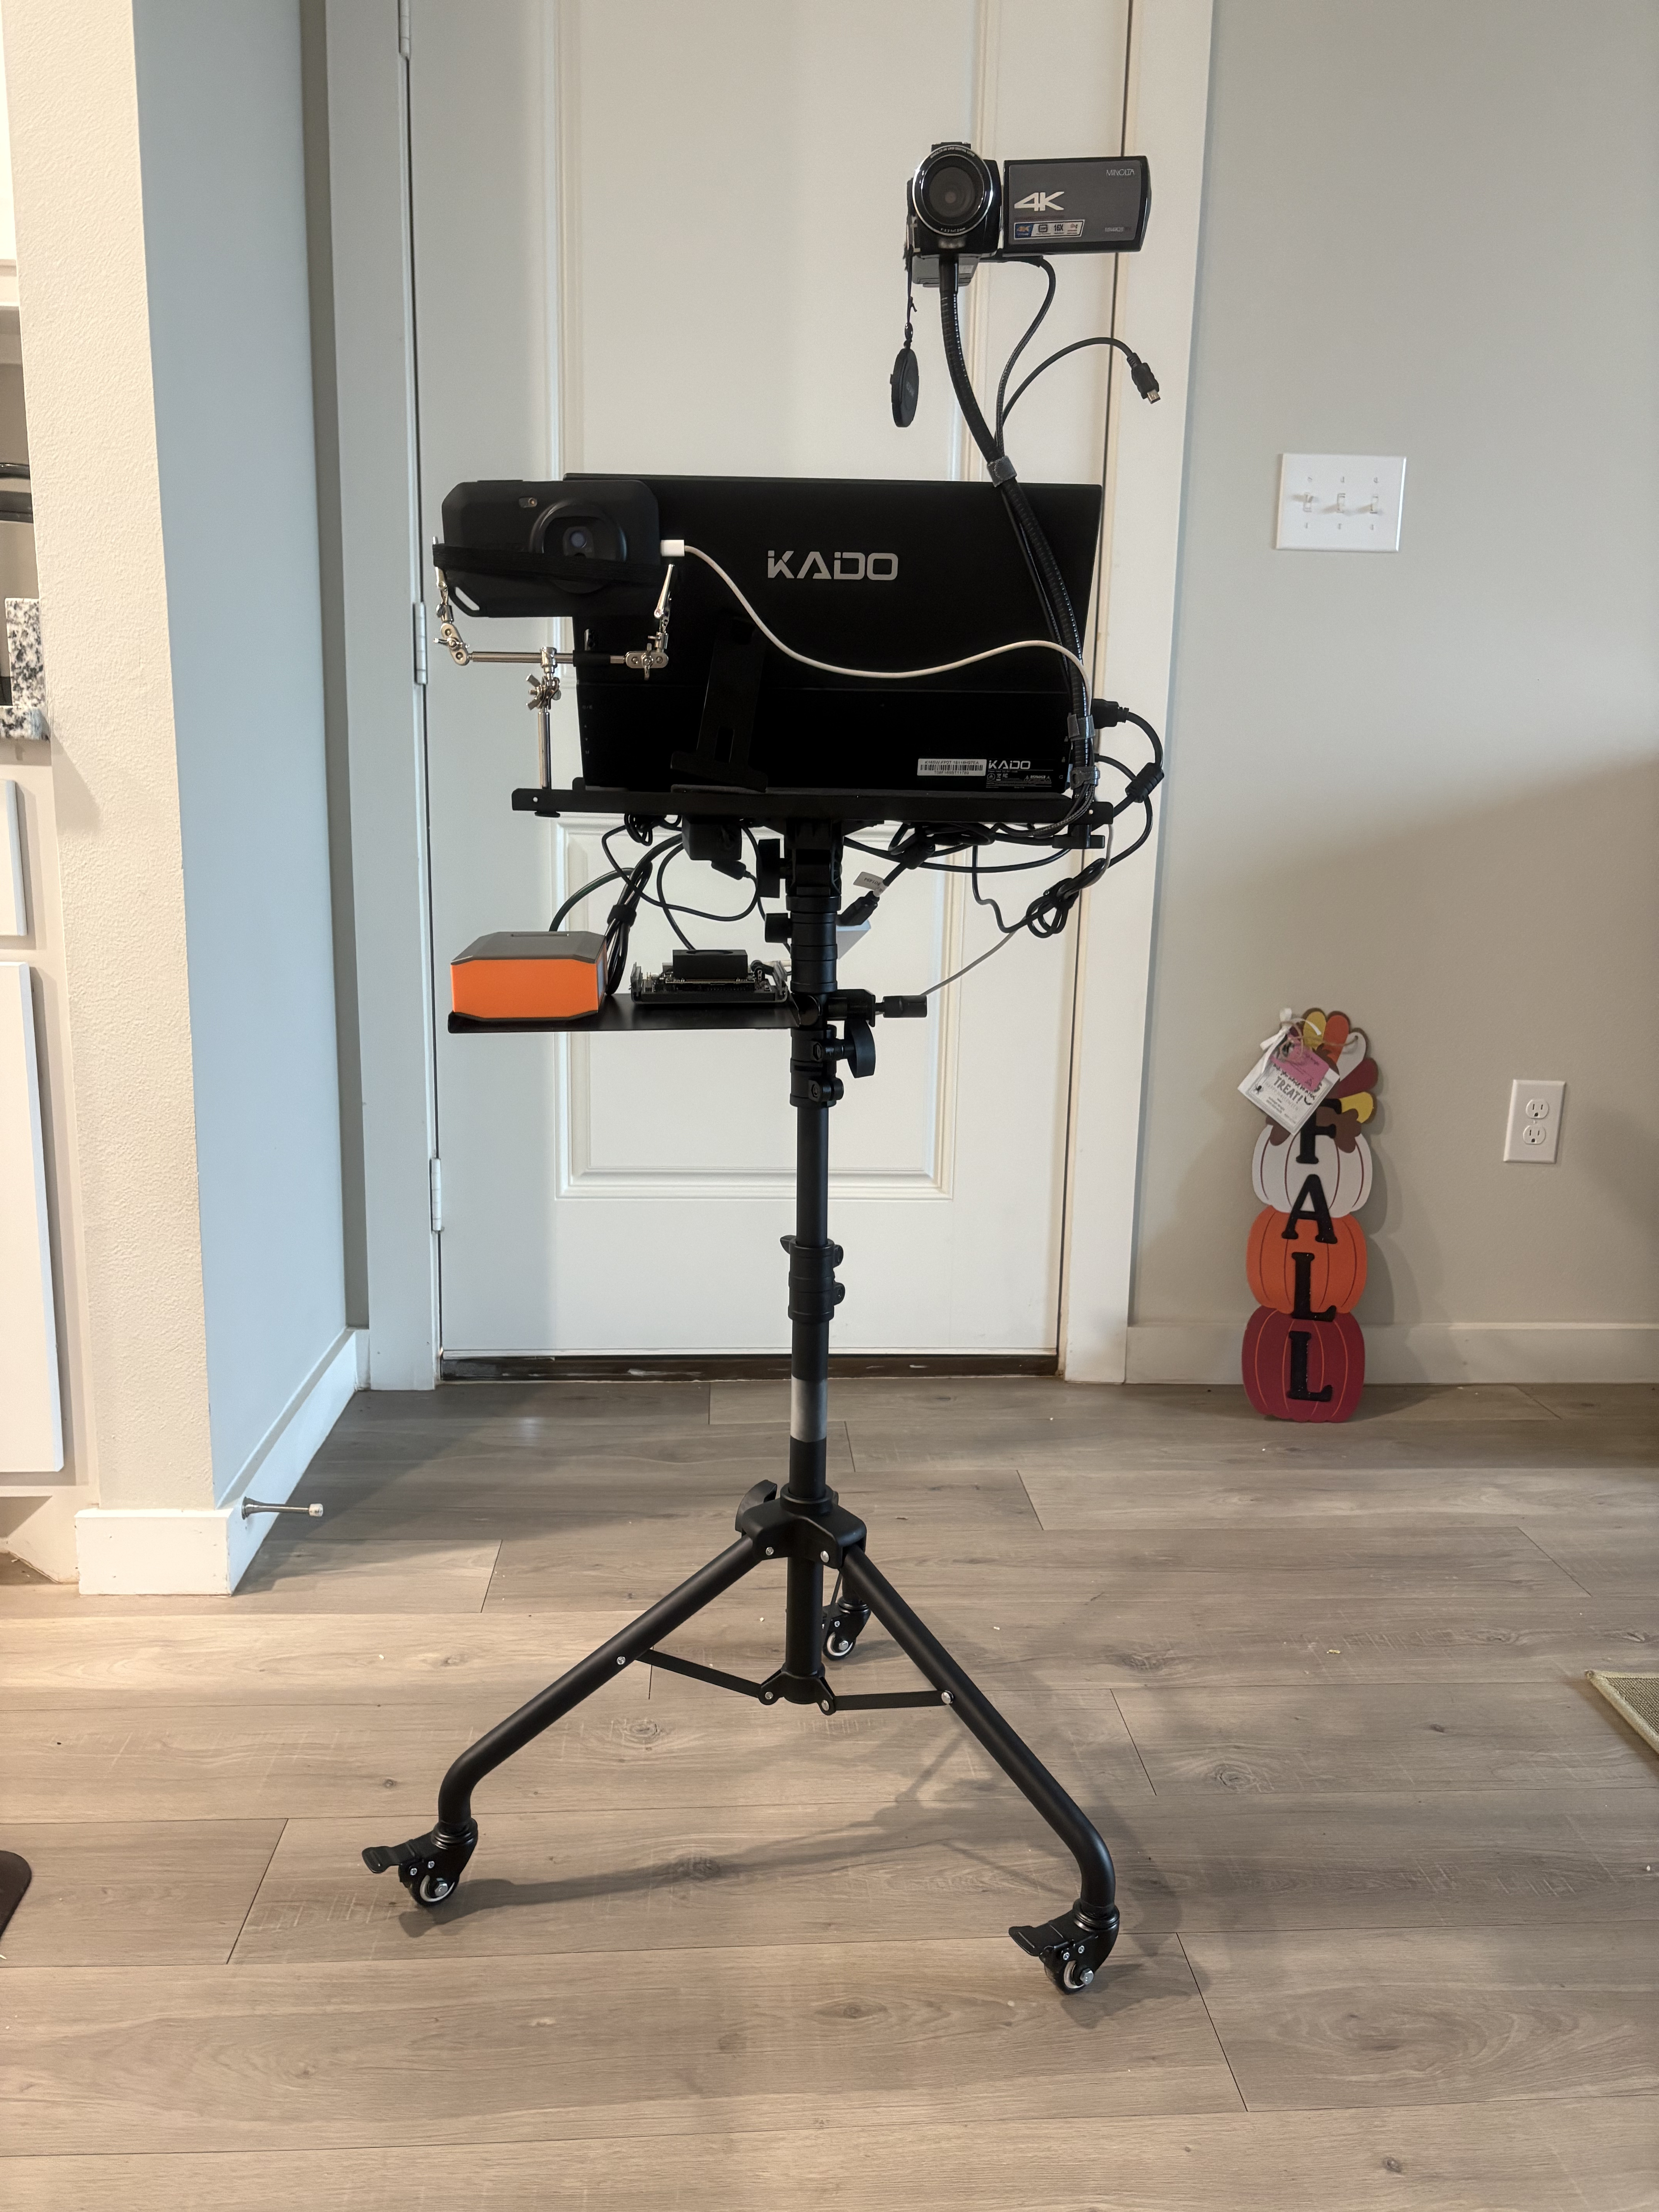
Portable I-EDGE sensor rig configured for field-style inspection testing.
-
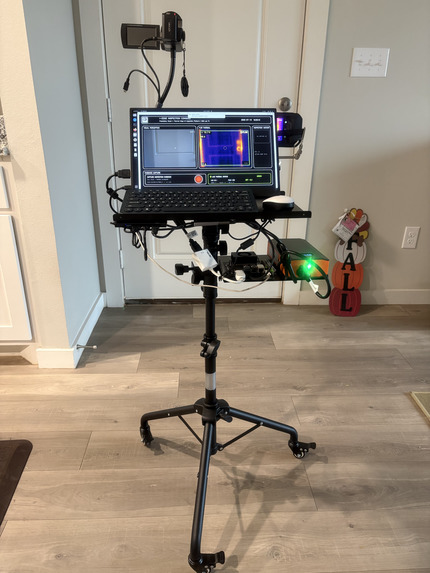
Complete I-EDGE prototype with Jetson, sensors, display, and operator controls.
-
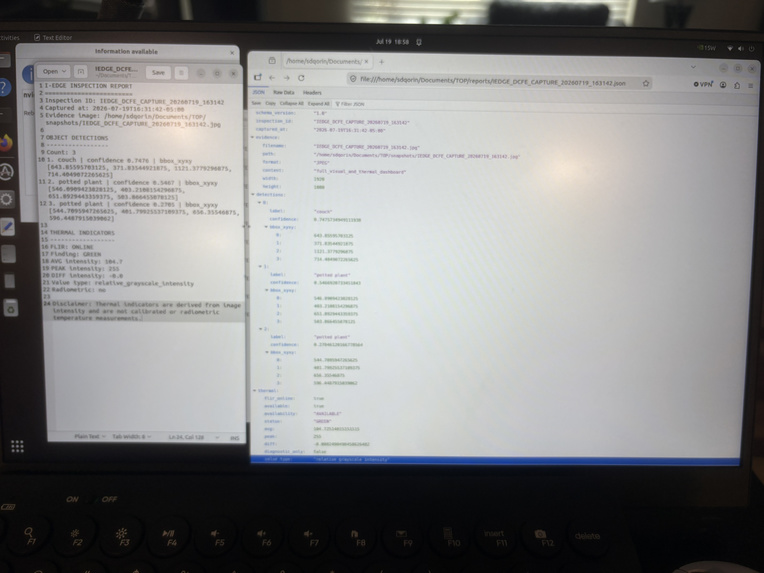
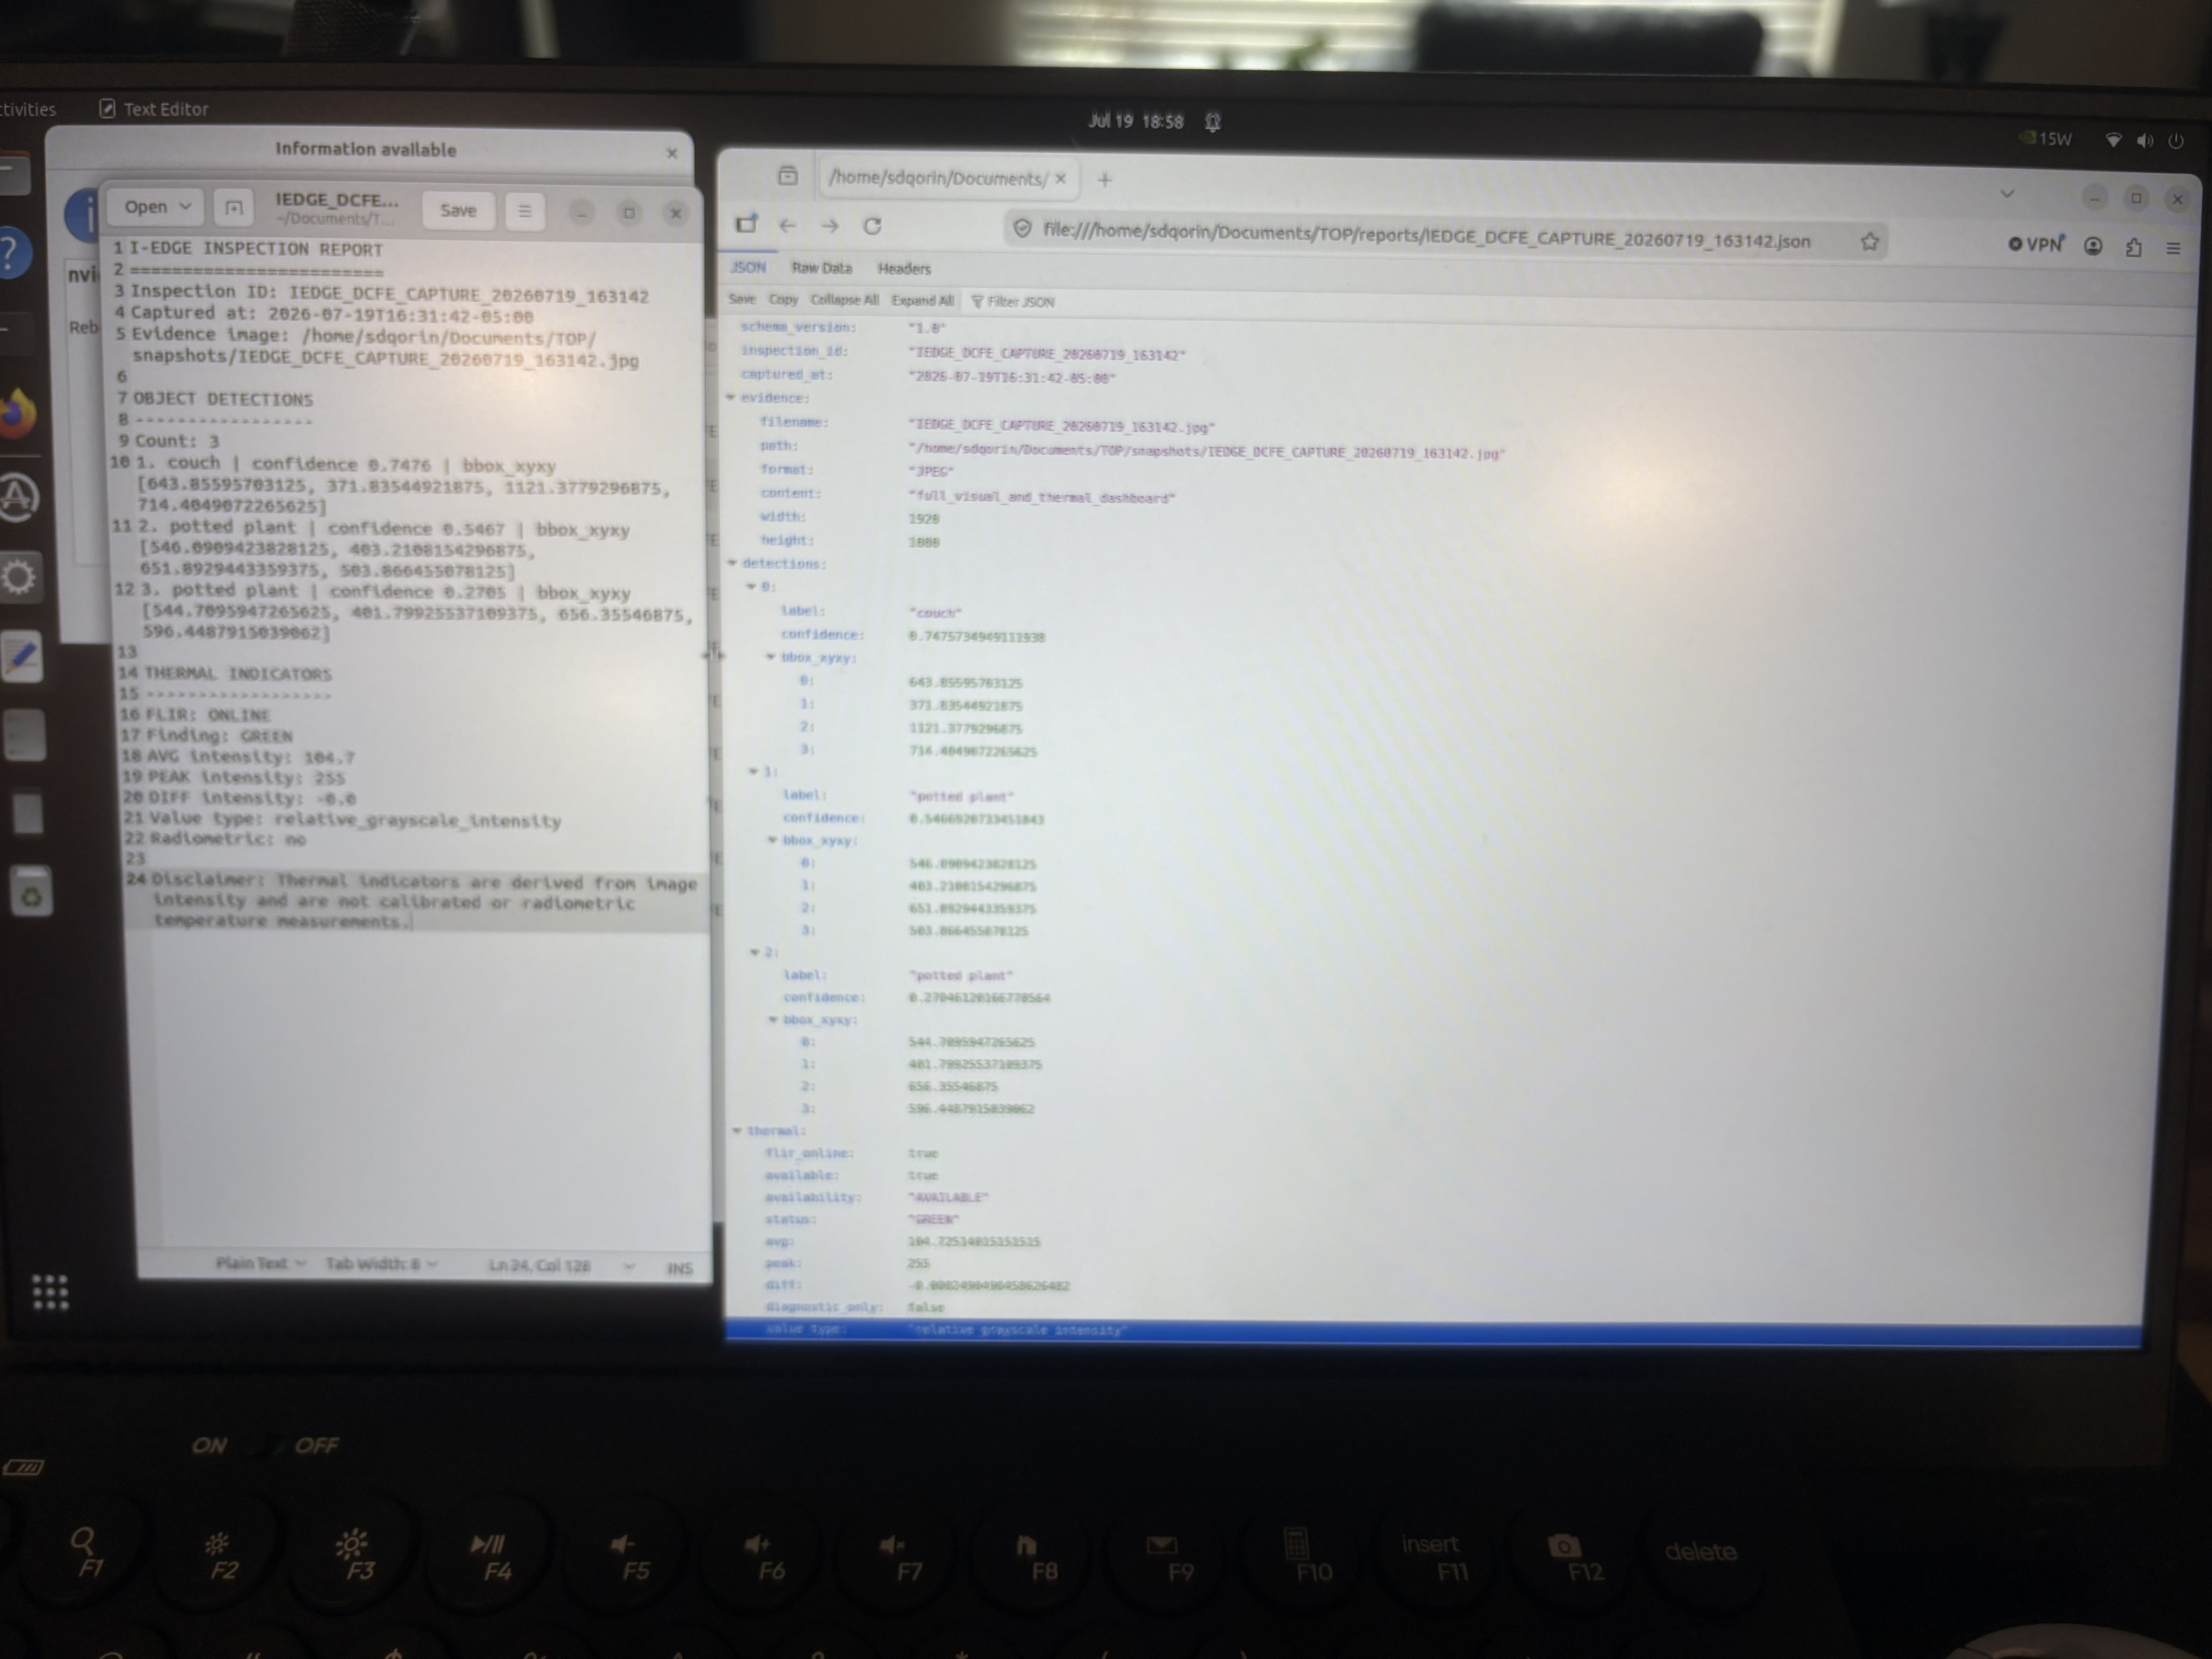
Codex-assisted implementation and integration of structured inspection reporting.
-
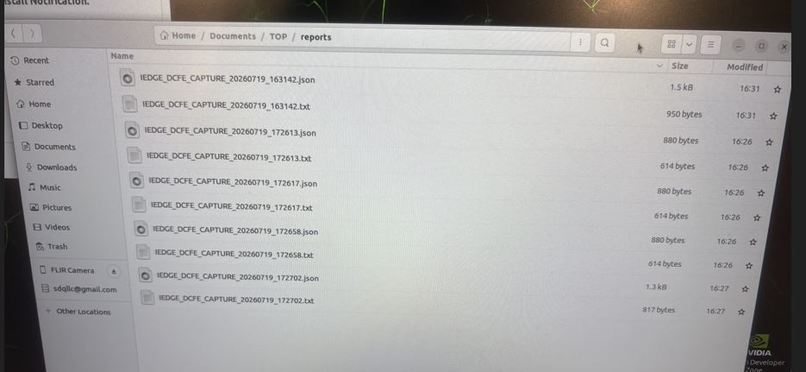
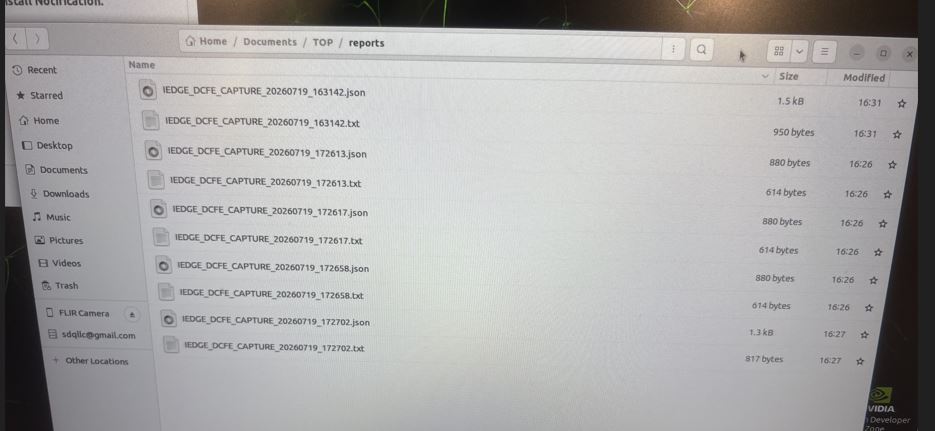
Automated report-generator test suite completing with nine passing tests.
Inspiration
Industrial inspections often produce fragmented evidence: a visual image in one place, thermal information somewhere else, and operator notes recorded separately. I built I-EDGE to combine those steps into one edge-AI workflow that can observe, document, and preserve inspection evidence directly on local hardware.
What it does
I-EDGE is an NVIDIA Jetson-powered visual and thermal inspection console.
It combines:
- Live RGB object detection
- FLIR thermal imaging
- Colored object-detection boxes
- Relative thermal intensity indicators
- Operator evidence capture
- Inspection History preview
- Structured JSON inspection reports
- Human-readable TXT reports
- Automatic startup on the Jetson
When the operator presses the evidence-capture button, I-EDGE saves the complete visual and thermal dashboard. It then generates a matching inspection record containing the inspection ID, timezone-aware timestamp, evidence path, detected objects, confidence scores, bounding boxes, FLIR availability, and thermal indicators.
Thermal values are relative image-intensity indicators and are not calibrated radiometric temperature measurements.
How I built it
I-EDGE runs locally on an NVIDIA Jetson using Python, OpenCV, Ultralytics YOLO, an RGB video source, and a FLIR thermal camera.
The dashboard processes both sensor streams in real time, renders object detections, calculates relative thermal metrics, and provides a single operator interface for evidence capture.
During OpenAI Build Week, I used GPT-5.6 through Codex to inspect the existing architecture and identify the safest integration point after a successful evidence capture.
Codex helped implement:
- A modular
report_generator.py - Paired JSON and TXT inspection reports
- Atomic report-file writing
- Detection serialization in original model order
- FLIR online/offline handling
- Timezone-aware timestamps
- Non-radiometric measurement labeling
- Standard-library unit tests
- Repository and judging documentation
The reporting feature was validated with nine passing unit tests and a successful real-hardware smoke test on the Jetson.
Challenges
The main challenge was extending a working hardware system without breaking camera access, thermal processing, object detection, dashboard rendering, or evidence capture.
The report generator therefore runs only after the dashboard image has been saved successfully. Report failures are isolated so they cannot terminate the application or invalidate the operator’s evidence capture.
Another challenge was keeping the thermal data technically honest. The current FLIR workflow uses relative image intensity, so the reports explicitly distinguish those indicators from calibrated or radiometric temperature measurements.
Accomplishments
- Built a working RGB and FLIR edge-AI inspection console
- Deployed it on real NVIDIA Jetson hardware
- Added stable camera-device paths
- Added evidence capture and Inspection History
- Added autonomous startup after reboot
- Added Codex-built structured inspection reporting
- Passed all nine automated report tests
- Completed a successful end-to-end Jetson smoke test
- Published a documented private judging repository and public video demonstration
What I learned
I learned that adding a feature to a live hardware pipeline requires more than writing code. The integration point, failure isolation, data normalization, deployment assumptions, and operator workflow all matter.
Codex was especially valuable for mapping the existing architecture, proposing a safe modular design, implementing tests, and preserving the stable hardware behavior.
What’s next
The next phase is to expand I-EDGE with equipment identifiers, searchable inspection history, exportable PDF reports, calibrated radiometric sensors, and deployable inspection profiles for additional industrial environments.
I-EDGE’s goal is simple: turn live edge perception into documented, operator-ready evidence.

Log in or sign up for Devpost to join the conversation.