-
-
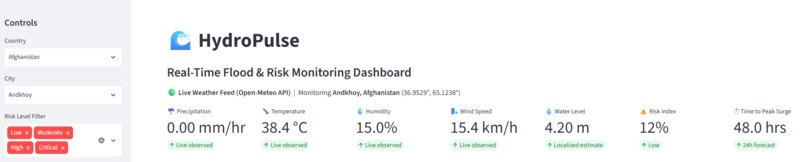
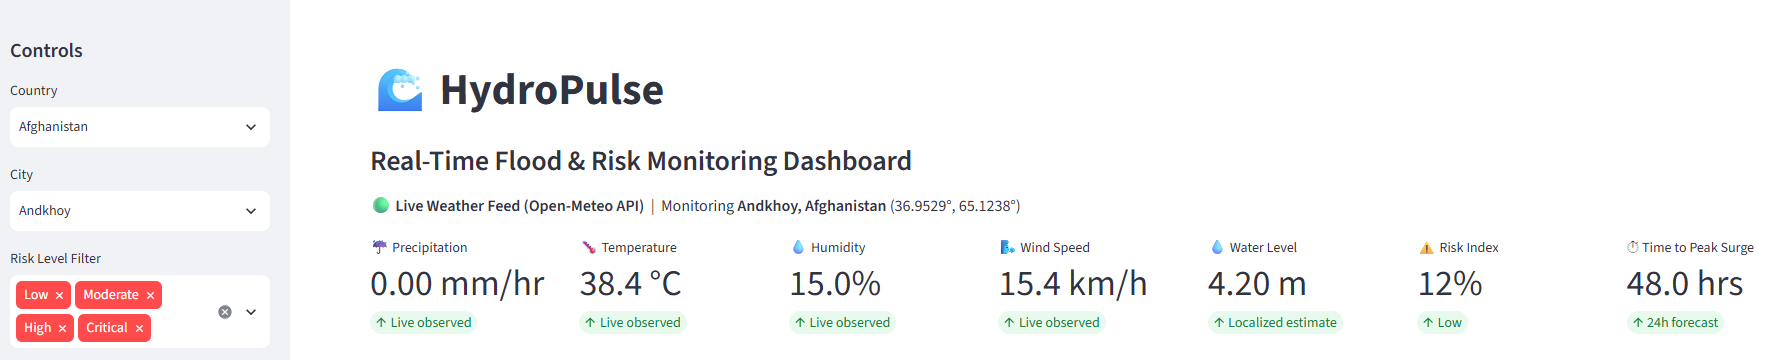
Main dashboard showing live weather feeds, metrics, and risk scores pulled straight from the API.
-

Alert system breaking down risk tiers from low to critical.
-
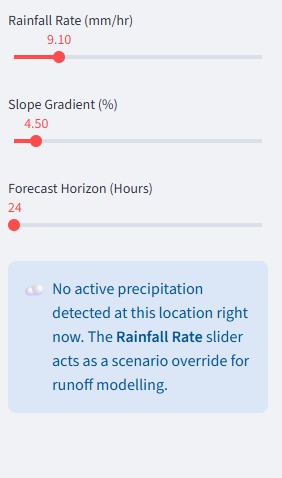
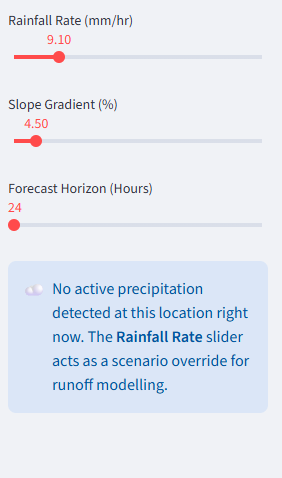
Control panel where you can manually adjust rainfall rates and forecast windows to test different scenarios.
-
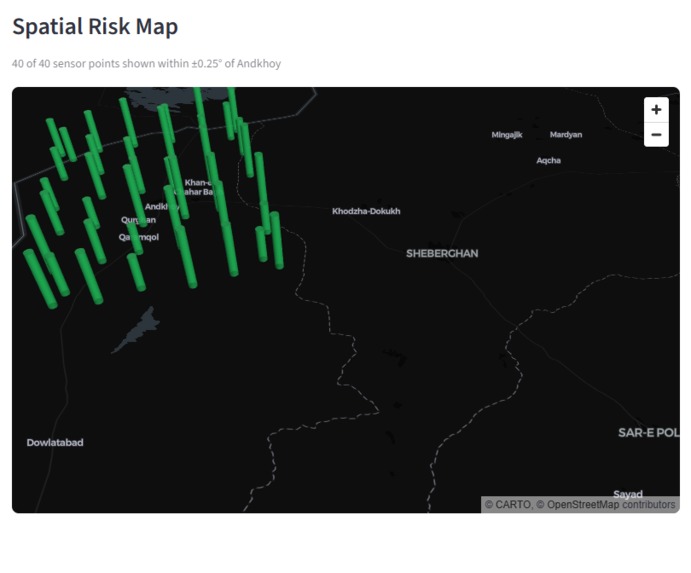
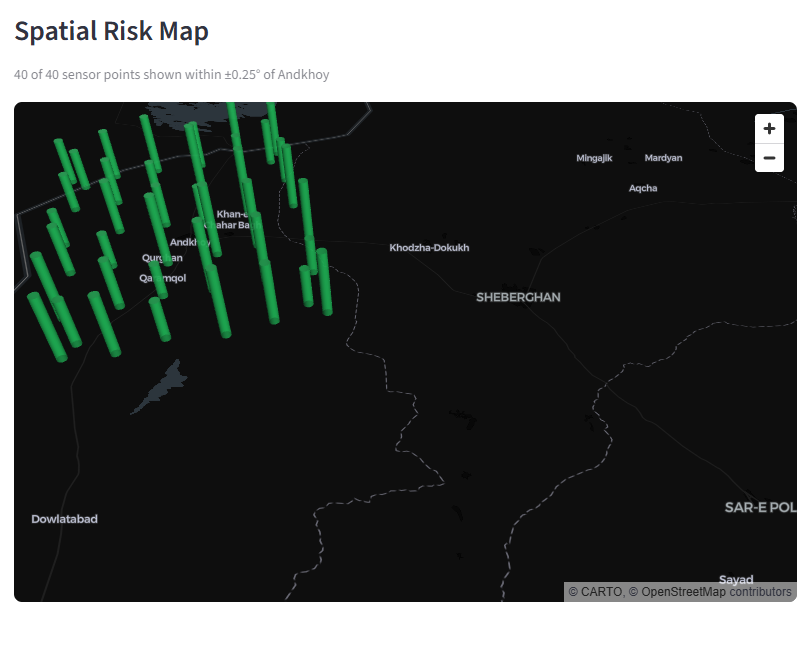
Map view displaying surrounding sensor points and regional geography around the selected city.
-
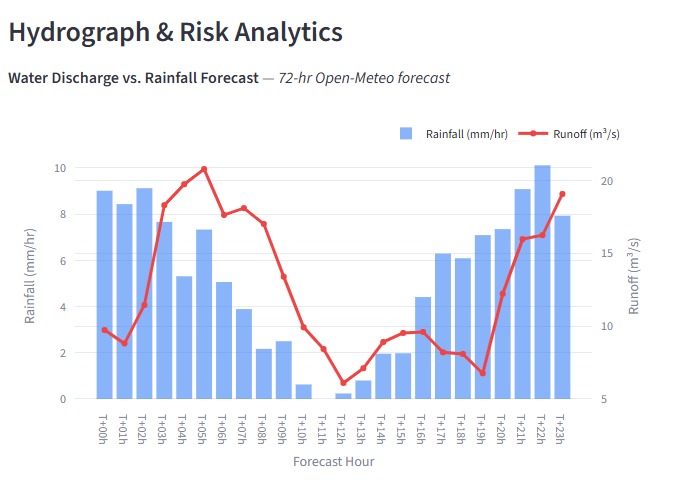
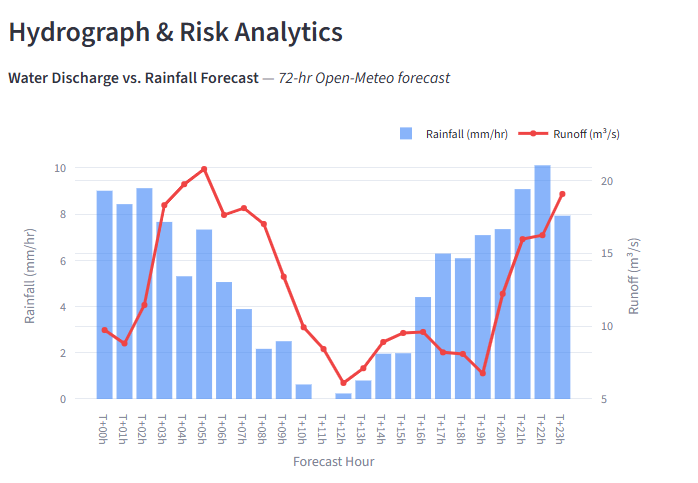
72-hour forecast chart tracking rainfall against projected water runoff.
-
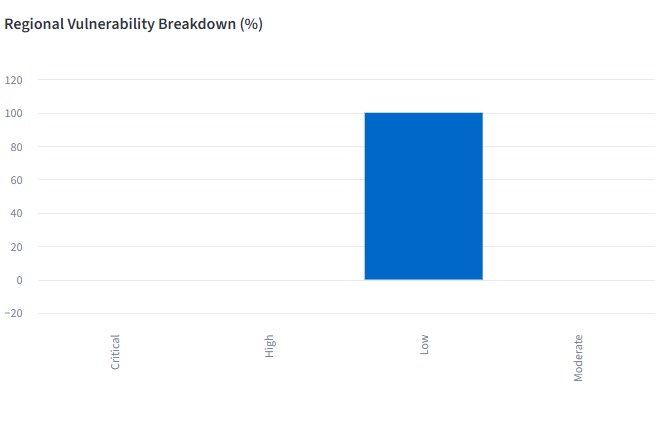
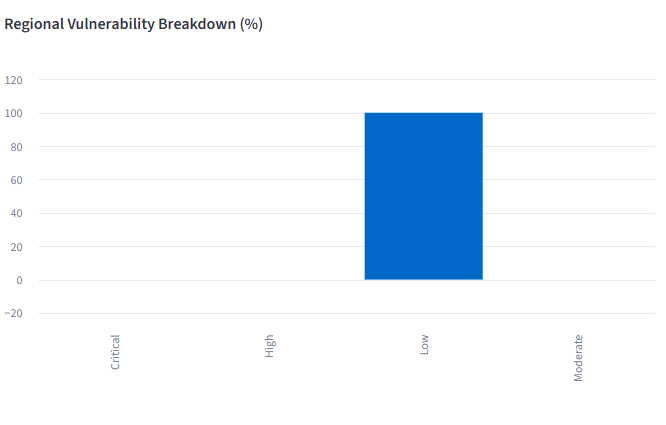
Regional breakdown showing the percentage of vulnerability across the area.
-
Export button to download the forecast and dataset.

Inspiration
Flooding hits fast, and when it does, ordinary people usually find out way too late. All the weather data to predict it is actually out there for free, but it's hidden behind confusing technical APIs, spreadsheets, and complex forecast models. I wanted to build something simple and direct that anyone could look at, type in their city, and immediately understand whether they need to worry about water rising in their area over the next few hours.
What it does
HydroPulse is an interactive web dashboard that turns live weather data into a clear flood risk score. You type in any location, and the app fetches real-time rain and soil data to show:
- A color-coded risk meter (Low, Moderate, High, Severe).
- Hourly precipitation trends and predicted rainfall spikes.
- Ground saturation indicators that show how much rain the soil can actually absorb.
- An interactive map showing weather conditions around the target area.
How I built it
I built the entire application using Python:
- Data Sources: I integrated the free Open-Meteo API to pull live hourly rain levels, soil moisture levels, and temperature data without needing expensive proprietary API keys.
- Backend: Used FastAPI and standard Python data handling tools to aggregate the numbers and calculate custom risk threshold scores.
- Frontend: Built the user interface with Streamlit, using Plotly for clean charts and map visualizers so the data looks good on any browser.
Challenges I ran into
The main headache was figuring out how to score flood risk accurately. Rain volume alone isn't enough—if it rains hard on dry ground, it behaves differently than moderate rain on ground that's already soaked. Getting the math right to weigh soil moisture alongside incoming hourly rainfall took a lot of manual testing and tweaking. I also had to optimize how the app talks to the Open-Meteo API so the charts don't freeze while loading live coordinates.
Accomplishments that I'm proud of
I managed to build and deploy a completely free real-time flood monitoring tool that parses global coordinates, calculates risk scores, and displays clean, simple visual alerts in under two seconds.
What I learned
I got a lot of practical experience combining live REST APIs with interactive Python tools like Streamlit and Plotly. More importantly, I learned how to clean up raw scientific data into something clean, readable, and useful for regular people.
What's next for HydroPulse
Next, I plan to add automated SMS alerts and community flood reports so people get instant warnings on their phones when local risk levels spike.

Log in or sign up for Devpost to join the conversation.