Inspiration
Water based disasters like floods, hurricanes, and coastal storms often slow down emergency response and put communities at risk. With the "Under the Sea" theme, we wanted to focus on helping people in the areas that need it most by using data to make emergency response faster and smarter.
What it does
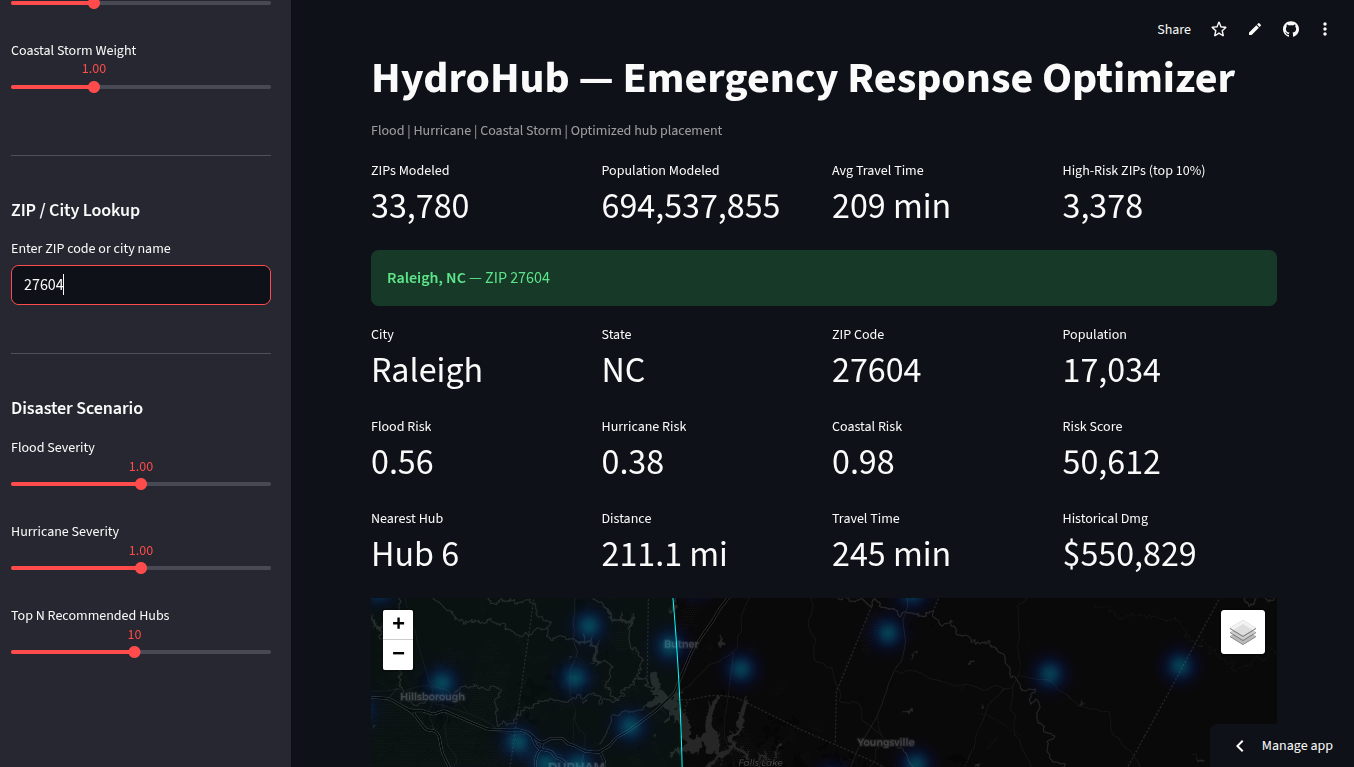
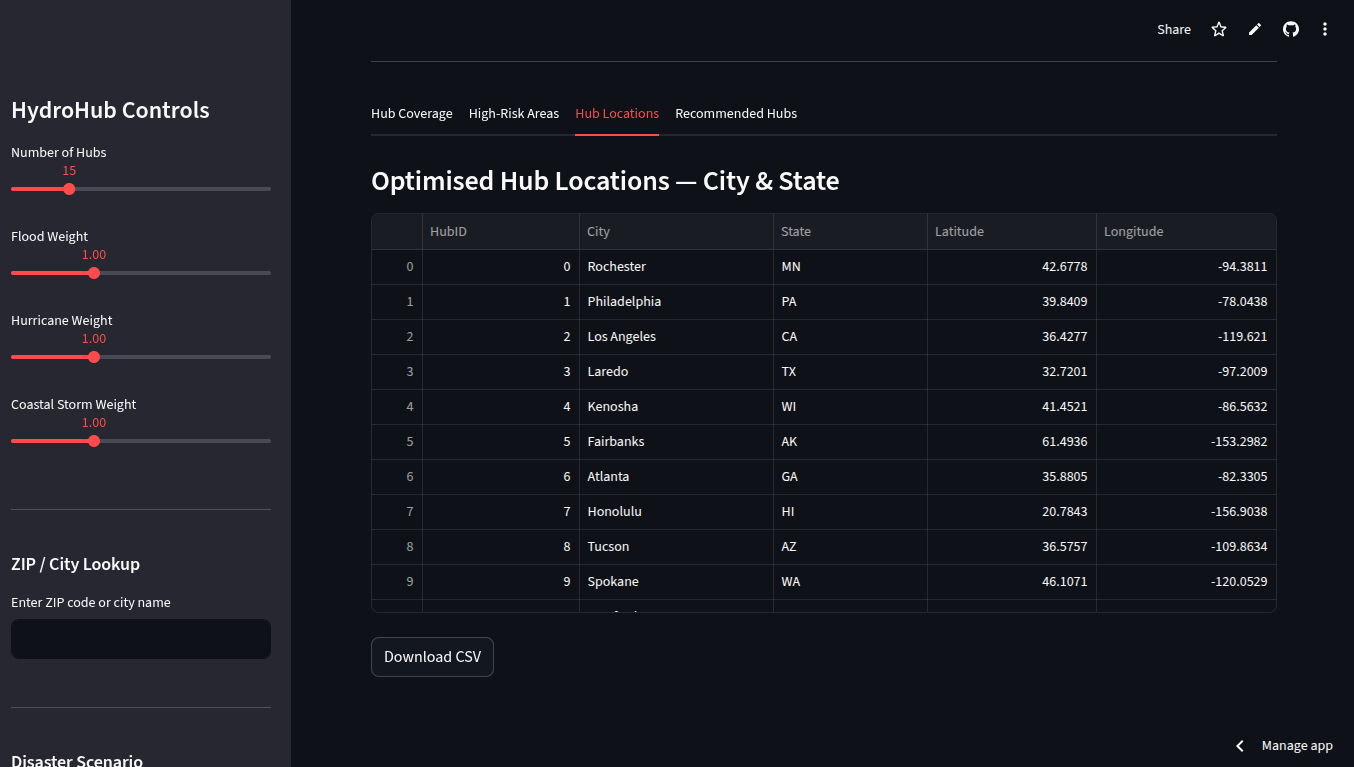
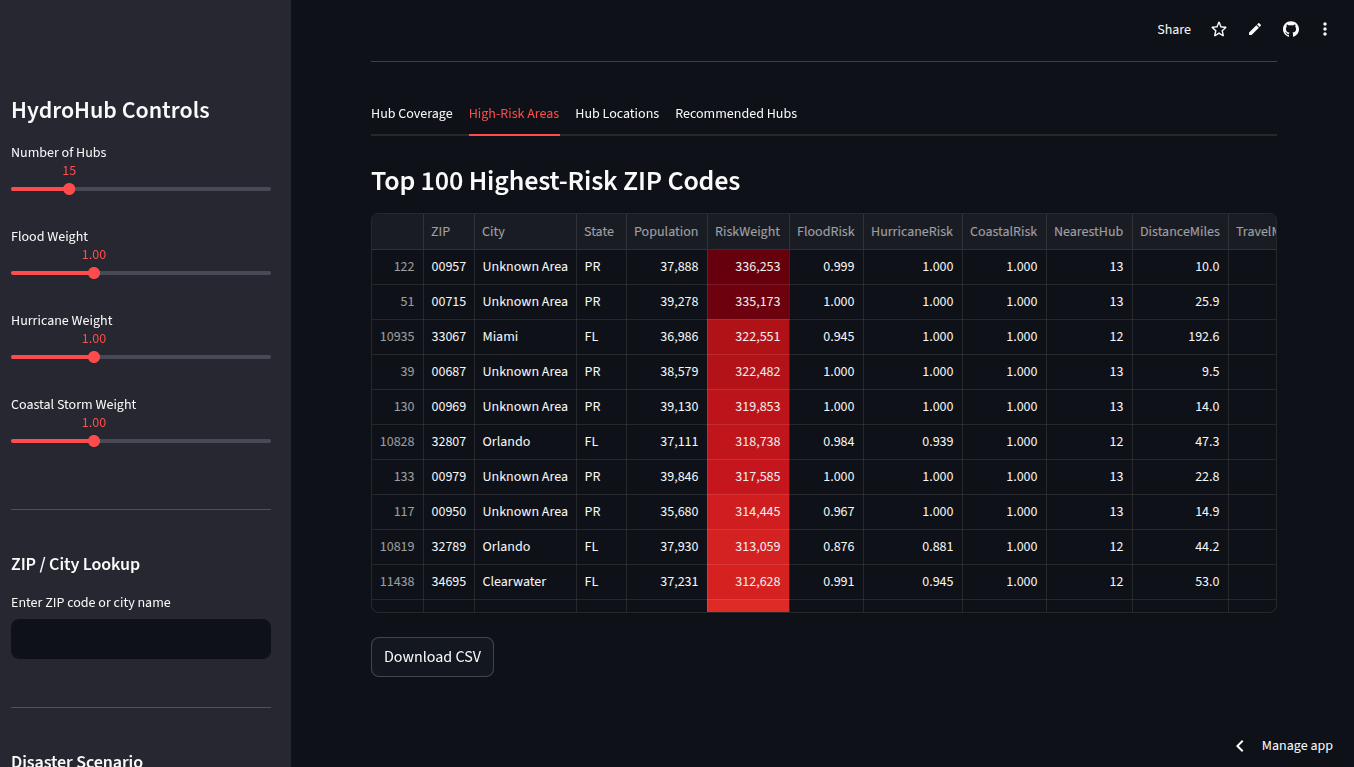
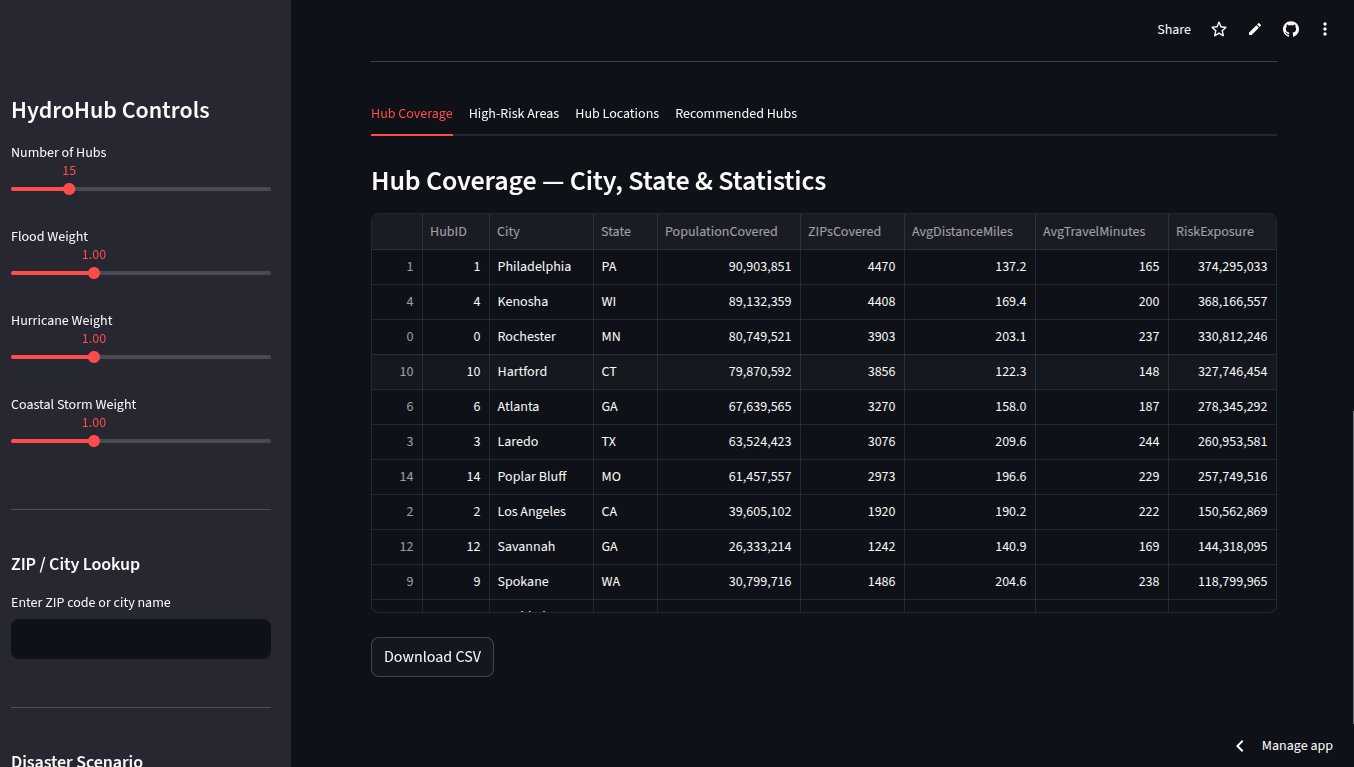
HydroHub is an interactive platform that shows where emergency response hubs should be placed across the U.S. to reach the most people quickly during water related disasters. It maps all ZIP codes with population and disaster risk.
Calculates risk weighted population scores in order to identify high-impact areas.
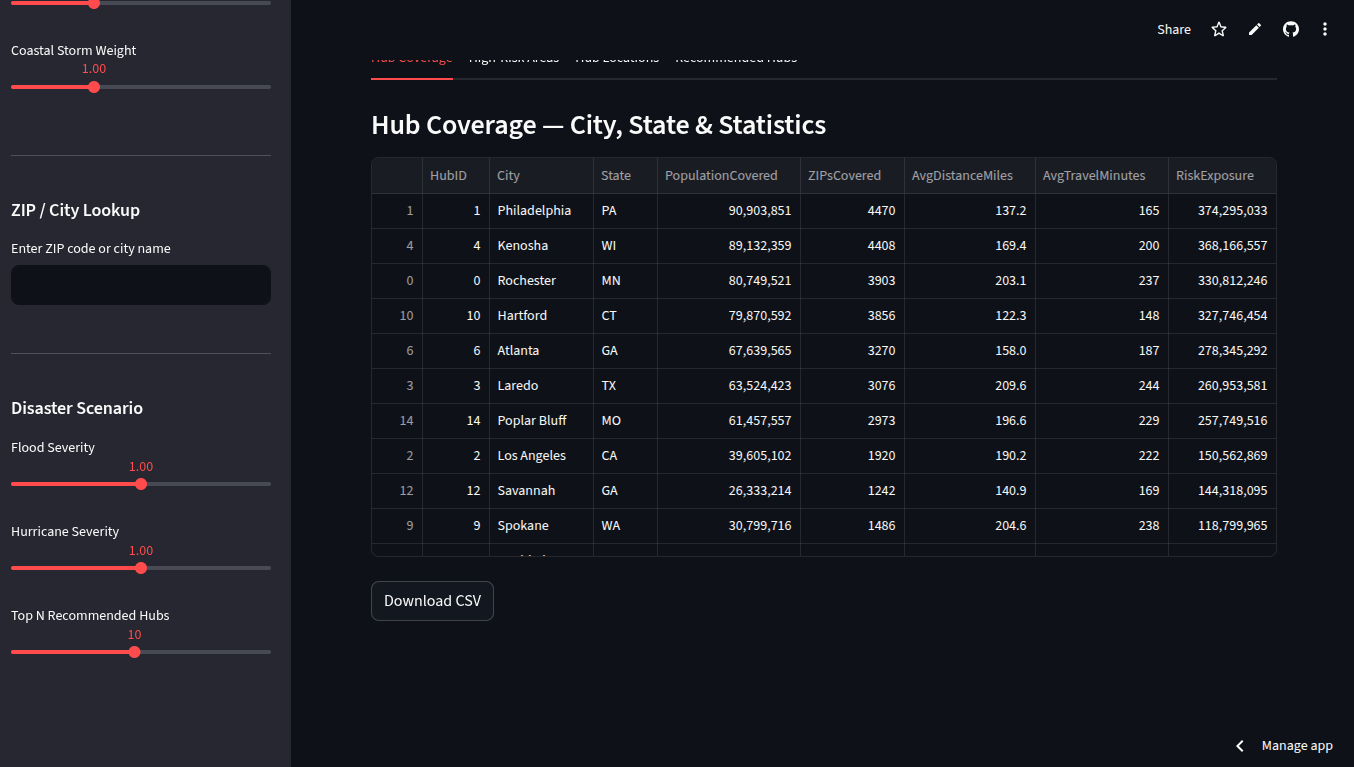
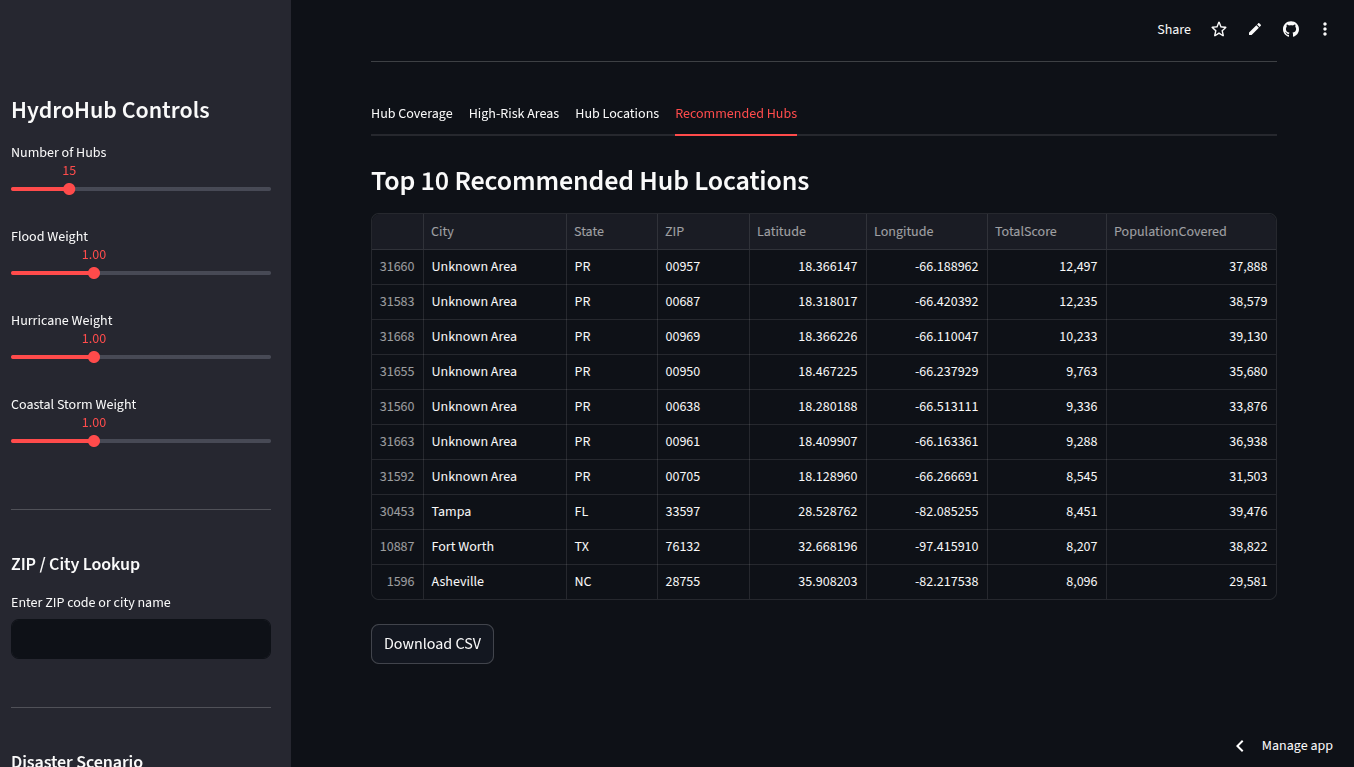
Helps Optimize placement of emergency hubs to minimize travel time to at risk communities.
Assigns each ZIP to its closest hub and estimates distance and response time.
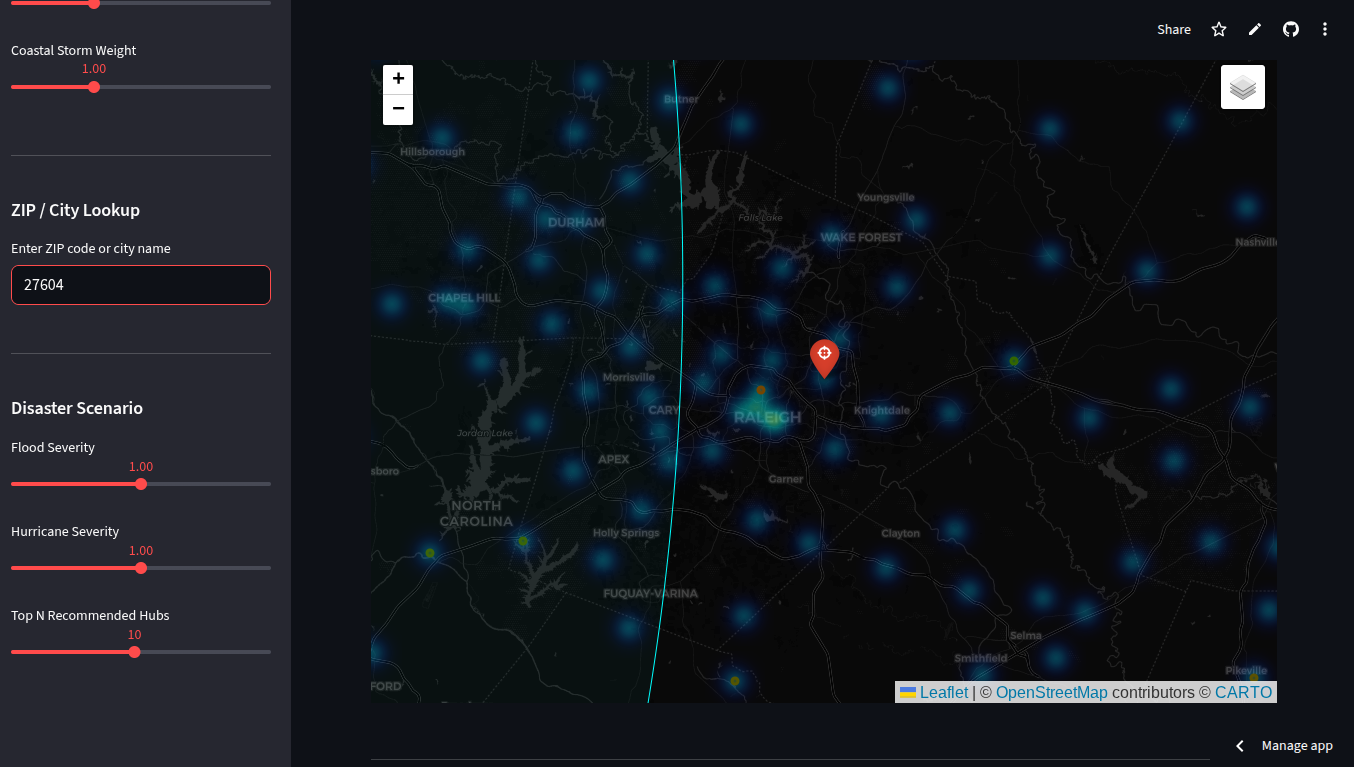
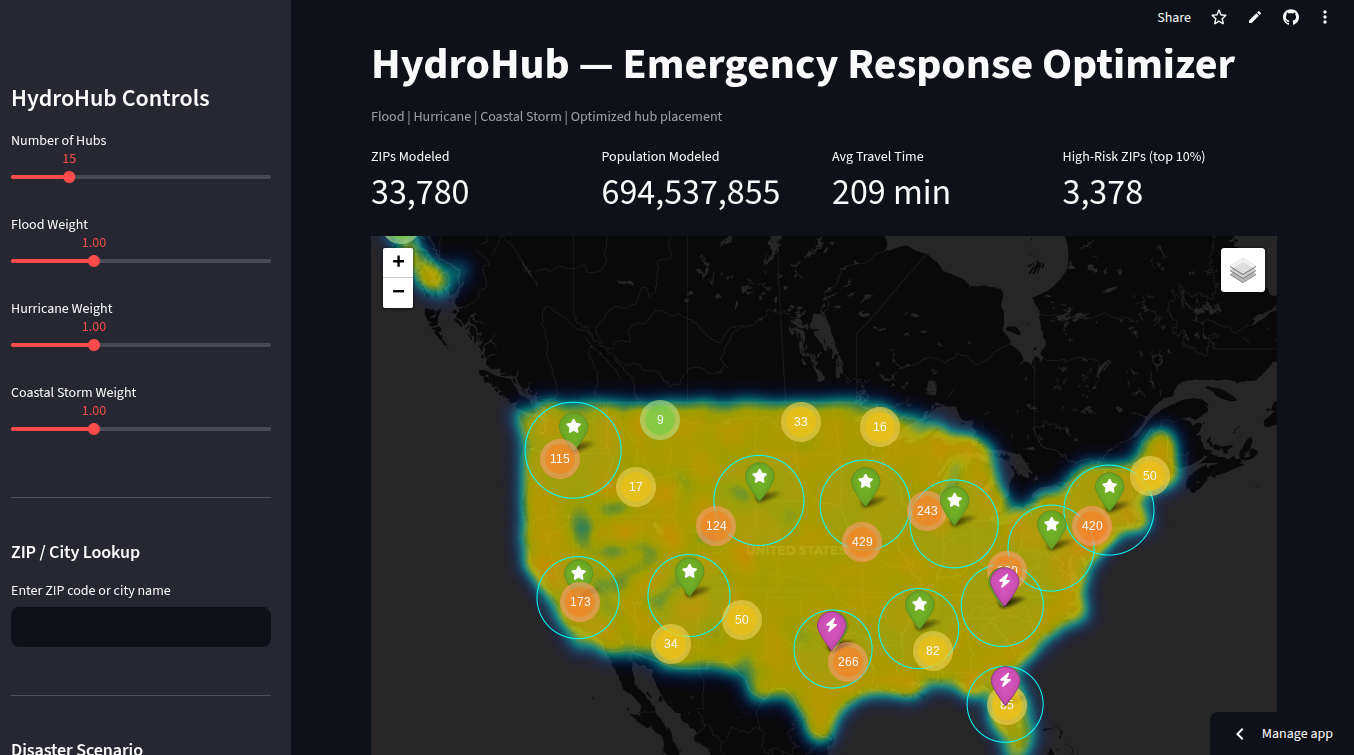
Shows an interactive map with hubs, ZIPs, and risk levels.
Lets users simulate disaster scenarios with sliders for flood, hurricane, and coastal storm risk.
Downloads CSV reports for hub locations, ZIP coverage, and high risk areas.
How we built it
Languages & tools: Python, Streamlit, Pandas, NumPy, scikit learn, Folium
Data sources: FEMA National Risk Index, NOAA Storm Events, SimpleMaps US ZIP Codes, U.S. Census population data
Techniques we used:
Weighted KMeans for hub optimization
Vectorized calculations for population-weighted risk
Distance based assignment of ZIPs to hubs
Interactive Folium maps with heatmaps, markers, and dynamic updates
Used Chatgpt in order to aid coding.
Challenges we ran into
Processing 40,000+ ZIP codes in real-time without slowing down the map.
Merging multiple datasets (ZIPs, counties, FEMA risk, historical damage) accurately.
Making the map interactive and easy to use while showing hubs, high-risk areas, and selected ZIPs.
Keeping calculations fast enough to simulate different disaster scenarios dynamically.
Getting a team together and delegating tasks.
Accomplishments that we're proud of
Built a full U.S scale tool for emergency response planning with real data.
Integrated risk weighted ZIP assignments and hub optimization.
Created interactive, water themed visualizations that show risk and coverage clearly.
Added ZIP lookup and highlighting so any community can be checked instantly.
What we learned
How to handle large geospatial datasets efficiently.
How to combine optimization, risk modeling, and interactive visualization in one platform.
Found ways to make real time calculations work for thousands of points.
How to quickly turn data science ideas into a hackathon ready prototype.
What's next for HydroHub
Add real FEMA flood zones for more accurate risk modeling.
Use actual road networks instead of straight line distances in order too estimate travel times.
Add animated disaster simulations for floods and hurricanes.
Use machine learning to predict which areas will be most at risk.
Incorporate live disaster alerts so emergency planners can react in real time.
Built With
- chatgpt
- folium
- folium-apis/data:-fema-national-risk-index
- languages/frameworks:-python
- matplotlib
- noaa-storm-events
- numpy
- pandas
- scikit-learn
- scipy
- simplemaps-us-zip-codes
- streamlit
- streamlit-cloud
- us-census-data-tools:-github


Log in or sign up for Devpost to join the conversation.