-
-
Logo
-
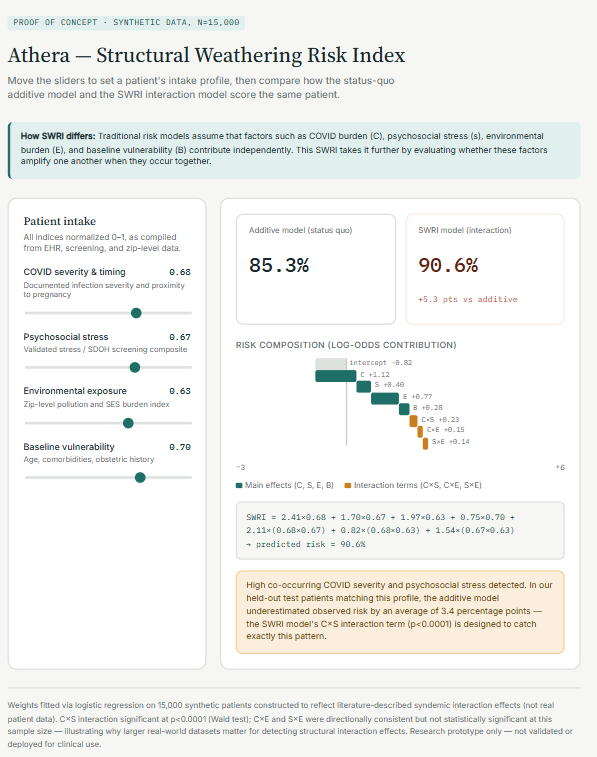
Website Demo Image
-
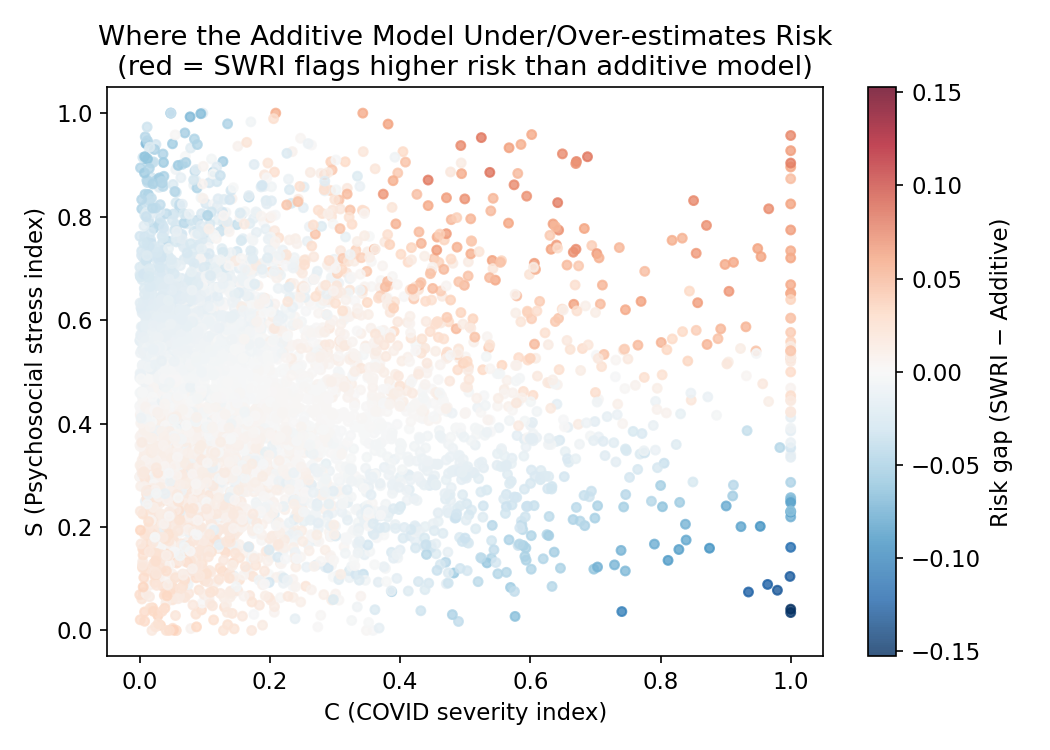
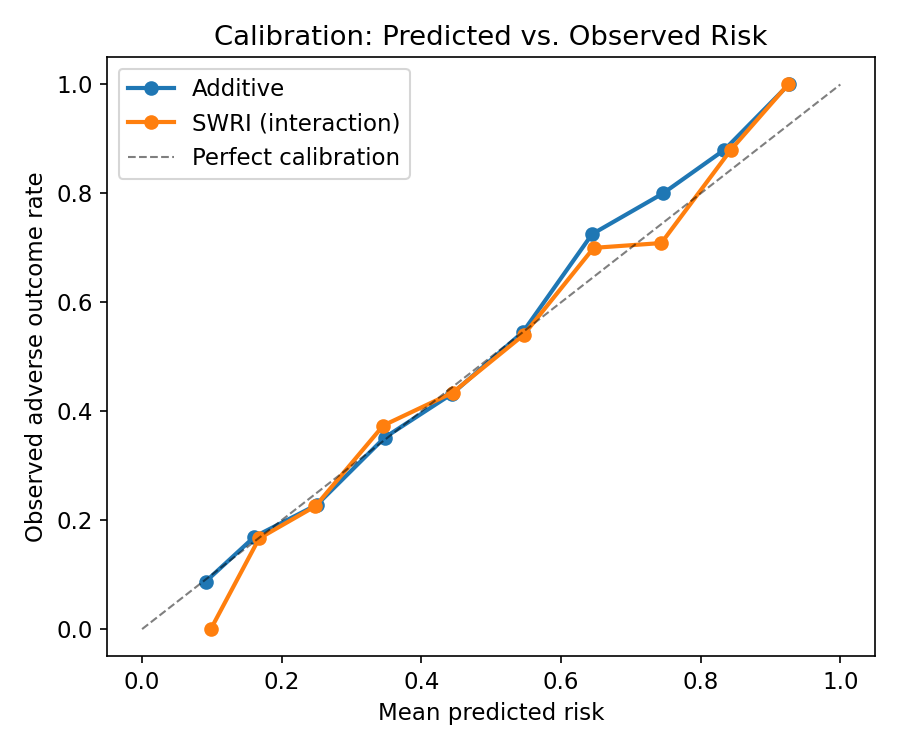
Where the Additive Model Under/Over-estimates Risk
-
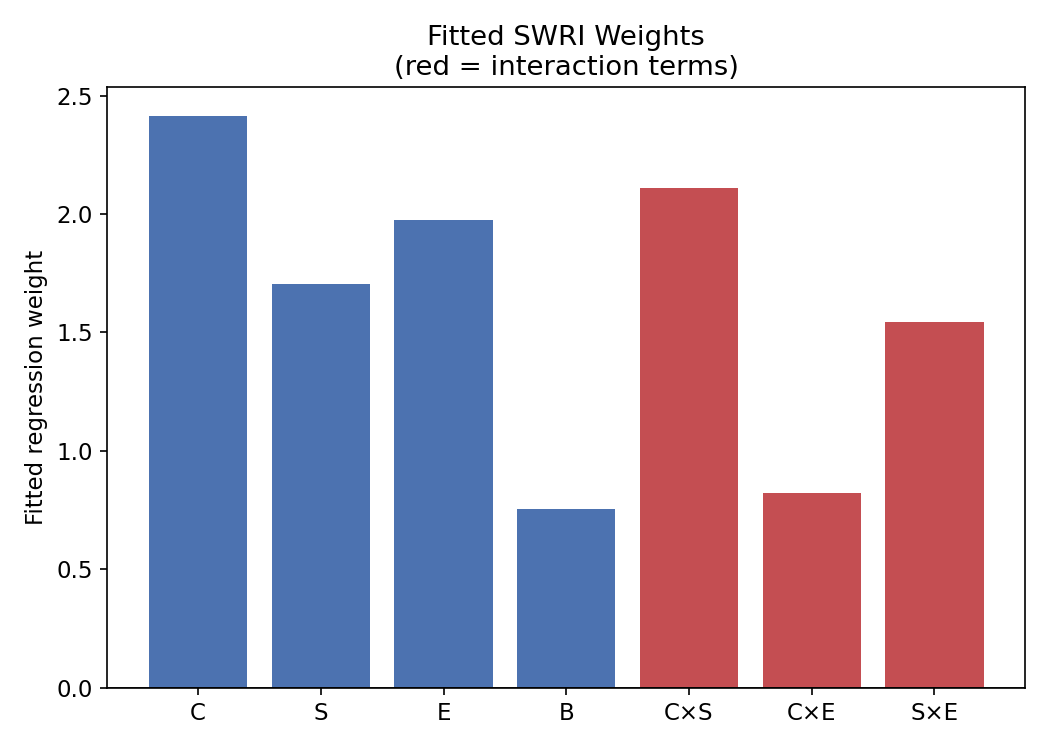
Fitted SWRI Rates
-
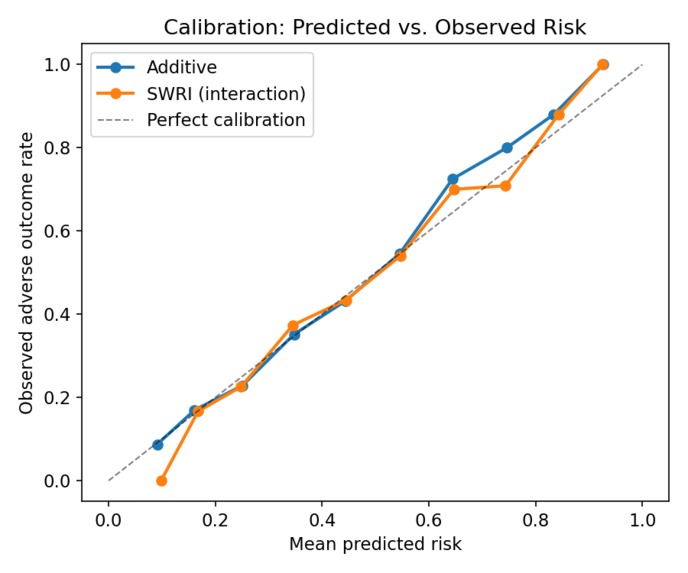
Calibration: Predicted vs. Observed Risk
Inspiration
I was originally inspired to create Athera due to a gap in how Long-COVID was diagnosed and treated, especially in relation to maternal health. When I heard that approximately 1 in 10 women who had experienced COVID later on developed Long-COVID, I felt motivated to develop something that could help. In my case, this especially hit close to home as Long-COVID is one of the things thought to have contributed to my development of chronic migraines, as well as my experience seeing family members suffer for extended periods of time with Long-COVID. To me, it's much more than code: it's a possibility of impacting lives beyond what was previously available.
What it does
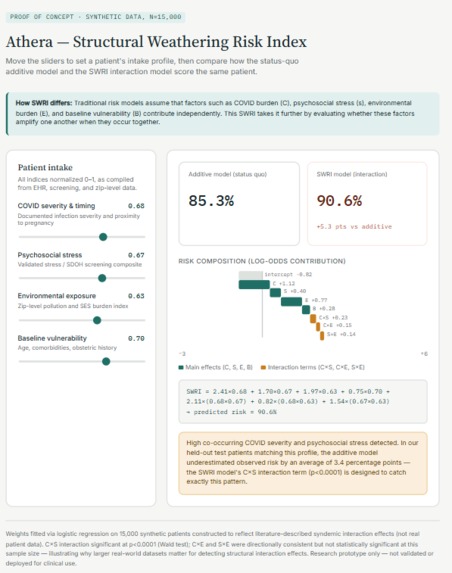
Using a combination of factors such as documented COVID infection severity & timing, validated psychosocial stress index, environmental stress/exposure (such as zip-level pollution, SES index, etc.), and baseline biological vulnerability/risk factors (such as age, comorbidities, and obstetric history), Athera produces a score that is used to flag high-risk pregnancies that standard medical systems miss.
How we built it
Before coding Athera, I used Google Docs to map out my idea, conduct background research on the problem, and write down a basic execution plan/mathematics/logic for the model. Then, I used Canva's design feature to create graphs about the kind of media used during the research, as well as to create an initial, basic model of my idea. Once I felt ready enough to start coding, I built Athera using Codepen to run my code and ensure that the synthetic data I used was simulated as I wanted. For now, I used an HTML base to create a cohesive image in the actual website, and synthesized data for ~15,000 "patients" that was organized in Excel. Furthermore, JSON was used to interact with the HTML and ensure everything ran smoothly (although it's important to note that the HTML alone is what gives the imagery).
Challenges we ran into
While developing the idea for Athera, challenges included determining the specific mathematical model, deciding what would and would not be factored into the calculations for the Structural Weathering Risk Index, and using both code and mathematics to build something real. Although these factors had me confused at first, they are also big parts of what made the final version as clear/interactive as it is; they weren't unnecessary challenges, but things worth paying a lot of attention to. In doing this, it also helped me properly develop my skills in creation, something that makes me a lot more confident in my ability to have a vision and create something tangible with it.
Accomplishments that we're proud of
I am incredibly proud of how everything has come together, especially considering this was my first major coding project outside of school. Before starting this project, I was not confident in my mathematical or coding abilities, but through hard work, perseverance, and grit, I used the resources available to me to turn my idea into reality.
What we learned
While conducting research to properly understand Long-COVID's effects on maternal health, developing my coding skills to create an interactive demo, and putting together the mathematics and action plan for Athera, I gained valuable skills in organization, time management, and research. The process of creating Athera taught me that just because something is unfamiliar or difficult, it doesn't mean that creating it isn't worth it, but that going through the struggle is part of what makes the experience so unique.
What's next for Athera
Next, I will rigorously work on the website demo as well as analyze how it responds to certain changes. This is particularly important as I would like to ensure it is as adaptable as possible, especially since certain things in healthcare are not as clear as we'd like them to be. Additionally, I'd like to make it clearer how things like environmental stress or baseline biological vulnerability scores are calculated for effectiveness, as well as take the site from having a lot of technical terms to using more universally understood ones, implement visual graphs, and more.

Log in or sign up for Devpost to join the conversation.