Inspiration
We were frustrated that cities have incredible energy data but no accessible way to use it for decision making! During late night climate discussions, we realized that while everyone wants their city to go green, nobody knows what that actually looks like locally, should cities prioritize solar or wind? How much would it cost? We discovered ERCOT pumping out live Texas grid data 24/7, but it's buried in technical reports only energy engineers understand. We thought: what if exploring your city's energy future was as easy as checking the weather?
What it does
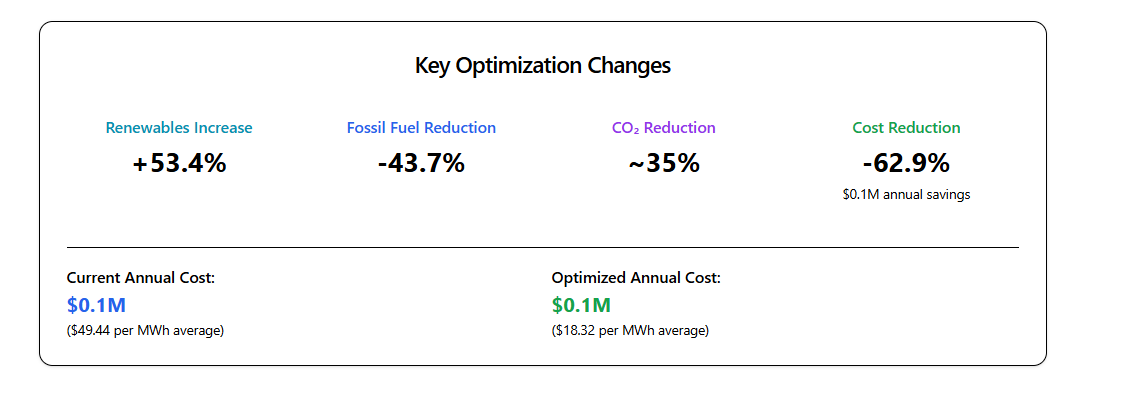
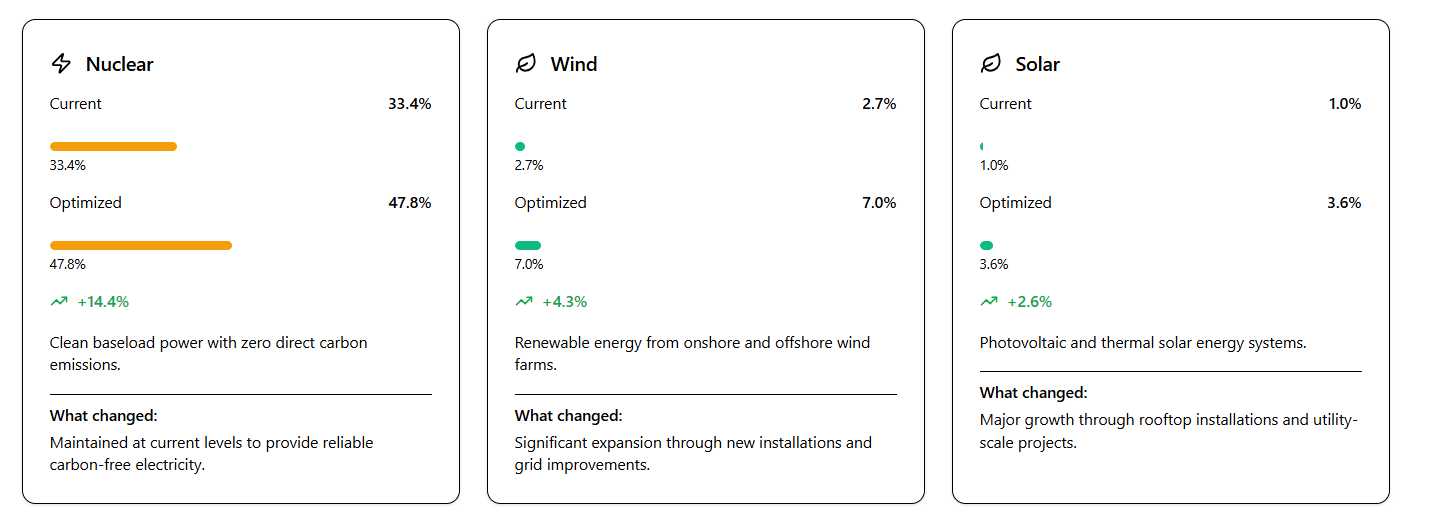
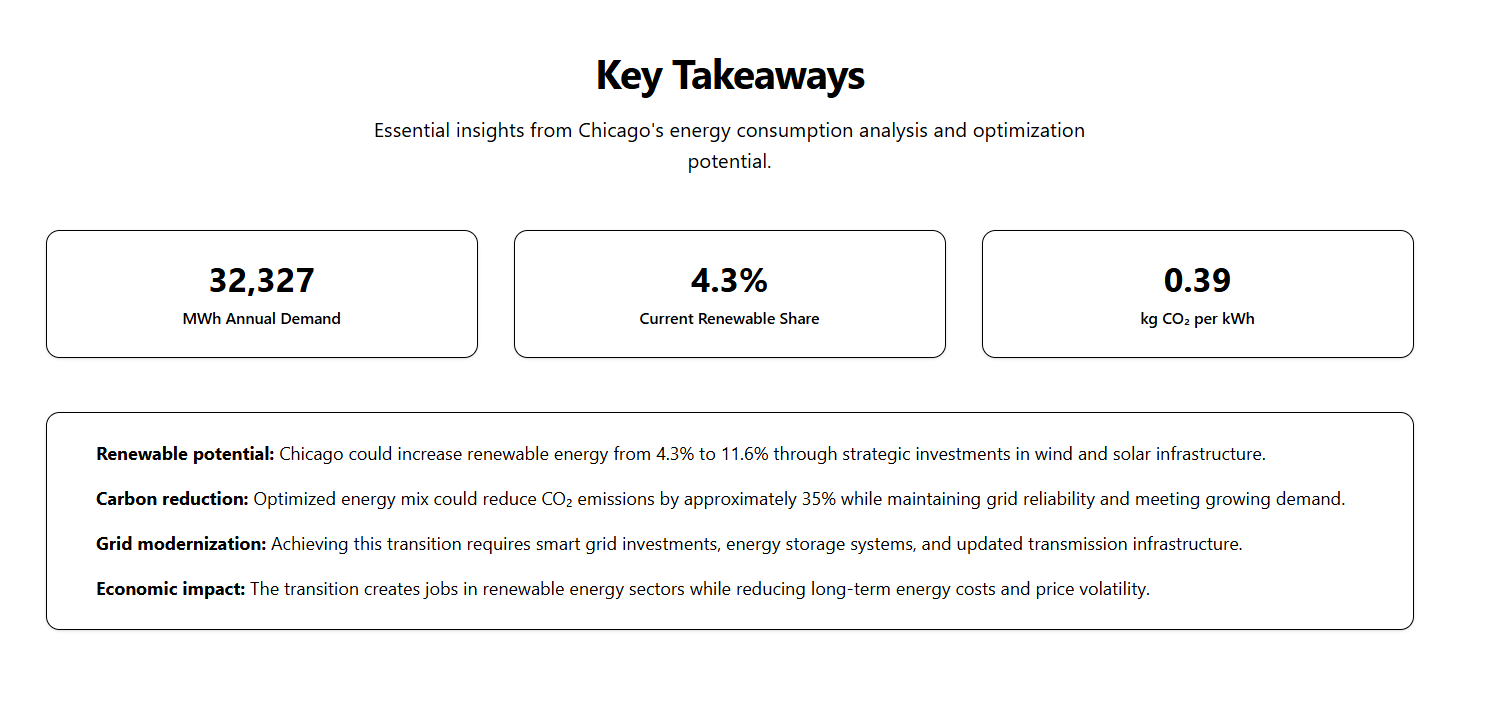
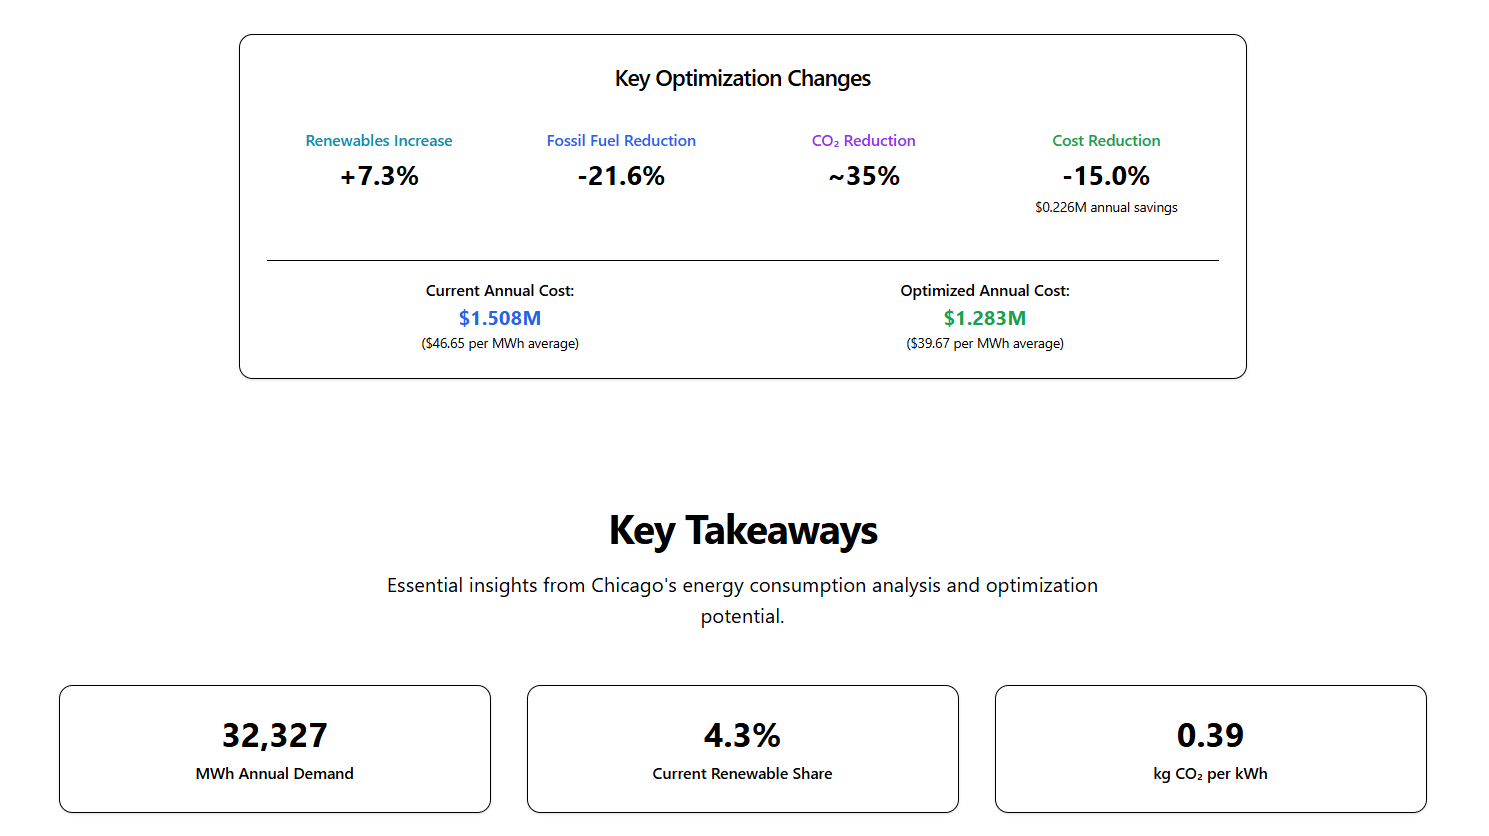
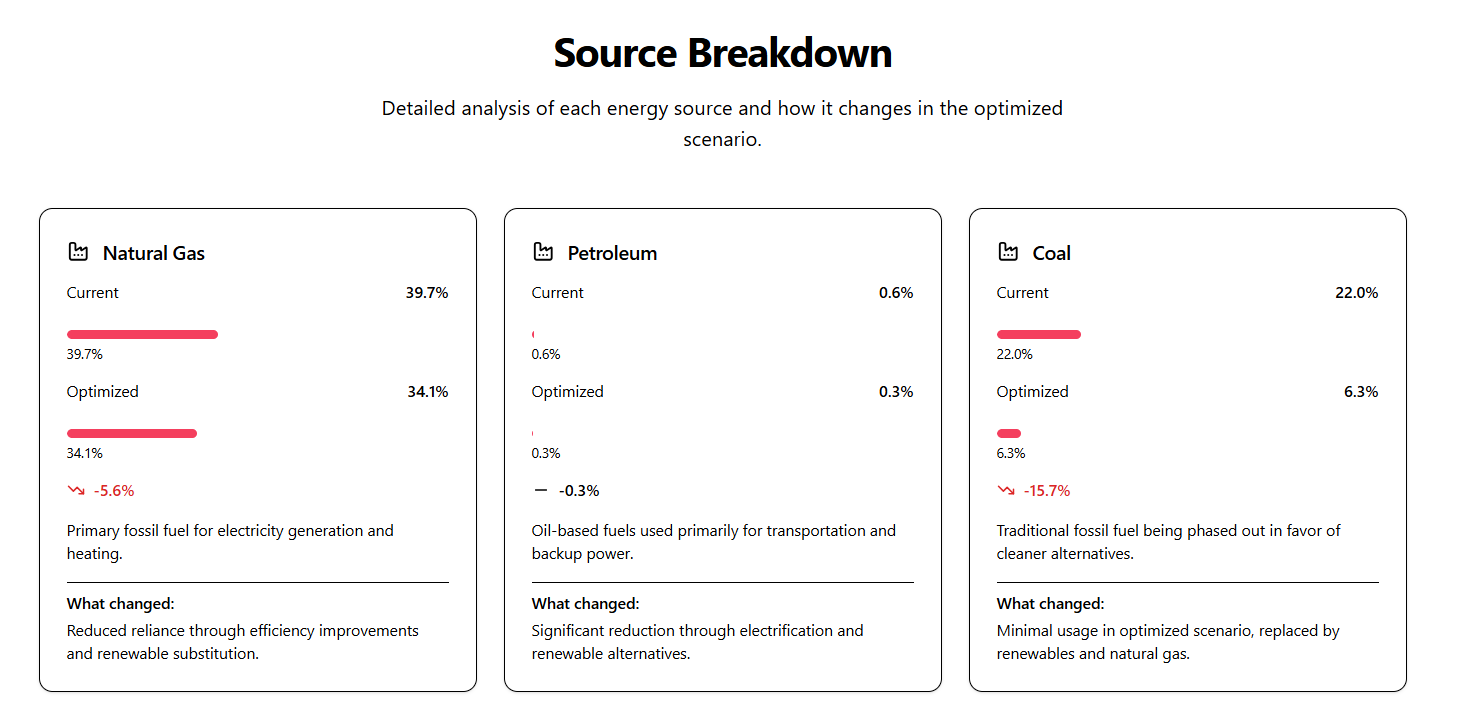
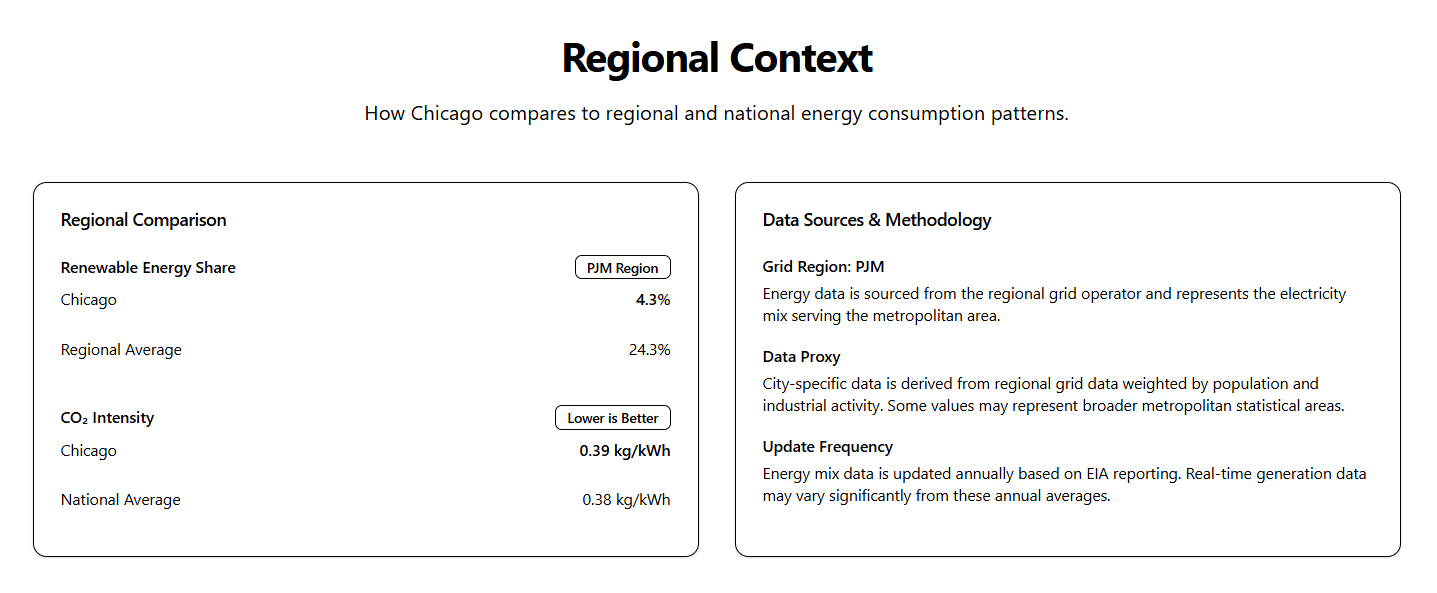
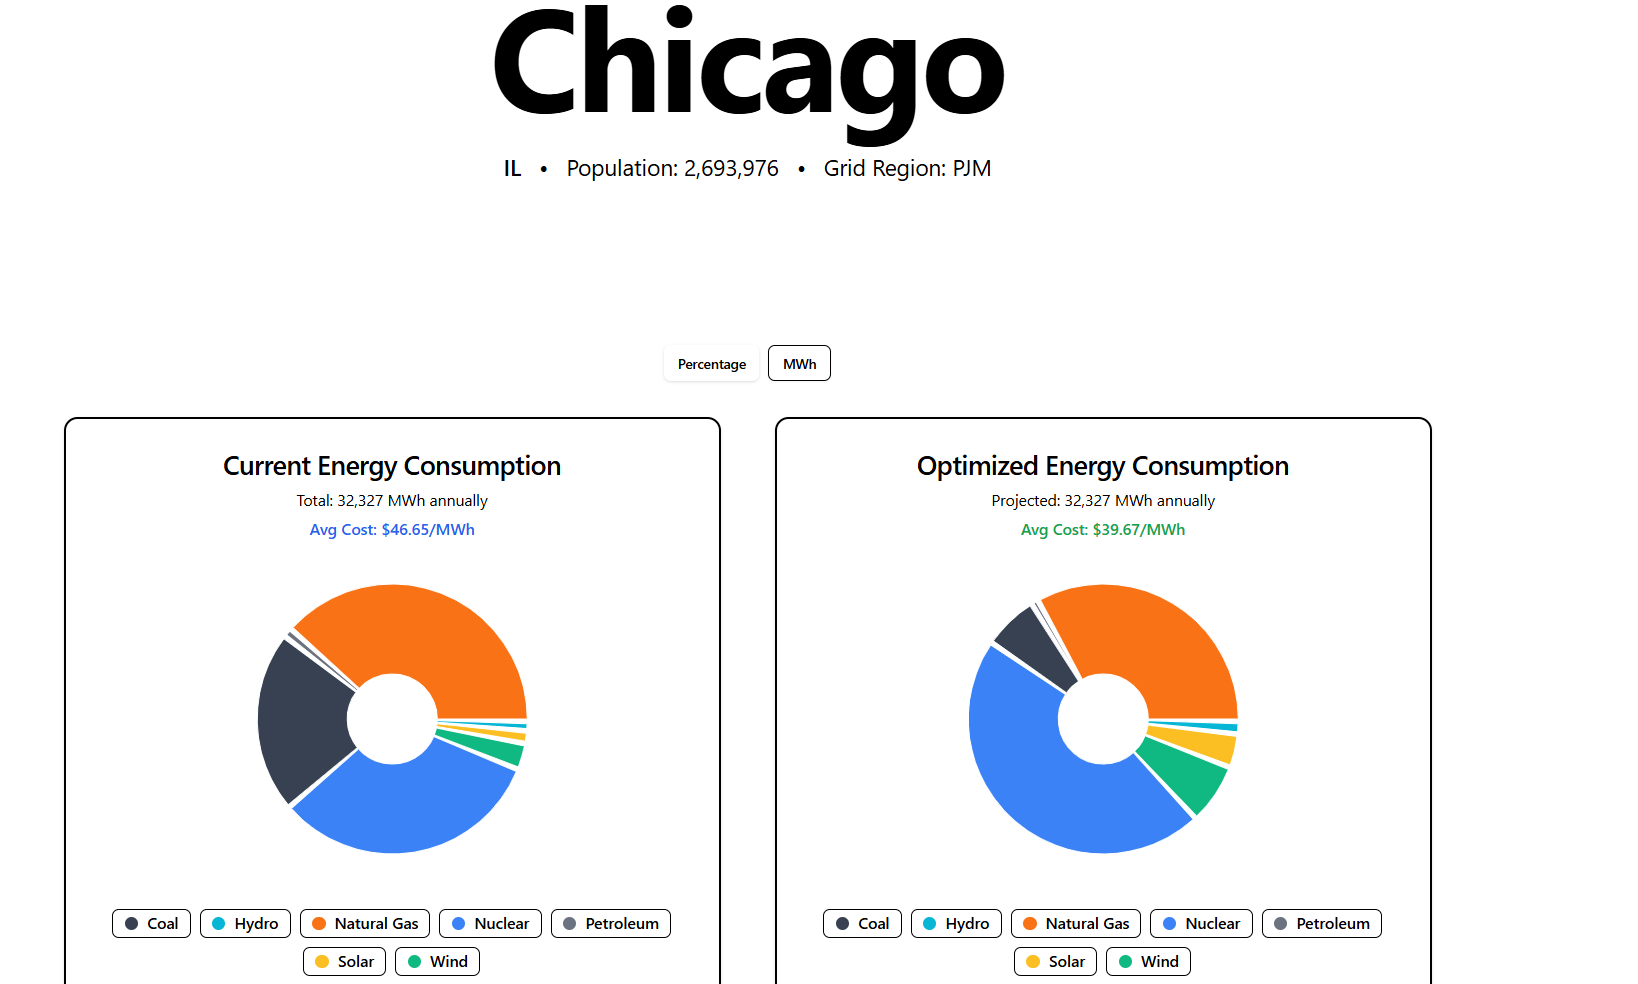
Our platform transforms complex energy data into actionable insights for 50+ US cities. Users can explore their city's current energy mix through interactive visualizations, then see an optimized scenario that balances cost reduction, carbon emissions, and grid reliability. The system shows real time pricing, calculates potential savings, and provides step-by-step implementation pathways. For Texas cities, we use live ERCOT data; for others, we leverage EPA eGRID regional data to create meaningful projections of what sustainable energy transitions could look like.
How we built it
We created a three-layer system: a Python backend connecting directly to ERCOT's API for real-time data, a linear programming optimization engine (using PuLP) that balances multiple objectives while respecting grid constraints, and a responsive Next.js frontend with interactive Recharts visualizations. The optimization algorithm considers real world factors like wind intermittency, baseload requirements, and existing infrastructure limitations to generate feasible scenarios, not just theoretical ideals.
Challenges we ran into
ERCOT's OAuth API required significant data cleaning and normalization. We spent hours figuring out how different energy sources are categorized! Our early optimization models produced unrealistic scenarios (like 100% solar), forcing us to iteratively refine constraints for real-world feasibility. Performance optimization was crucial as we handled live data updates while maintaining responsive interactions. The biggest challenge was translating complex energy engineering into intuitive visualizations that work for both experts and curious citizens.
Accomplishments that we're proud of
We successfully integrated live grid data with sophisticated optimization algorithms and made it accessible through beautiful, responsive interfaces! Our breakthrough moment was realizing that showing economic benefits alongside environmental impact makes renewable transitions compelling, when users see both carbon reduction AND cost savings, the value becomes immediately clear. We're proud that friends with zero energy background could instantly understand their city's optimization potential and get excited about clean energy futures.
What we learned
Energy optimization isn't just about maximizing renewables, it's a delicate balance of reliability, economics, and environmental impact. We discovered that effective data visualization can transform policy discussions and that real time energy markets are incredibly dynamic. The project reinforced our belief that better tools lead to better decisions, and that making complex systems transparent can drive meaningful change in how cities approach sustainability.
What's next for Hybrid Energy Optimizer
We're expanding beyond visualization to become a comprehensive energy planning platform! Next features include integration with more regional grid operators (CAISO, NYISO), AI powered forecasting for seasonal optimization scenarios, policy impact modeling to show how different regulations affect outcomes, and collaboration tools for city planners and energy consultants. We're also exploring partnerships with municipal governments and utilities to pilot real implementation projects based on our optimization recommendations.


Log in or sign up for Devpost to join the conversation.