-
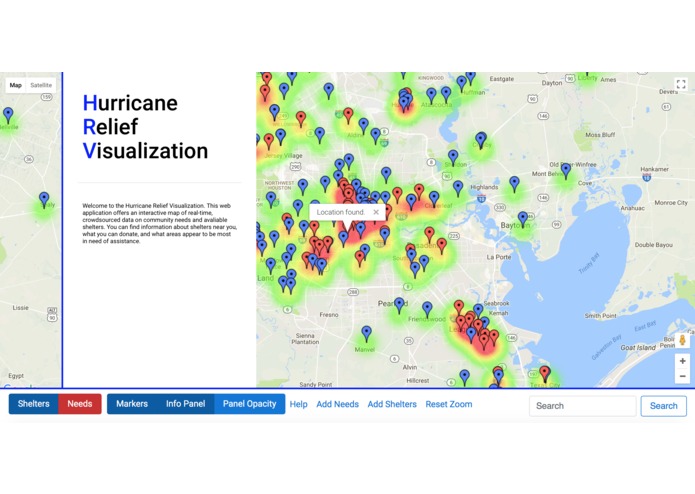
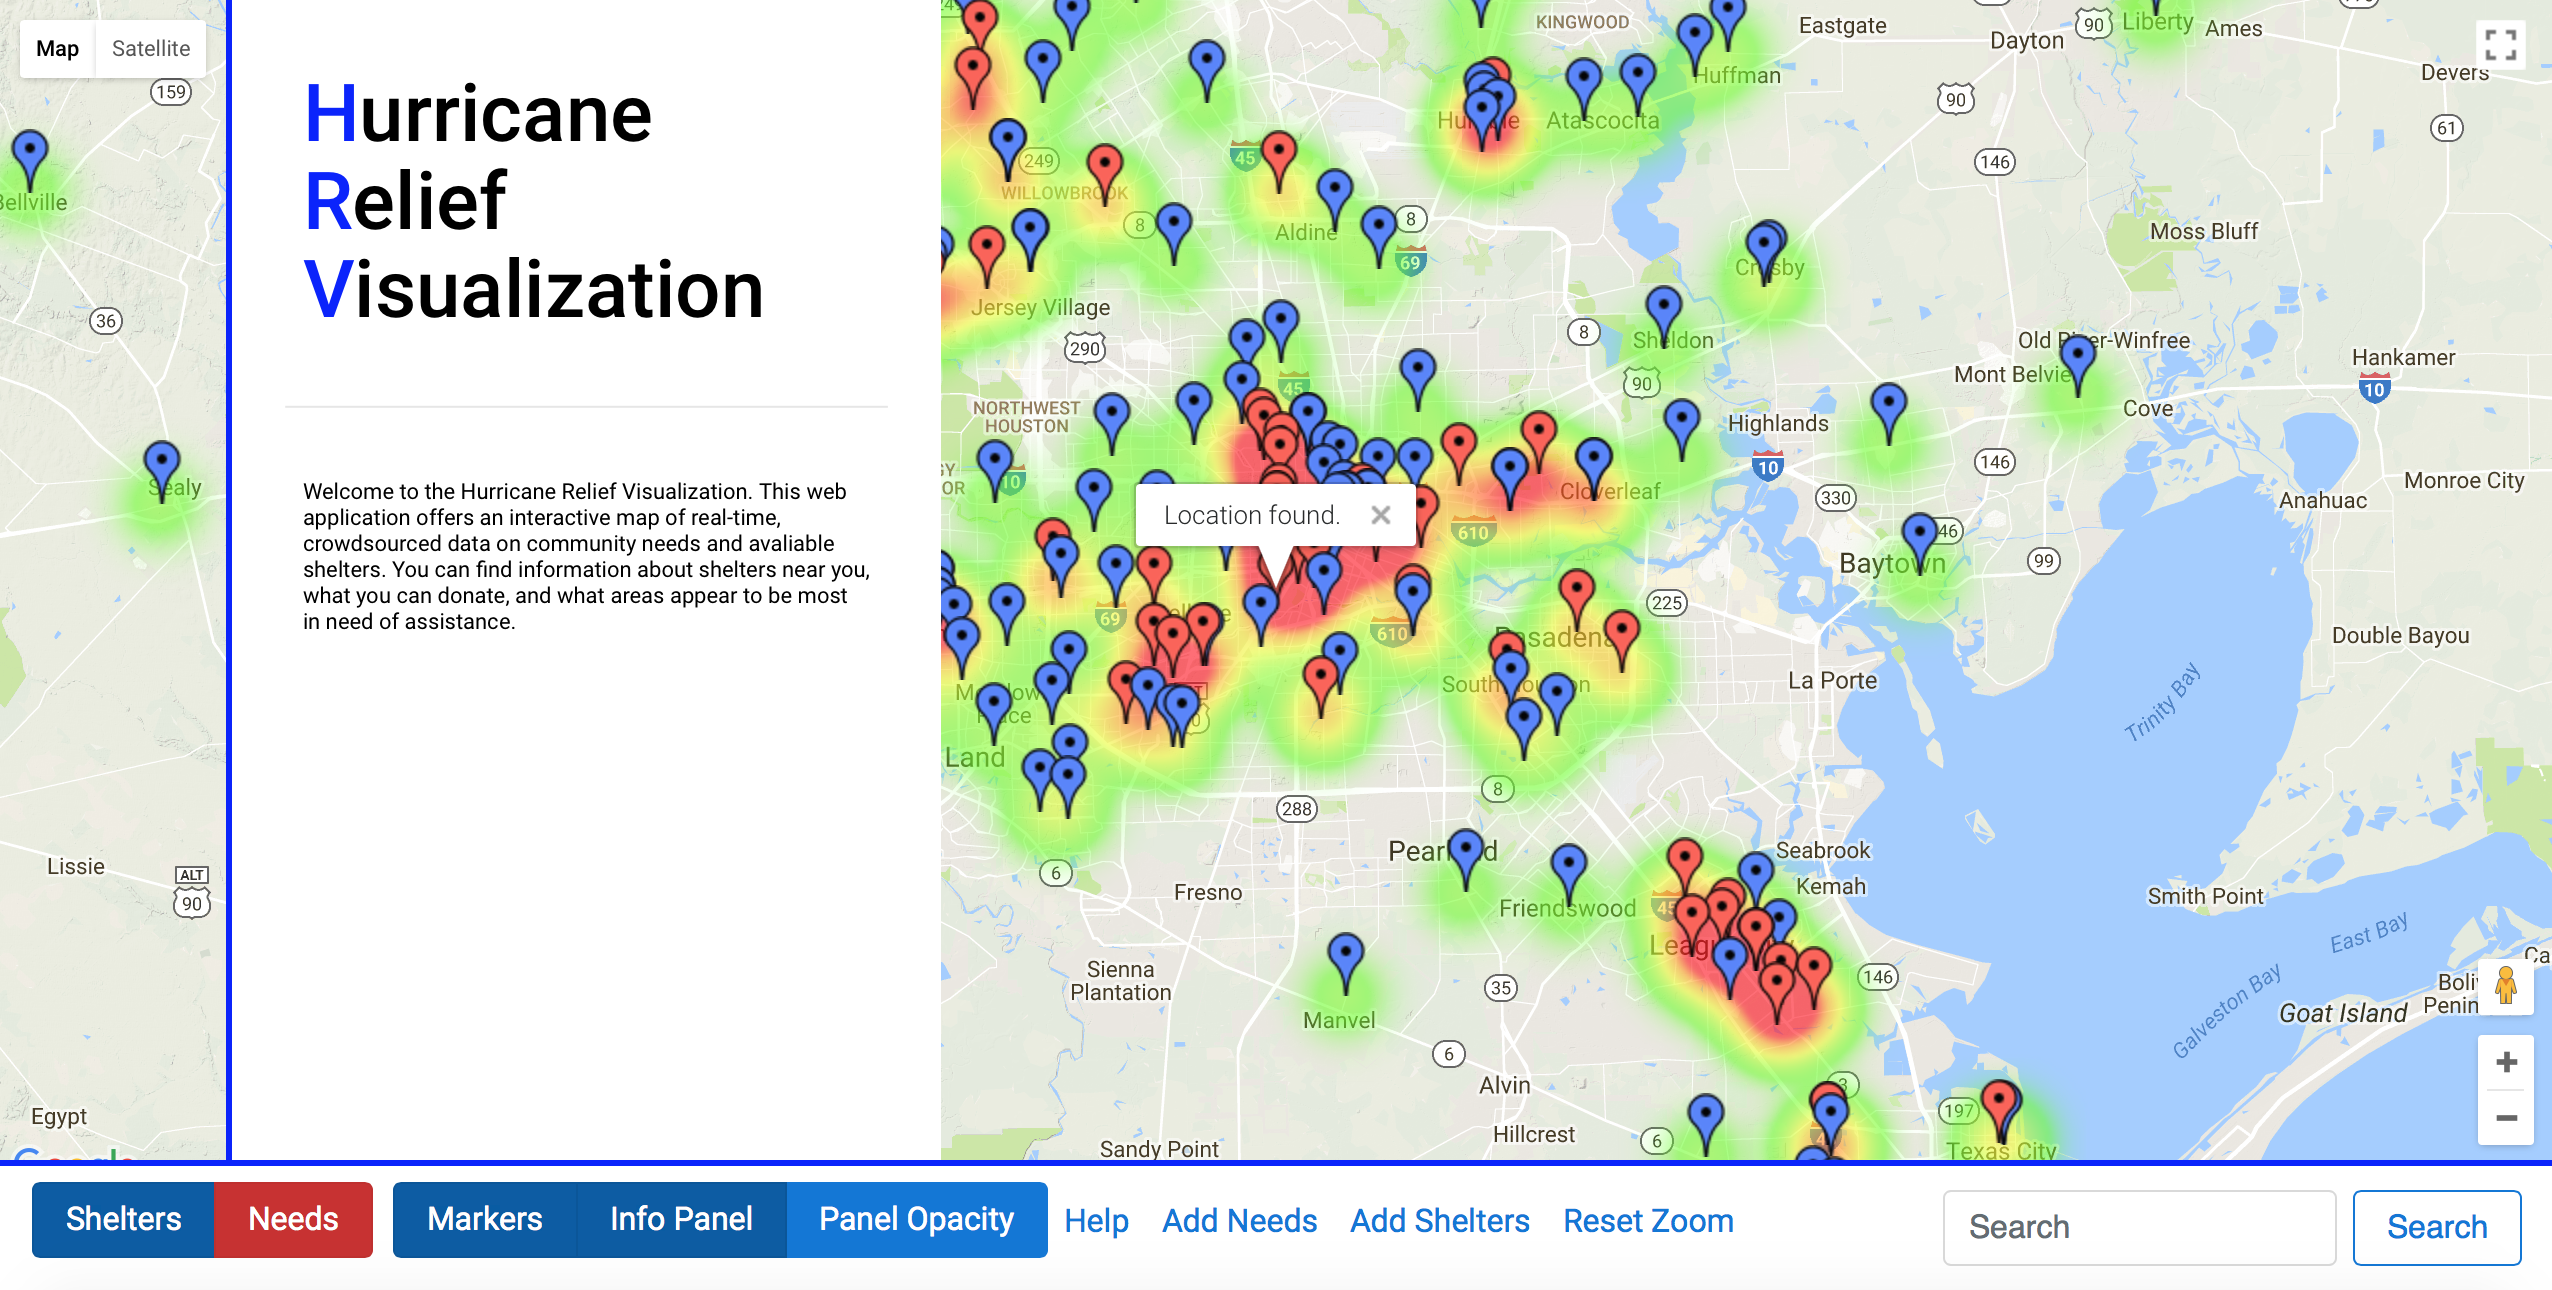
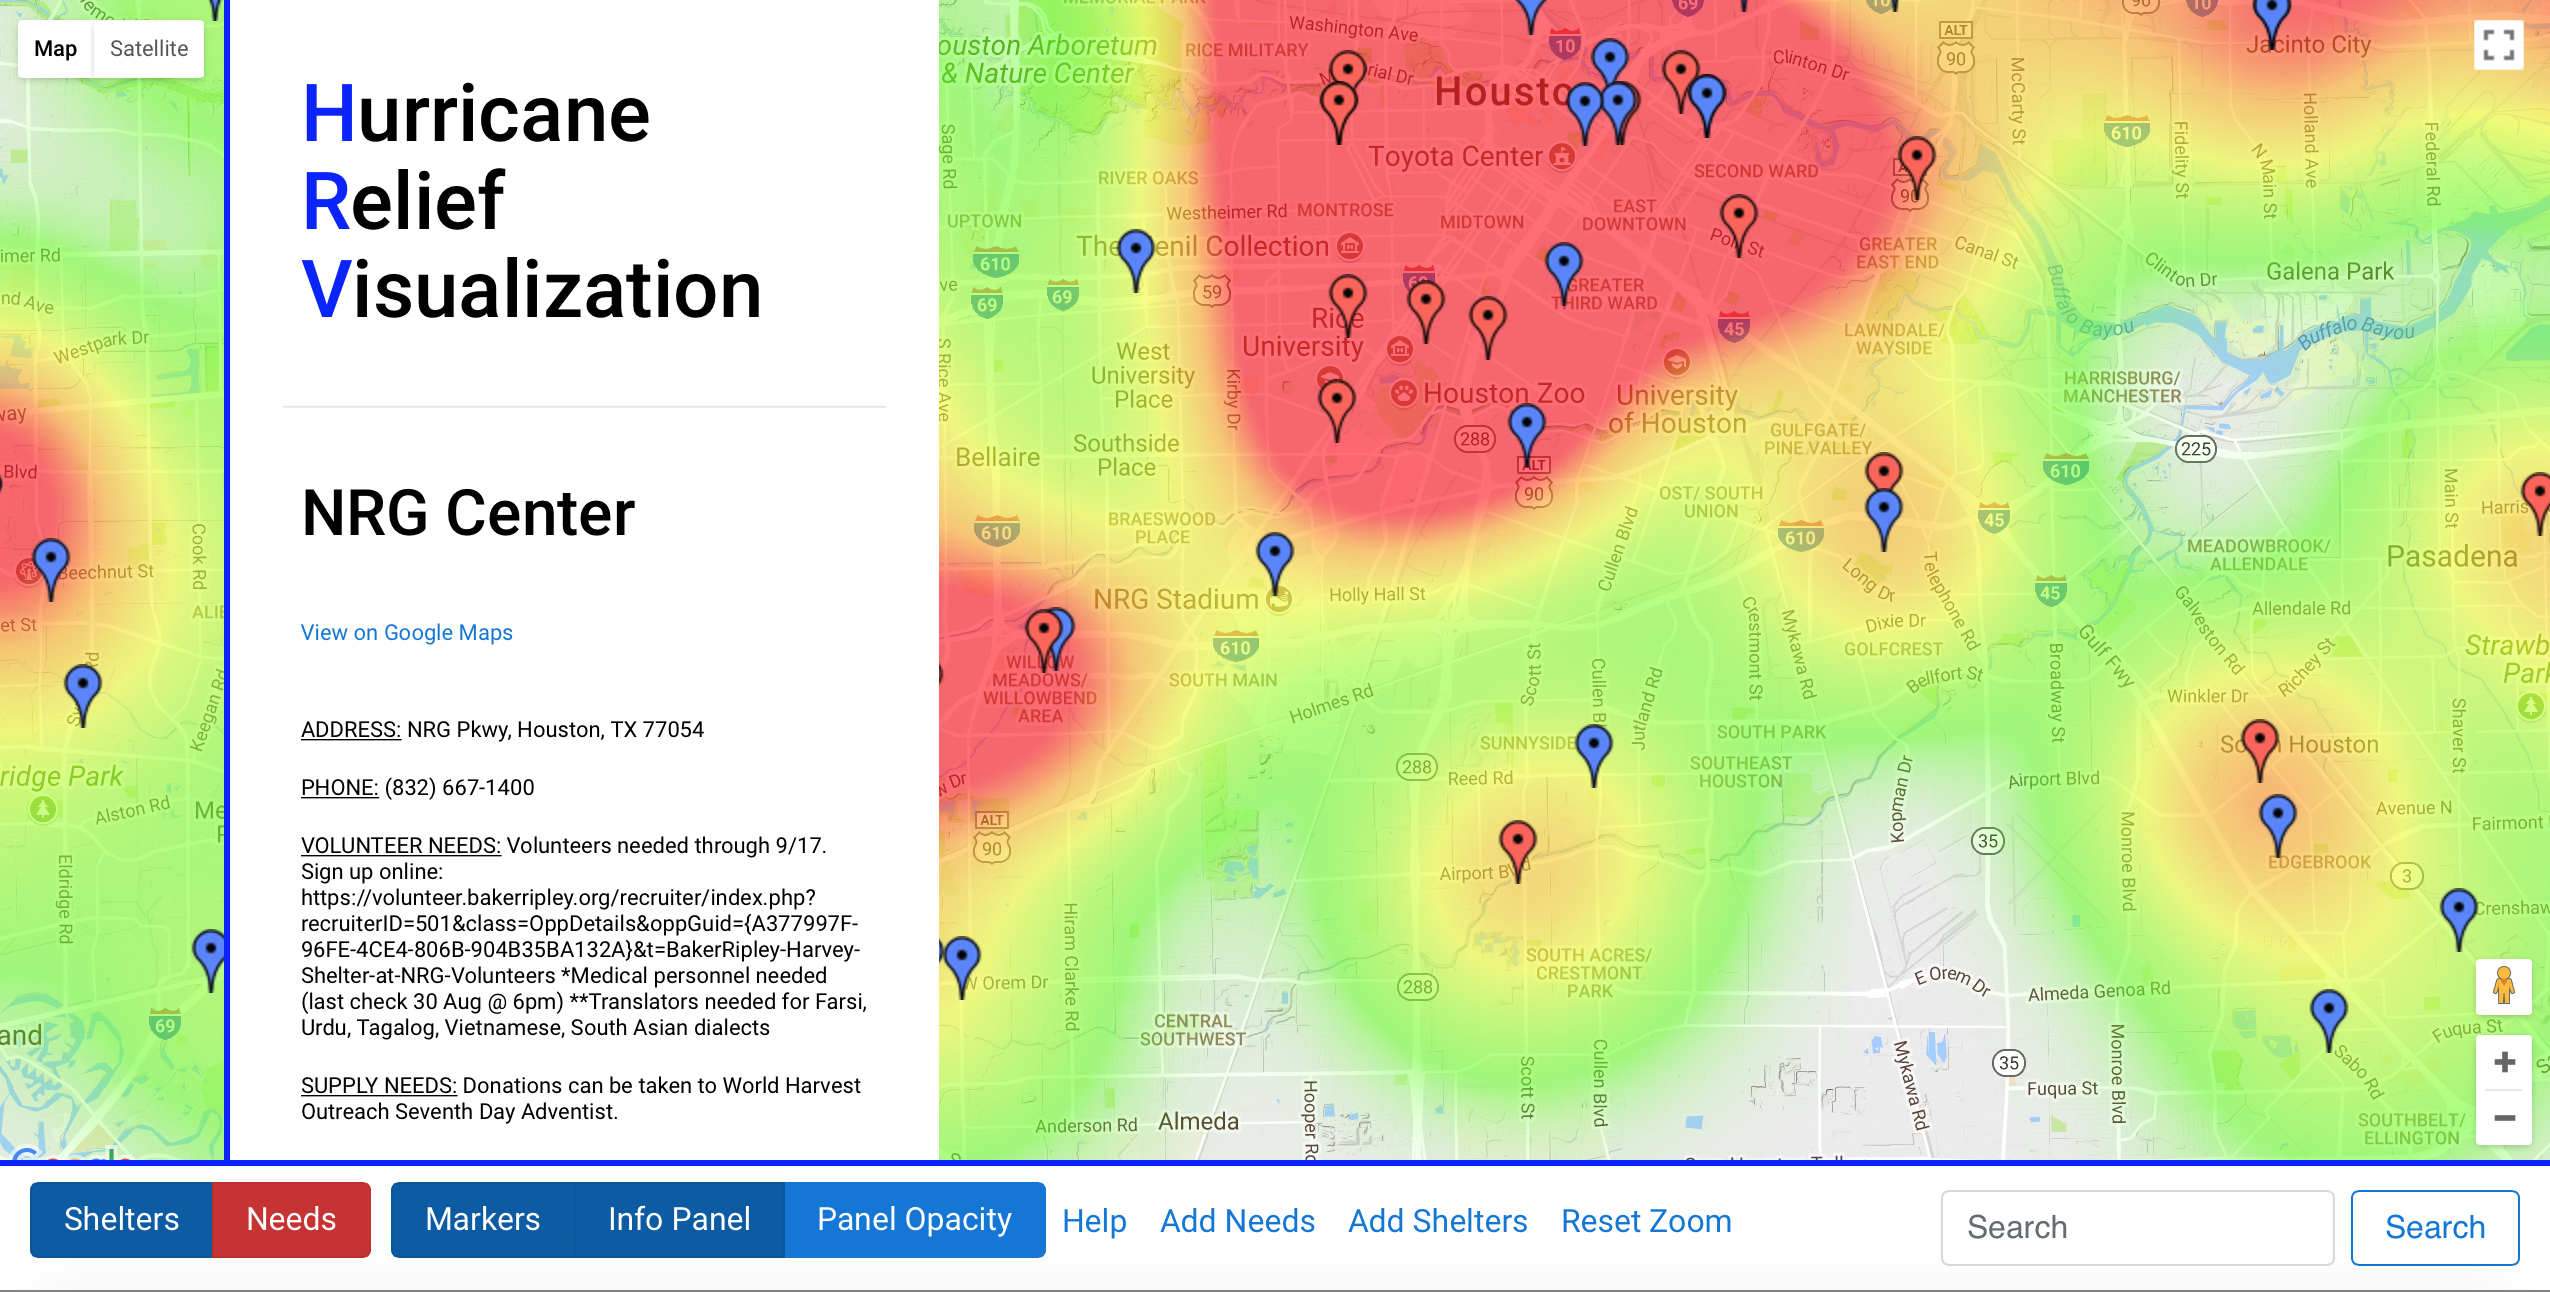
Landing Page
-
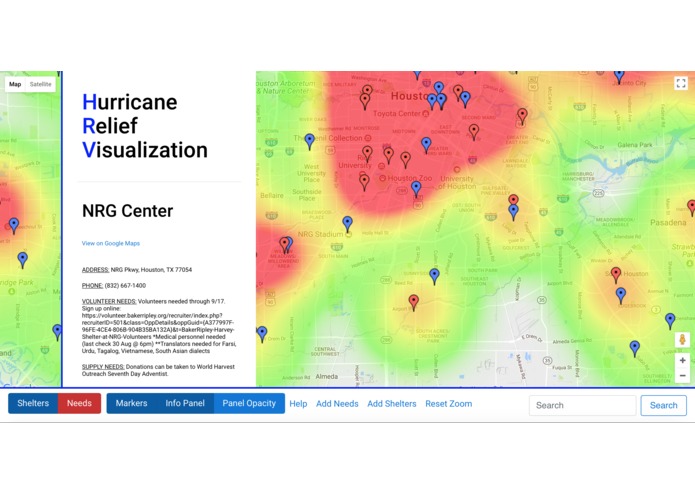
Marker Information
-
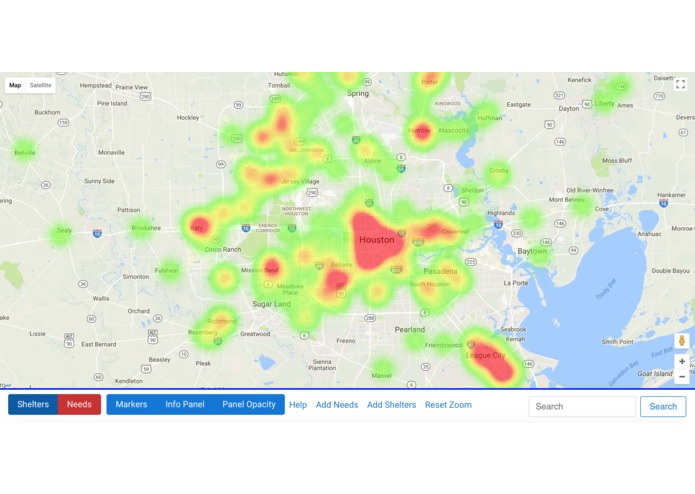
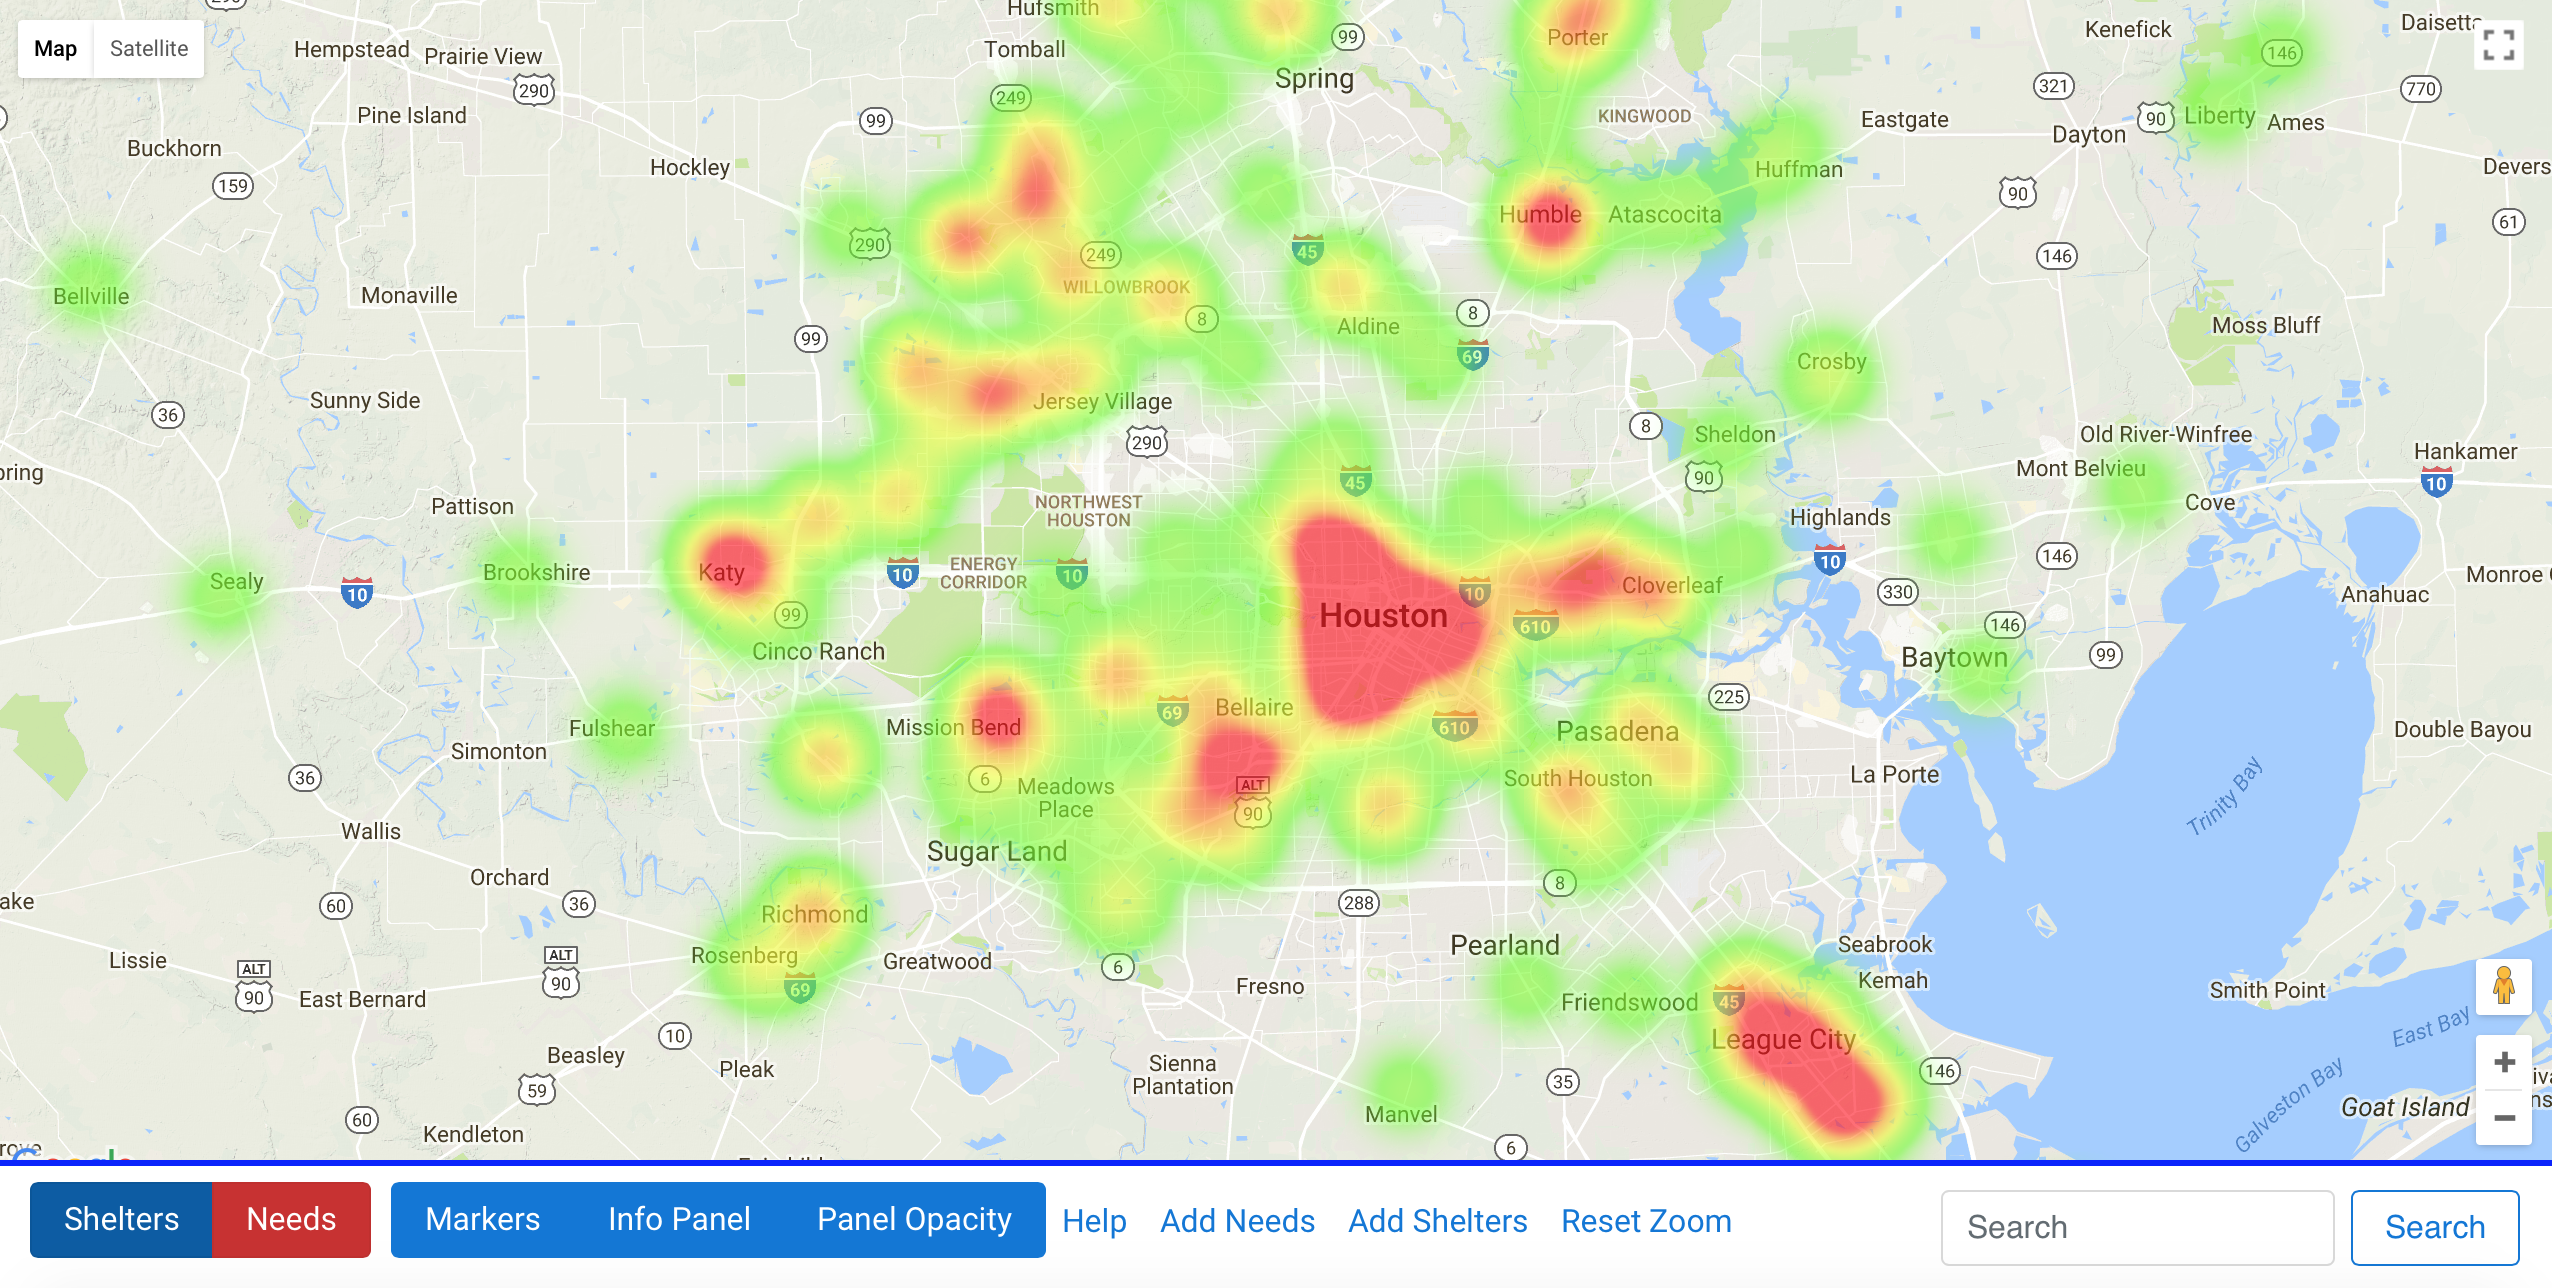
Heatmap
Inspiration
After Houston was recently hit by hurricane Harvey, emergency responders found it difficult to accurately assess the situation. Structured, publicly avialable data was limited, thus constraining the ability to provide aid to those in need.
What it does
We addressed this issue by harnessing the untapped potential of crowdsourced data for natural disaster awareness. Our robust platform visualizes large amounts of publicly-contributed data in real time with markers and a heat map, enabling emergency responders to efficiently provide help, but also making it easier for the general public to contribute via volunteering and/or donations.
How we built it
HTML for the front-end and JavaScript for the back-end.
Challenges we ran into
Asynchronous requests, importing APIs, etc.
Accomplishments that we're proud of
Our use of NLP to determine the weight of points plotted on our heatmap based on the estimated need at each location.
What we learned
Primarily more experience in JS, HTML, and CSS, things we weren't very familiar with before we started this project.
What's next for Hurricane Relief Visualization (HRV)
The addition of Twitter / other social media data in order to determine which areas have been affected the most by a natural disaster, support for more APIs than the one developed specifically for Harvey.


Log in or sign up for Devpost to join the conversation.