-
-
HurriAid Cover
HurriAid
Why
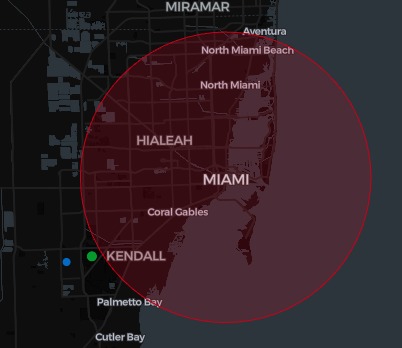
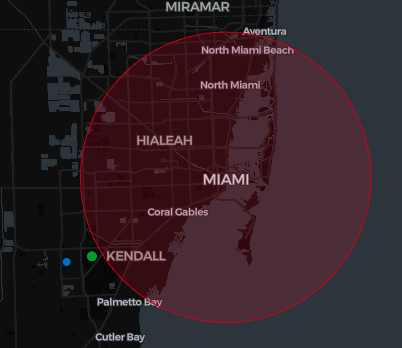
I’m in Miami. Hurricanes happen. I want a simple, instant view: What’s my risk? What should I do right now? Where’s the nearest open shelter? Also, hurricane myths spread fast. I wanted a quick way to verify rumors without doomscrolling.
What it does
- Risk snapshot: SAFE / LOW / MEDIUM / HIGH + a one-line “why.”
- Right-sized checklist tailored to your risk.
- Nearest open shelter with distance + ETA.
- Rumor verifier: labels claims True / False / Misleading with a short note.
How it works (agents)
- Watcher: loads advisory → computes distance → asks AI for risk + brief reason.
- Parallel:
- Checklist (AI): short, deduped, risk-sized actions.
- Planner: finds nearest open shelter via Haversine distance + ETA.
- Verifier (on demand): fact-checks user-entered rumors.
- Checklist (AI): short, deduped, risk-sized actions.
UI (Streamlit)
  ├─ Watcher → AI risk + why
  └─ Parallel
     ├─ Checklist (AI)
     ├─ Planner (nearest shelter)
     └─ Verifier (rumors)
Run it
# 1) Set your key (example: local dev)
export GOOGLE_GENAI_USE_VERTEXAI=FALSE
export GOOGLE_API_KEY="YOUR_API_KEY"

# 2) Install
pip install -r requirements.txt

# 3) Start
streamlit run app/ui.py
Key math — explained
1) Distance (ZIP → storm center)
- Use your ZIP’s latitude/longitude and the storm center’s latitude/longitude.
- Compute great-circle distance (follows Earth’s curve, not a straight line).
- Result is in kilometers.
2) ETA to the nearest open shelter
- Pick a conservative average road speed based on storm intensity:
- TS or Cat 1: ~40 km/h
- Cat 3 or higher: ~30 km/h
- Otherwise: ~45 km/h
- TS or Cat 1: ~40 km/h
- Formula:
ETA (minutes) = (distance_km / speed_kmh) × 60 - This is a safety-first estimate (no live traffic).
3) Risk labels (rule of thumb)
- Inputs: advisory radius
r, your distanced, storm category, and whether the advisory is active. - SAFE — No active advisory, or you’re well beyond
r. - LOW — Advisory is active but you’re comfortably outside the likely impact zone.
- MEDIUM — You’re near the edge (≈ within
r + 120 km), or inside when it’s TS/Cat 1. - HIGH — You’re inside the advisory, or within ~50 km for Cat 2+.
What I learned
- Clean JSON-only contracts keep the UI stable and parsing simple.
- Coordinating multiple AI agents (prompts, temps, token limits) matters more than any single prompt.
- Small, friendly error messages beat perfect but brittle flows.
Challenges
- Getting models to always return strict JSON (no fences/prose).
- Robust parsing + retries across agents.
- Balancing speed, clarity, and “human” phrasing.
Why it matters
What’s my risk? To classify SAFE / LOW / MEDIUM / HIGH using live advisory data, your ZIP’s distance to the storm center, the advisory radius, and storm category, and include a one-sentence why for transparency.
What should I do now? An AI builds a 24–48h checklist sized to your risk: light reminders for LOW, core supplies for MEDIUM, and full prep + evac steps for HIGH, concise, de-duplicated, and actionable.
Where can I go? We find the nearest open shelter from
data/shelters.json, compute distance with haversine, add a storm-aware ETA (slower for CAT3+), and provide a one-click Google Maps route.Is that rumor real? A verifier labels each claim True / False / Misleading / Caution and adds a ≤30-word note—clear guidance without jargon or scare tactics.
Built With
- custom-llm-verifier-(retries/timeouts)
- google-adk-+-gemini-(genai-sdk)
- google-maps-deep-links
- local-json-data-(advisory/shelters/history)
- pgeocode-+-haversine/circle-geo-utils
- pydantic
- python
- streamlit-+-pydeck
- threadpoolexecutor-orchestration


Log in or sign up for Devpost to join the conversation.