-
-
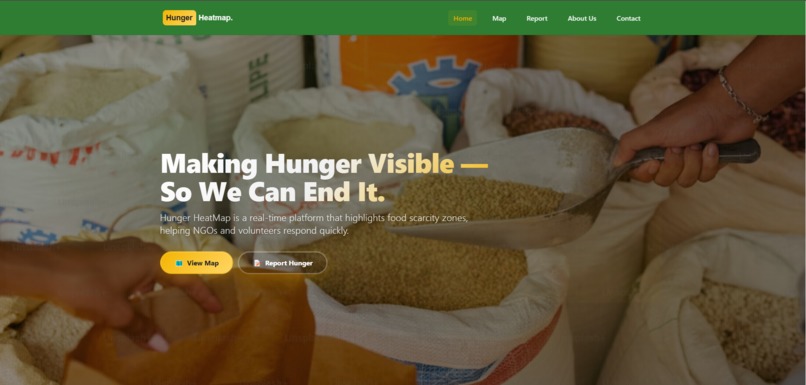
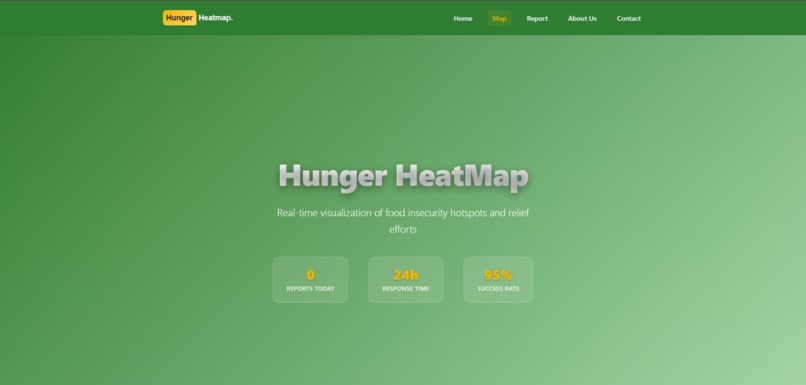
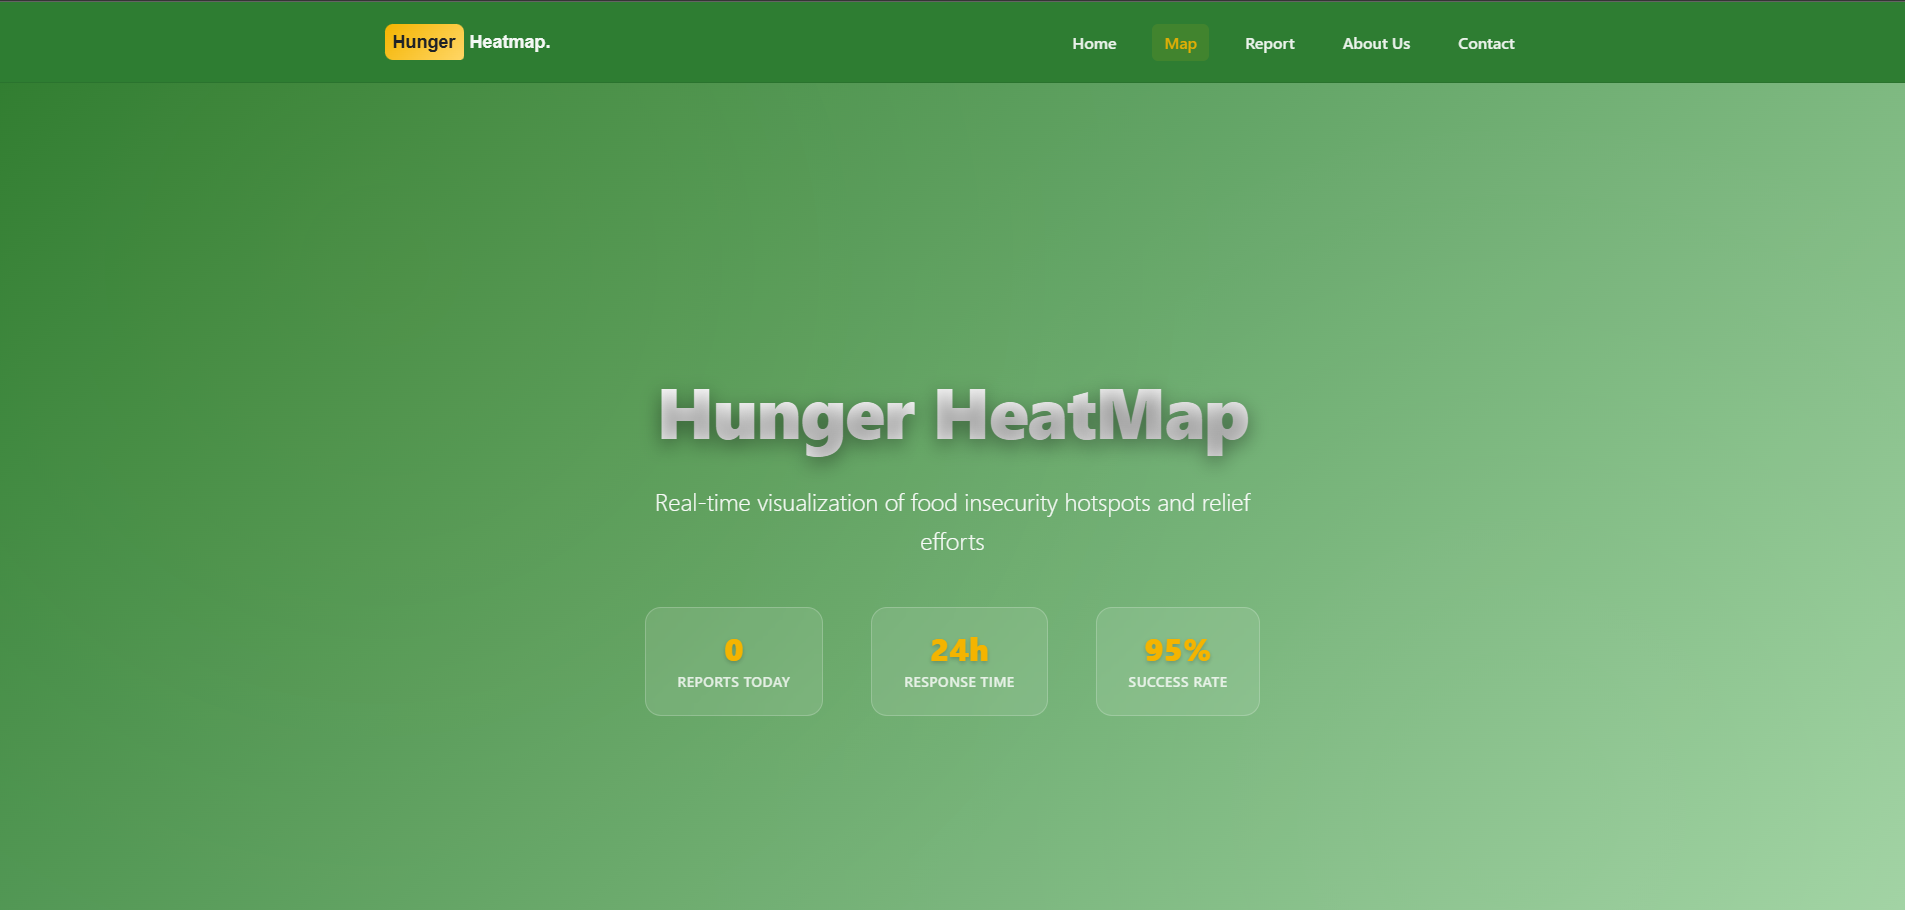
Homepage Desktop
-
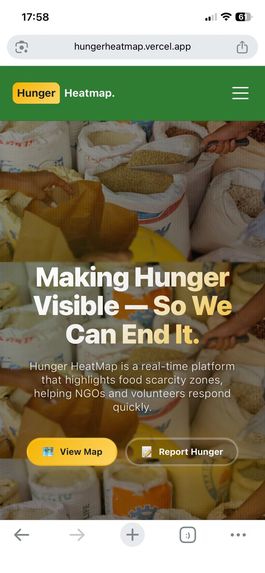
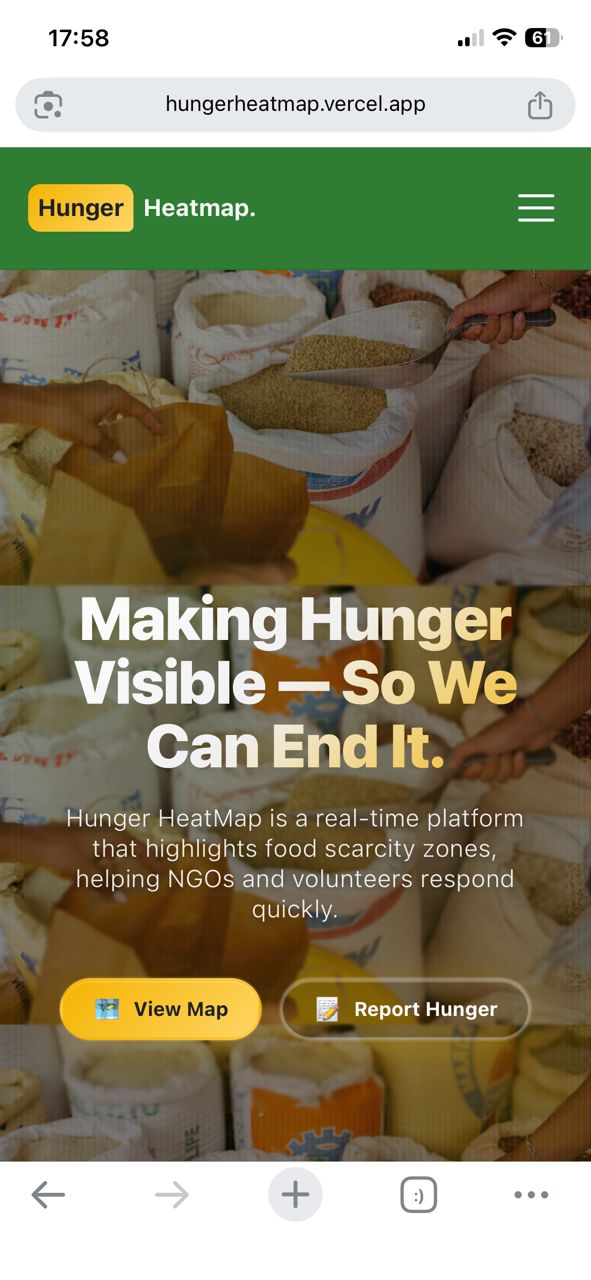
Homepage Mobile
-
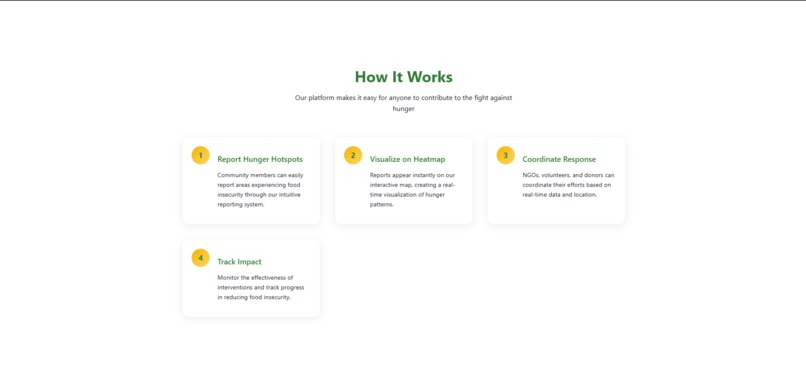
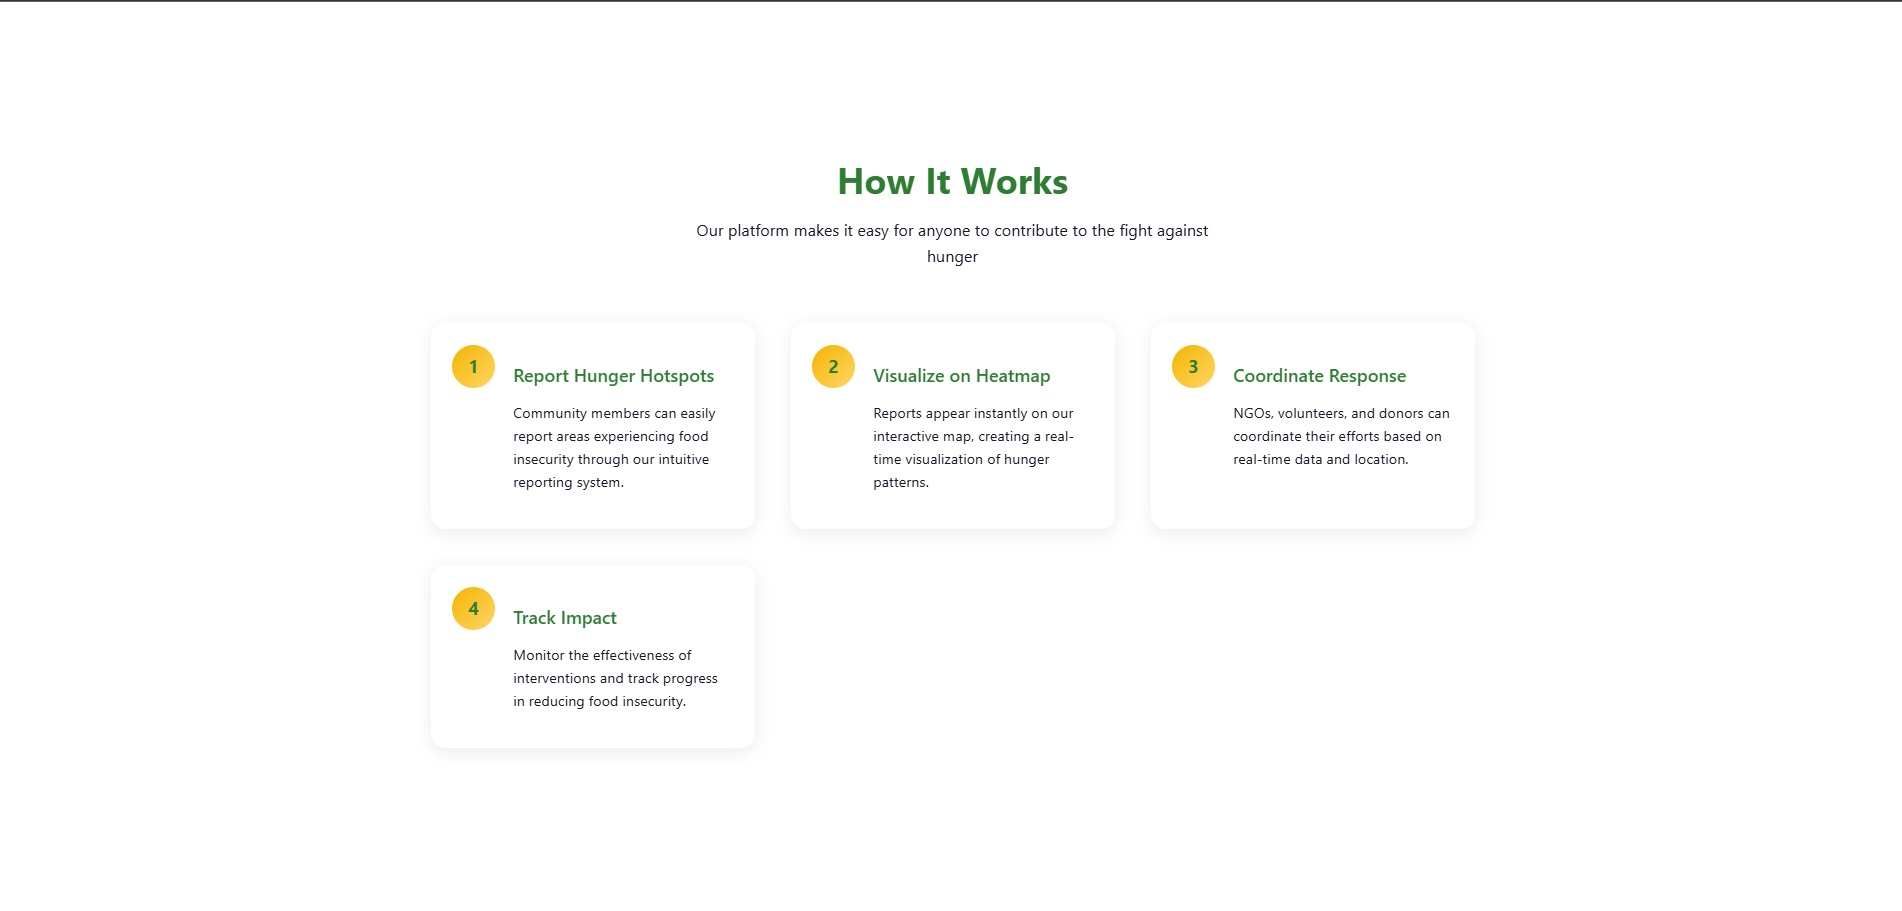
How it works
-
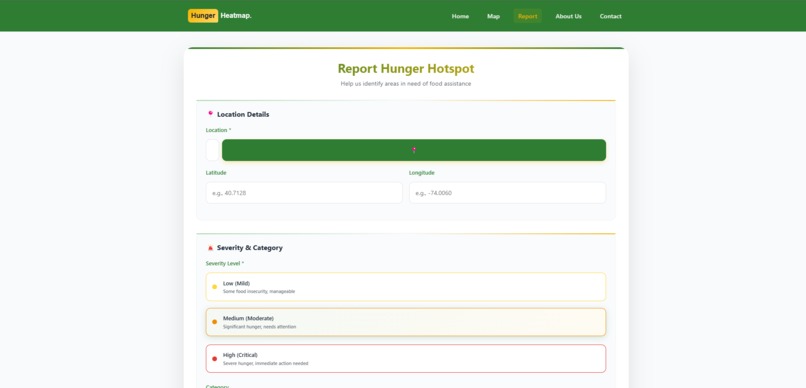
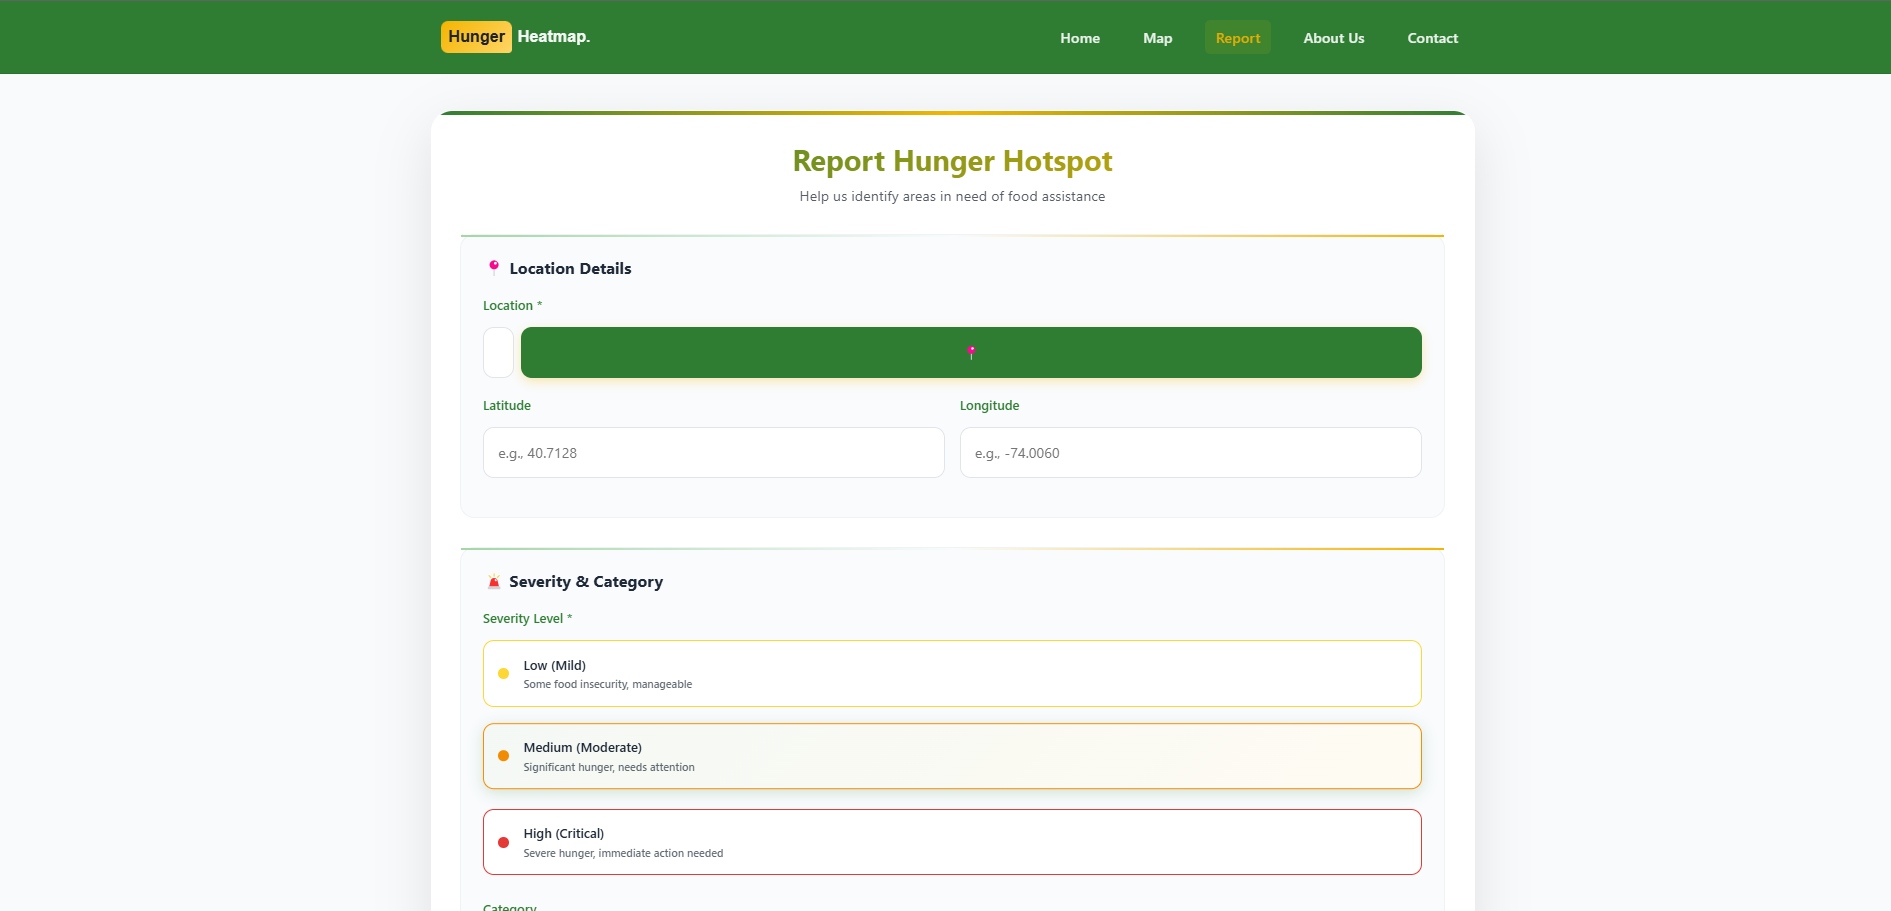
Report page desktop
-
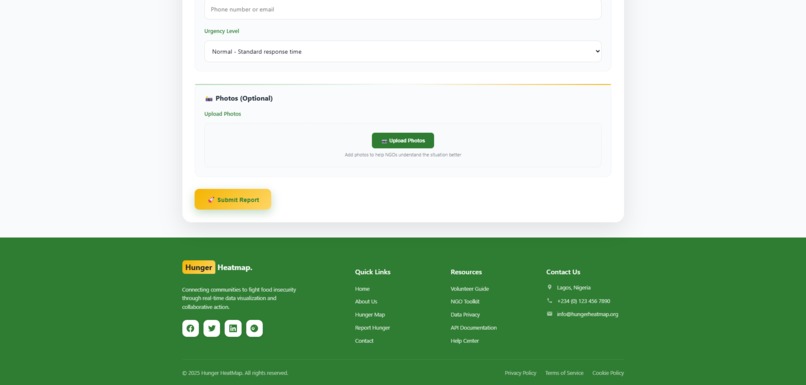
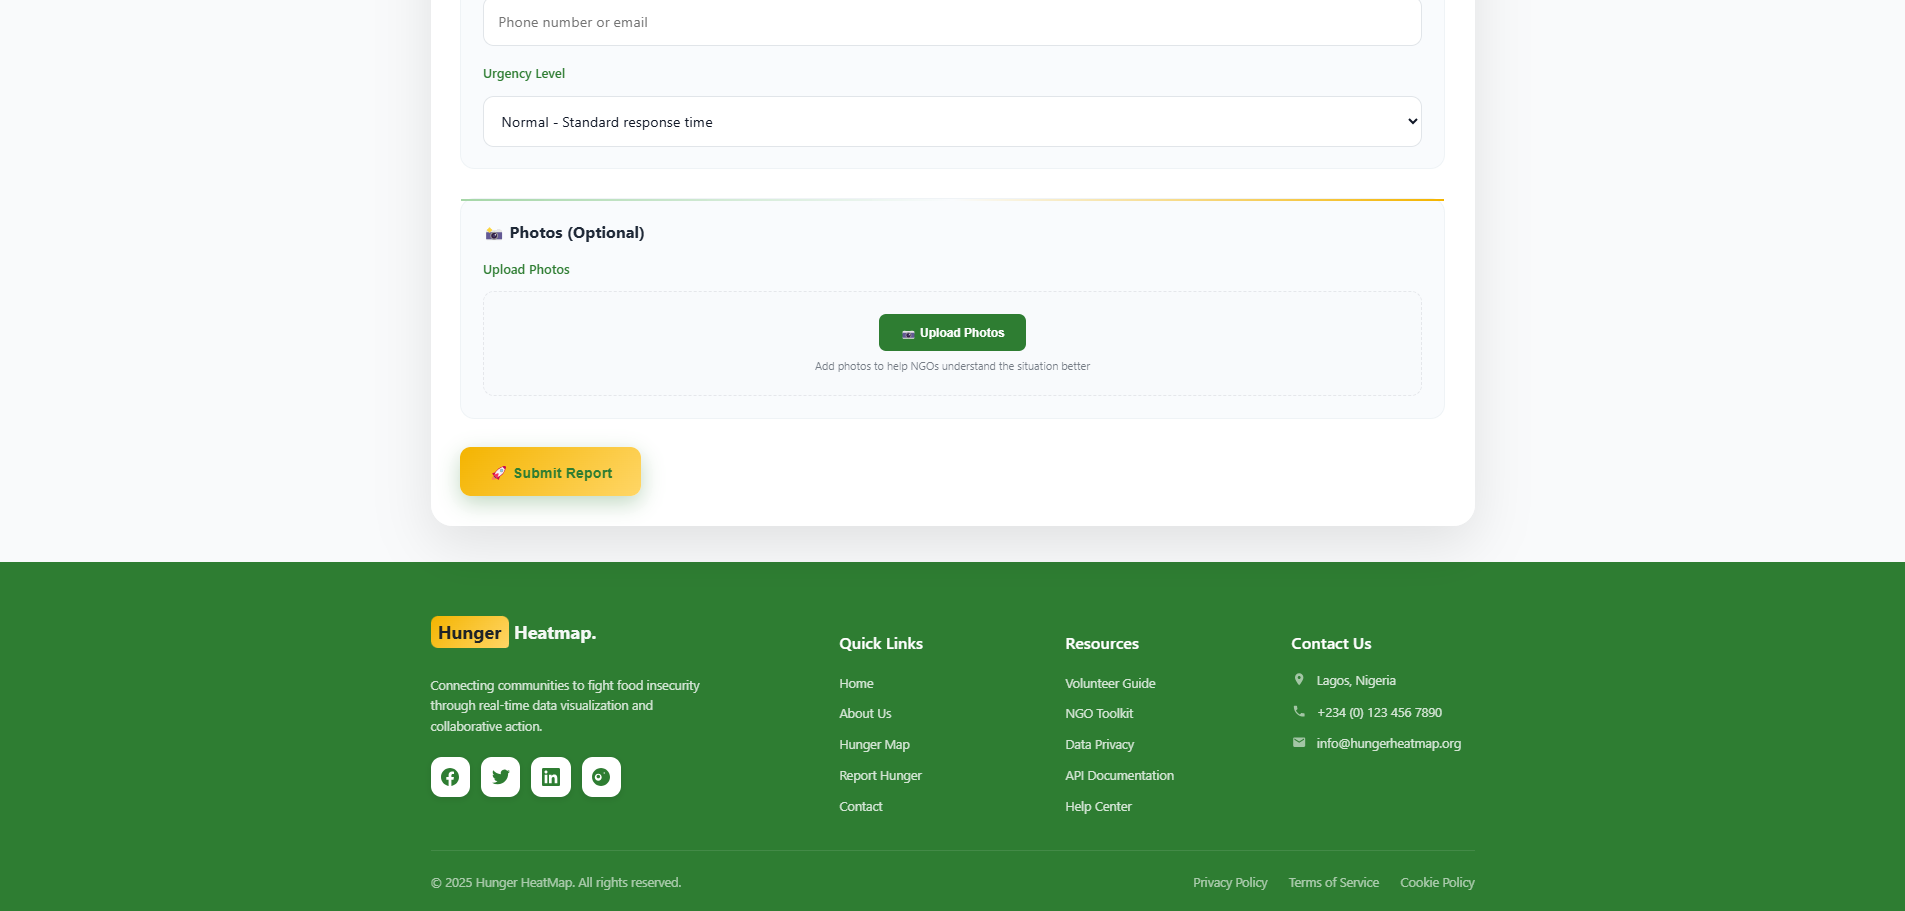
Report form + footer
-
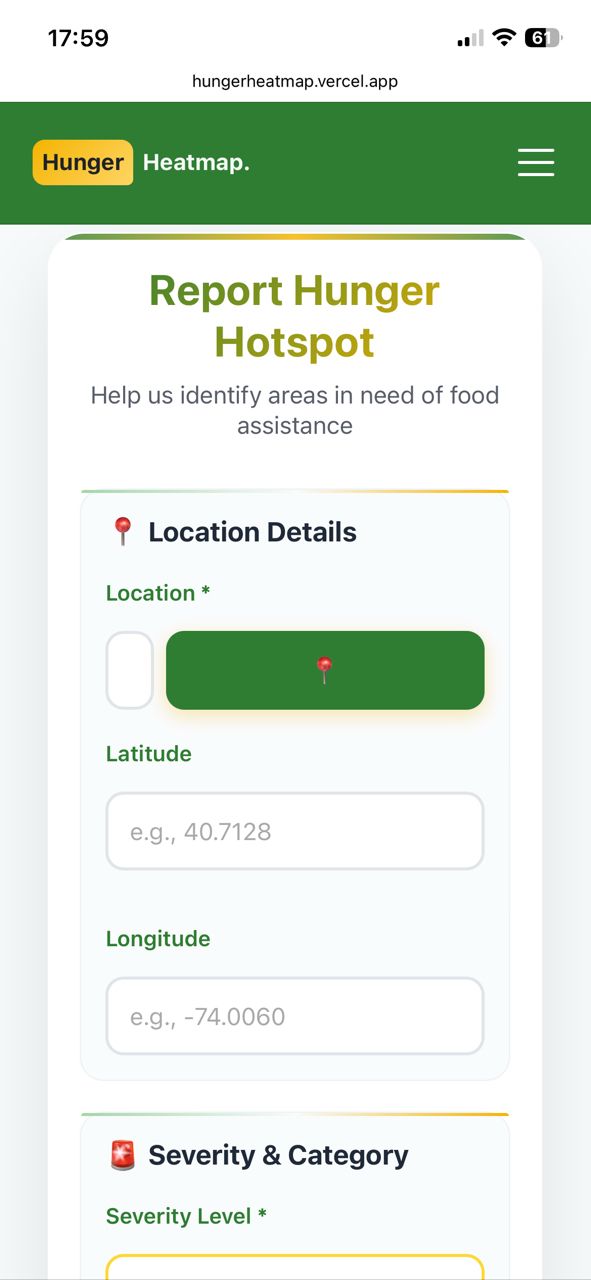
Report page mobile
-

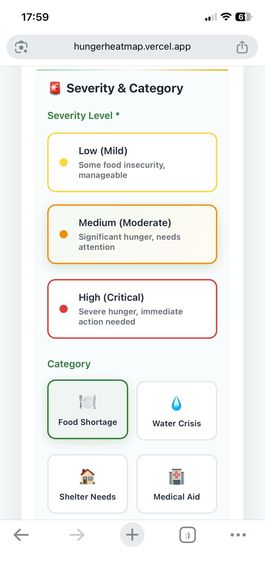
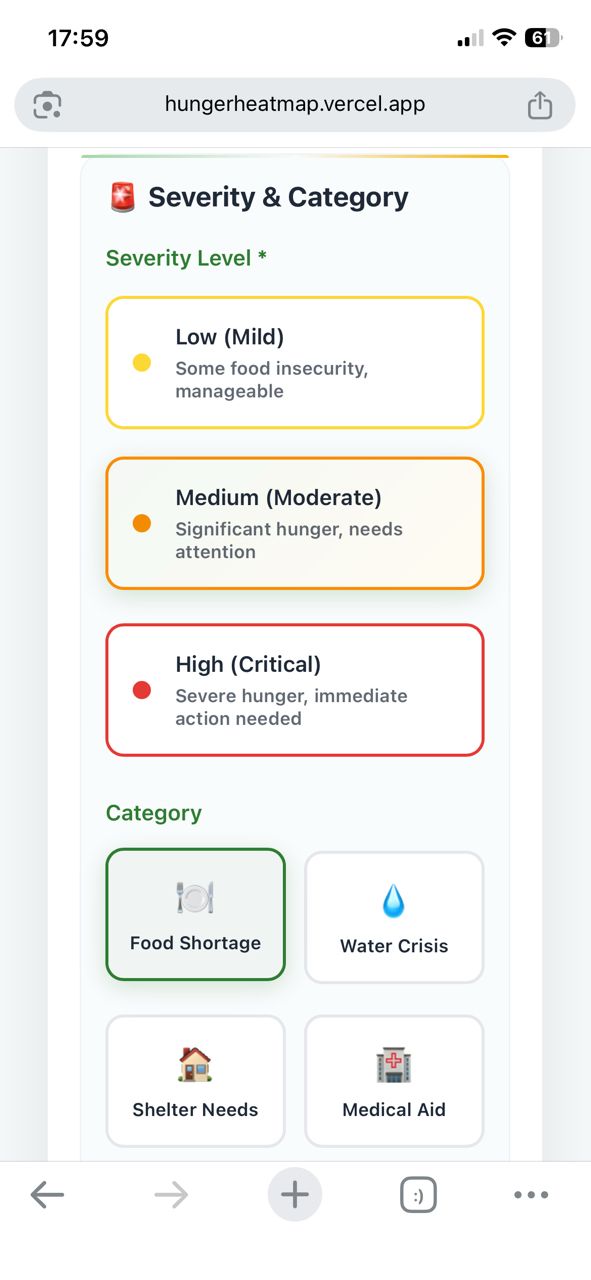
Report form mobile
-
Map Hero Desktop
-
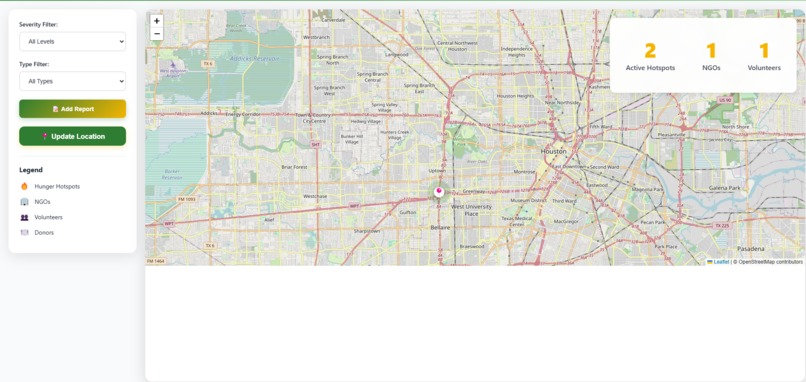
Map tracker Desktop
-
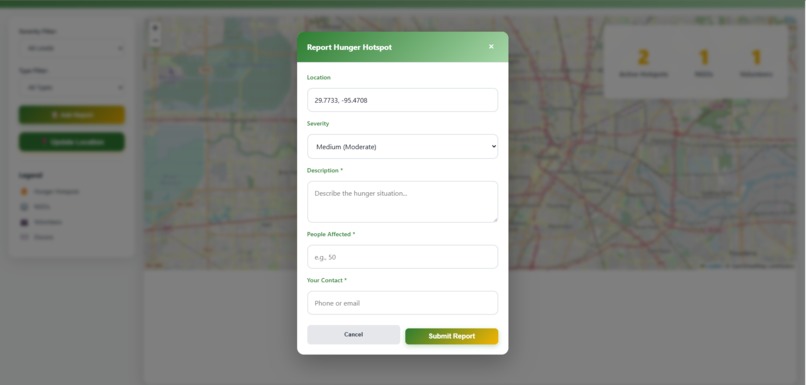
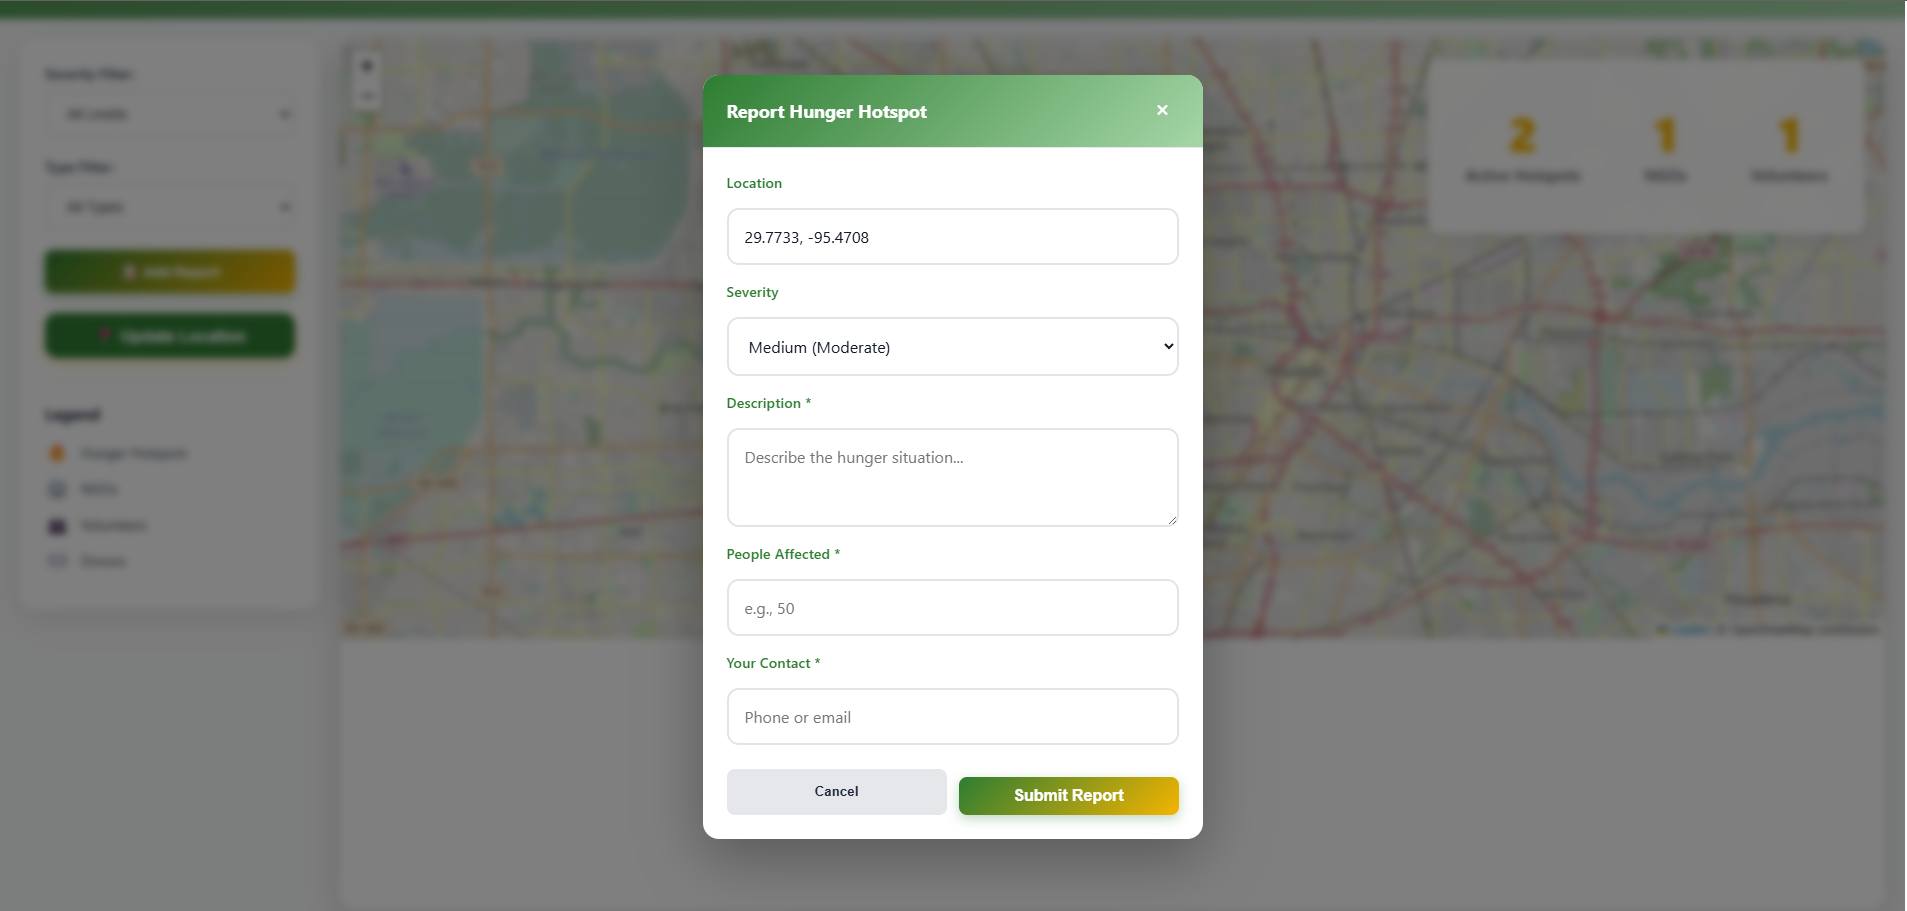
Report form from map page
-

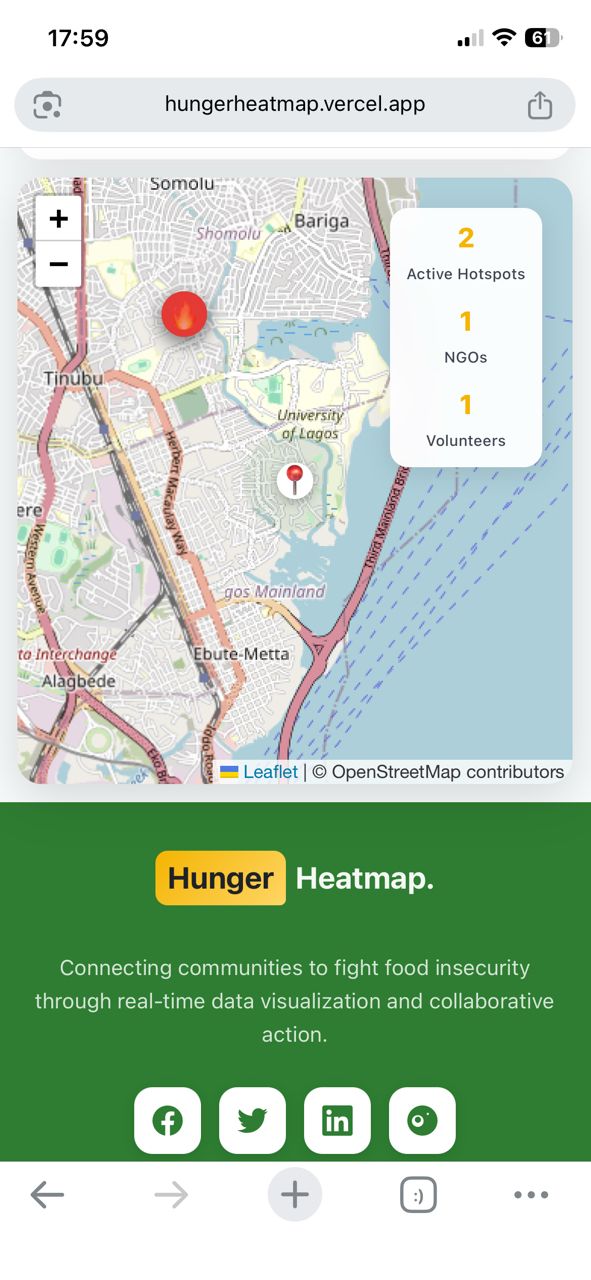
Map tracker mobile
-
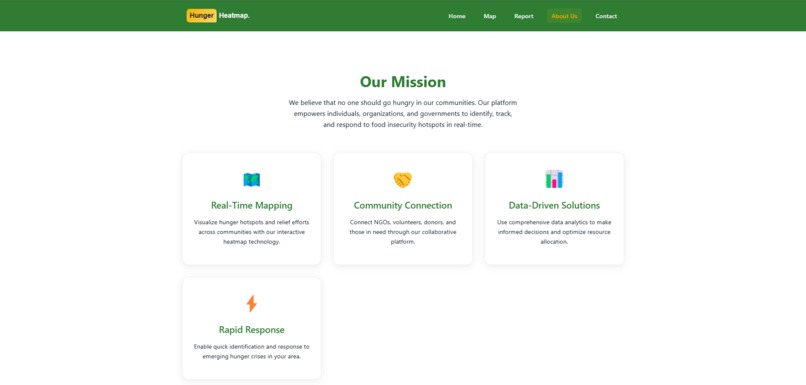
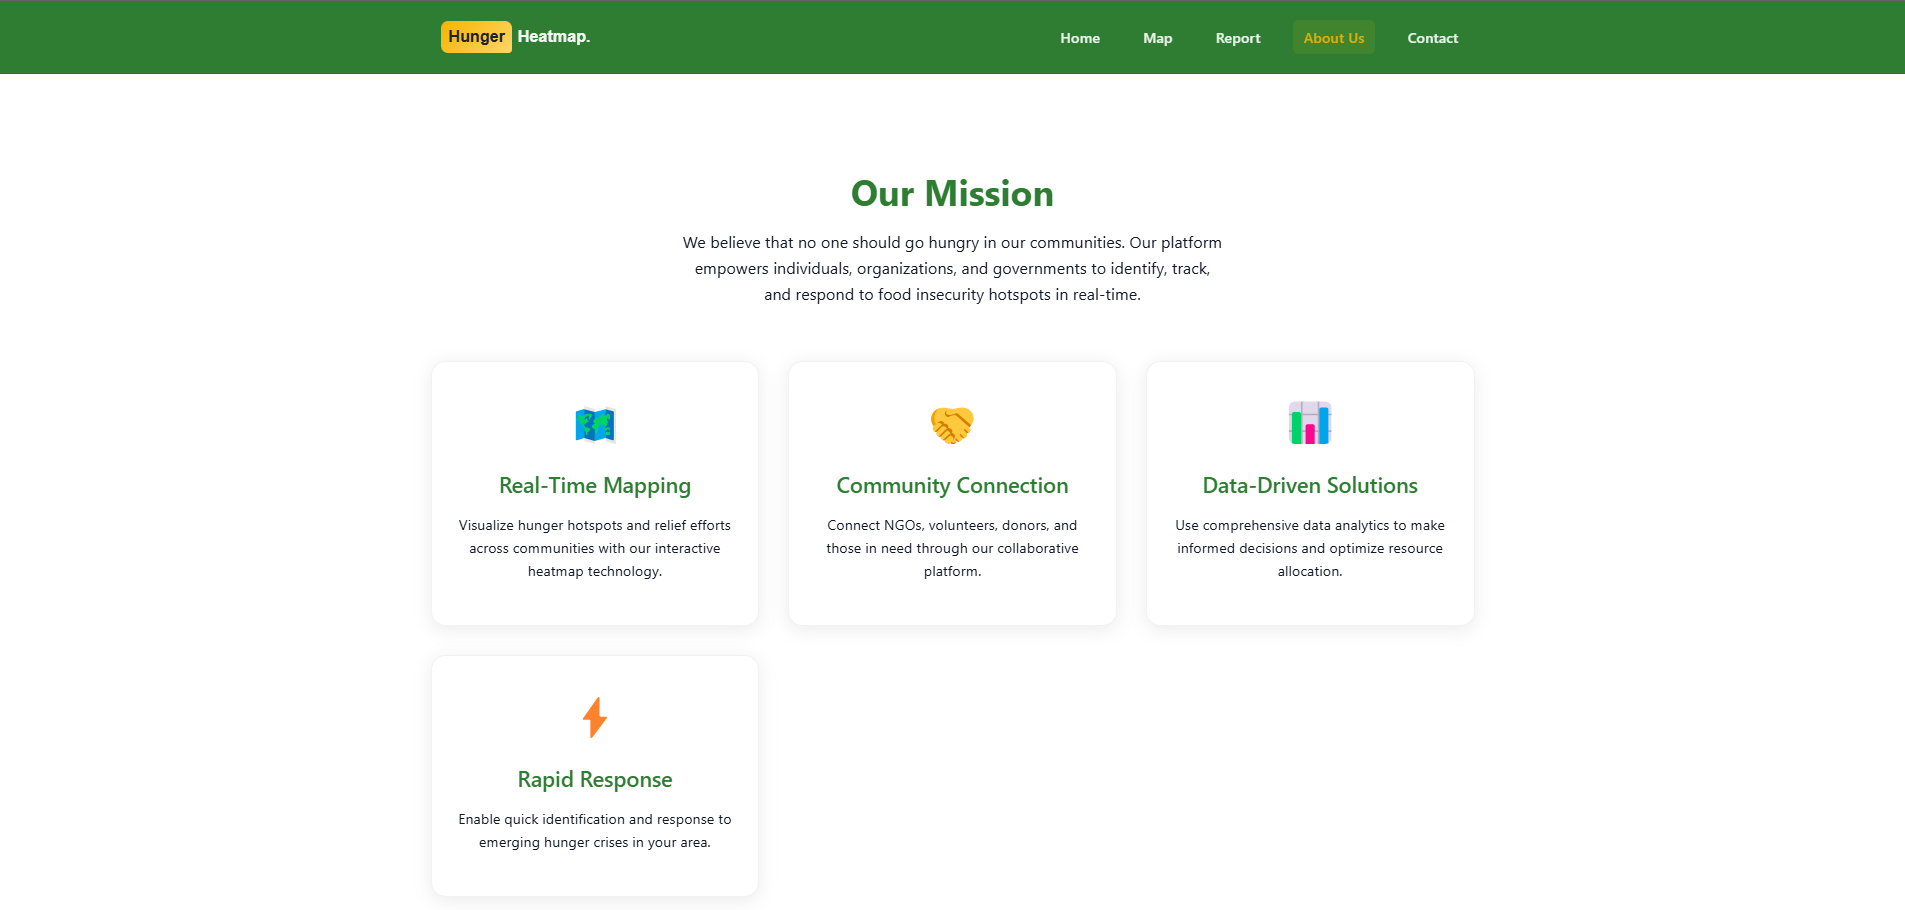
Our Mission Desktop
-
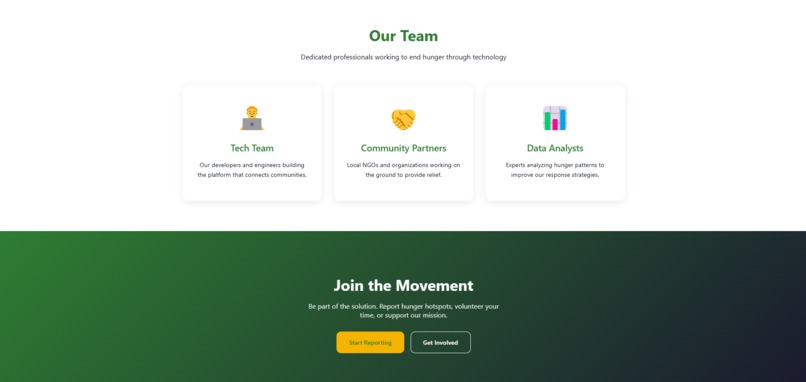
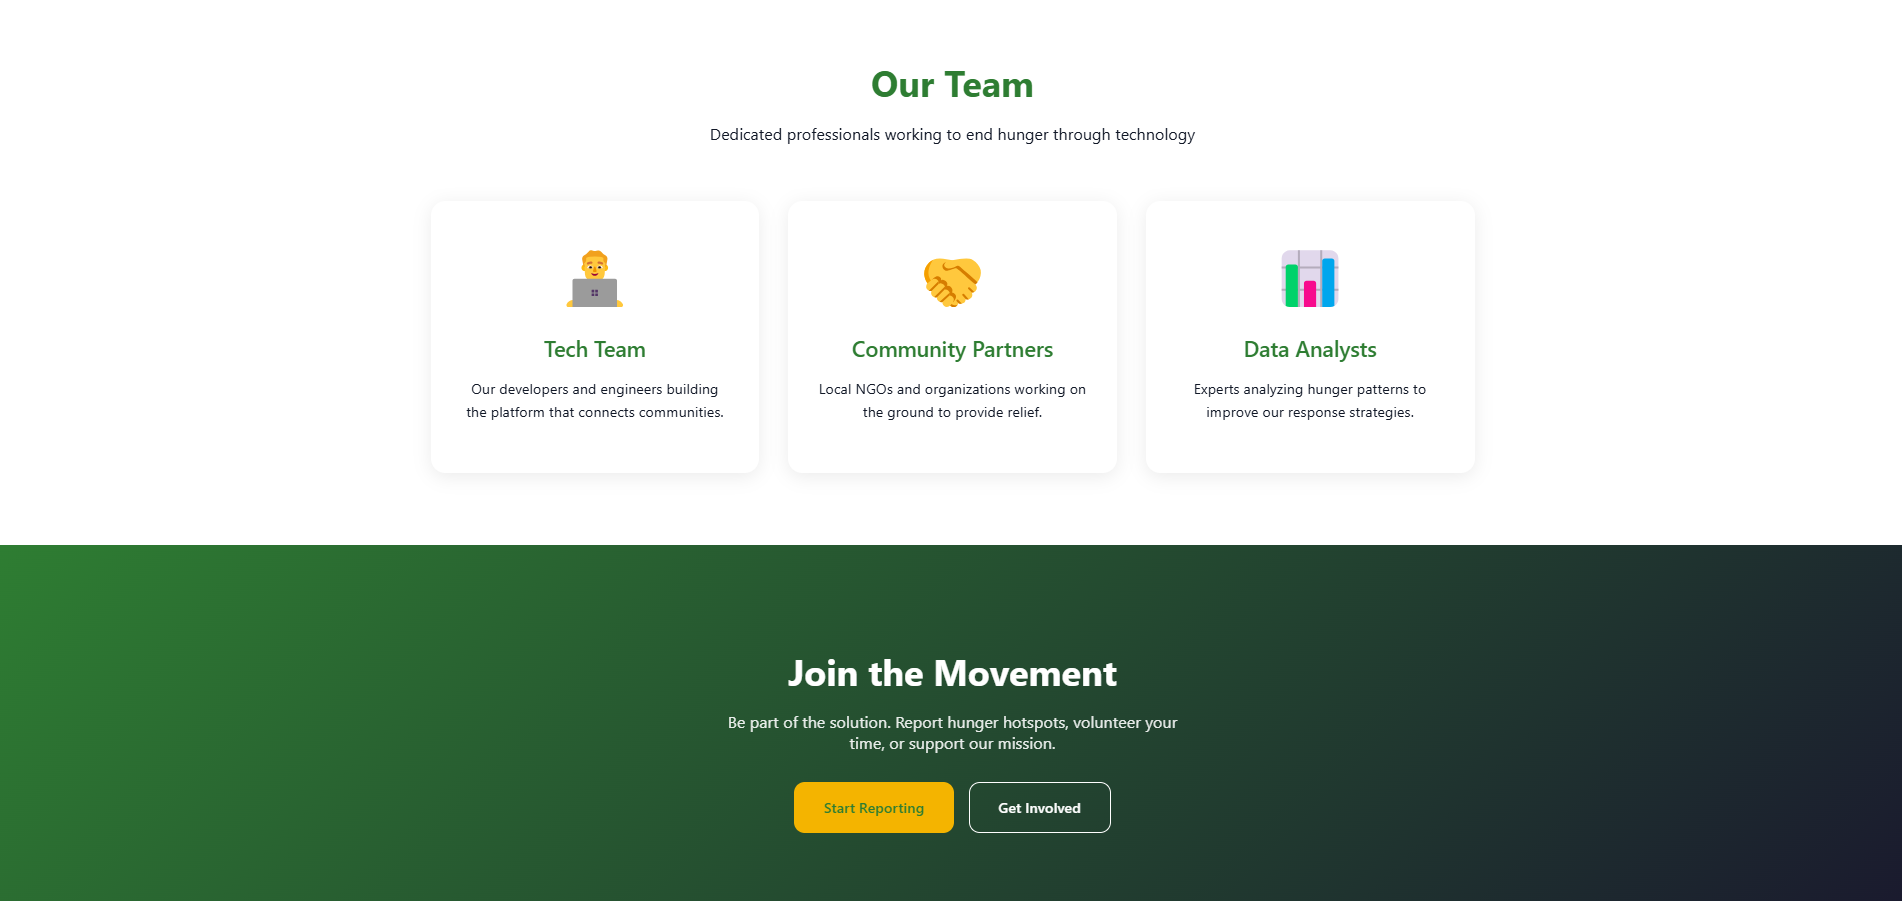
Our team section
-
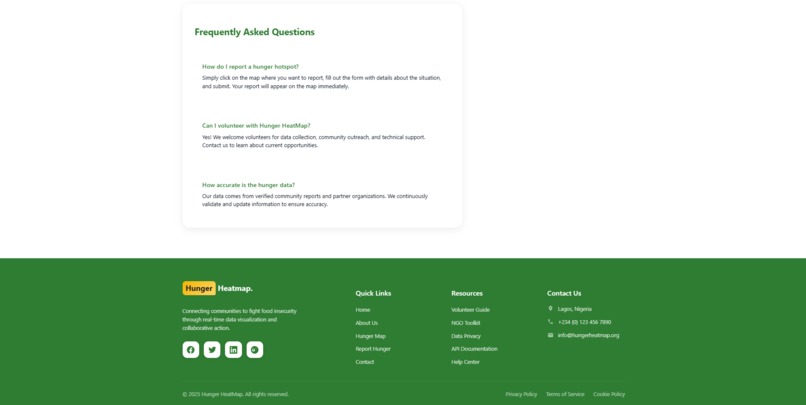
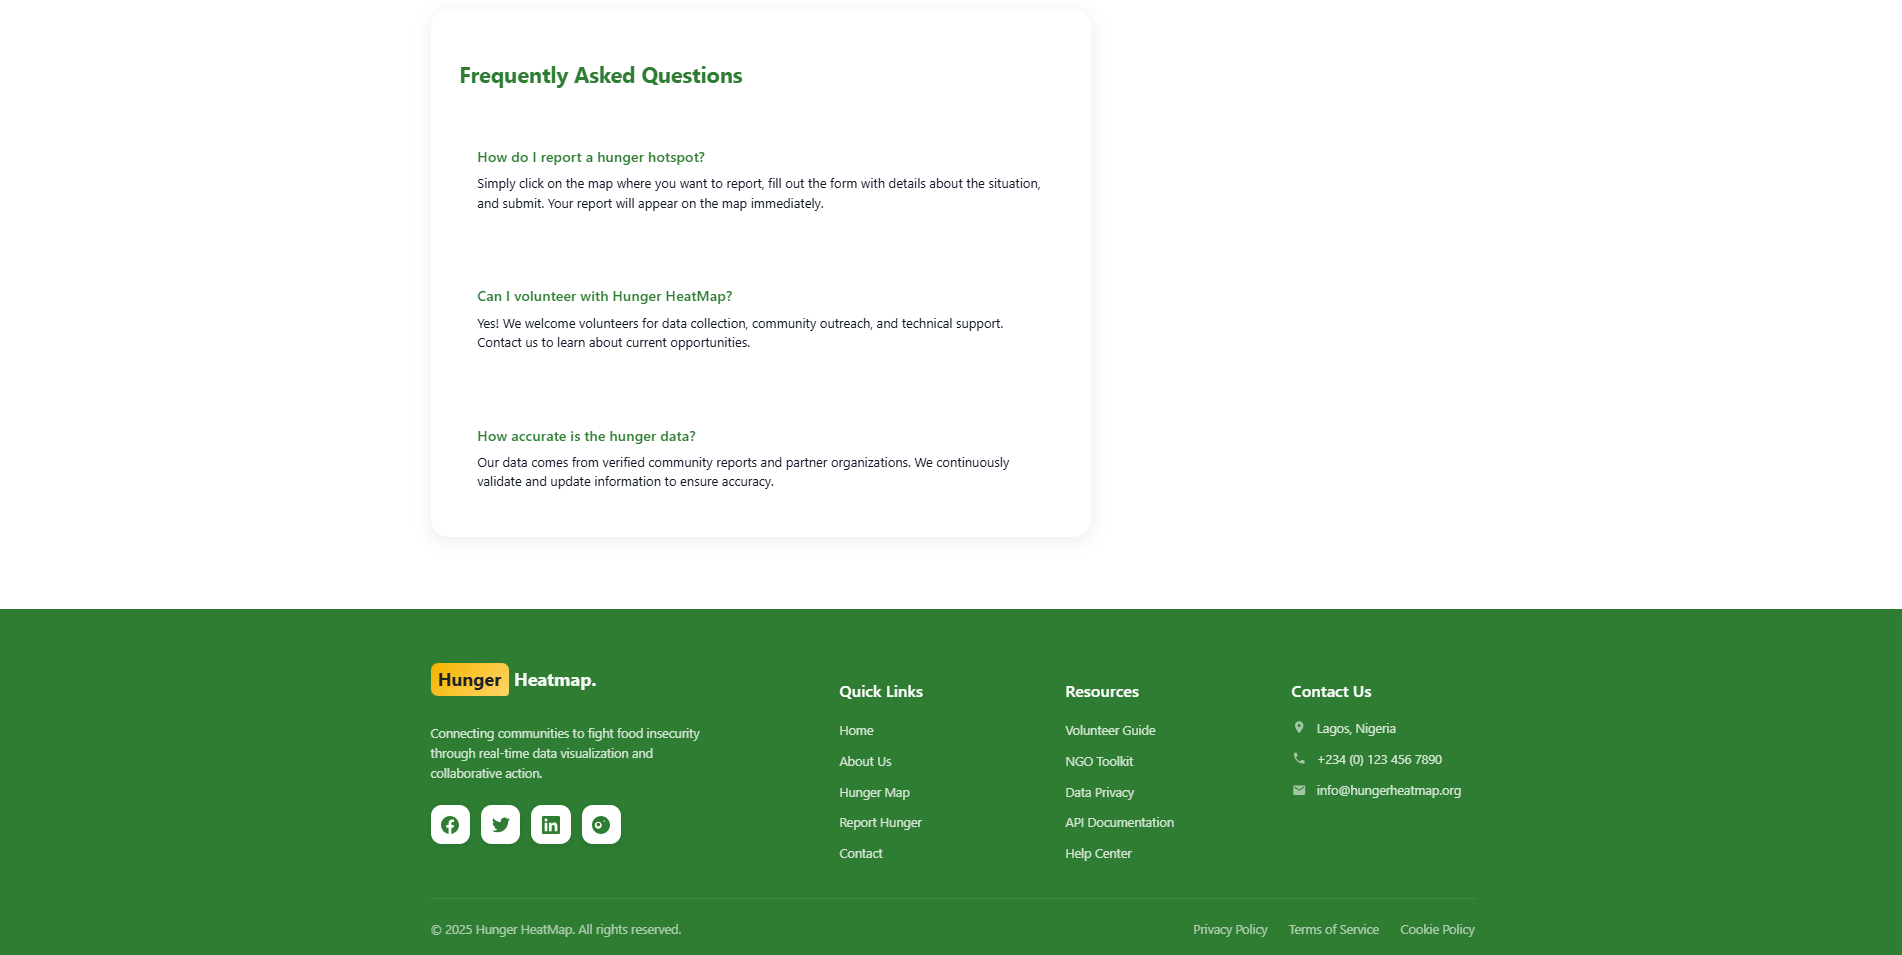
FAQs
-
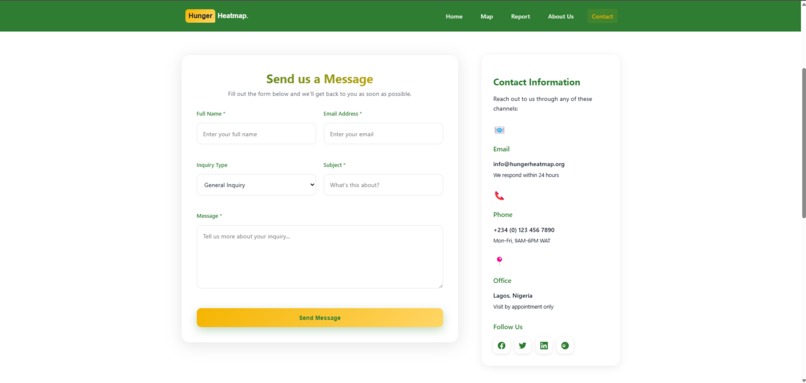
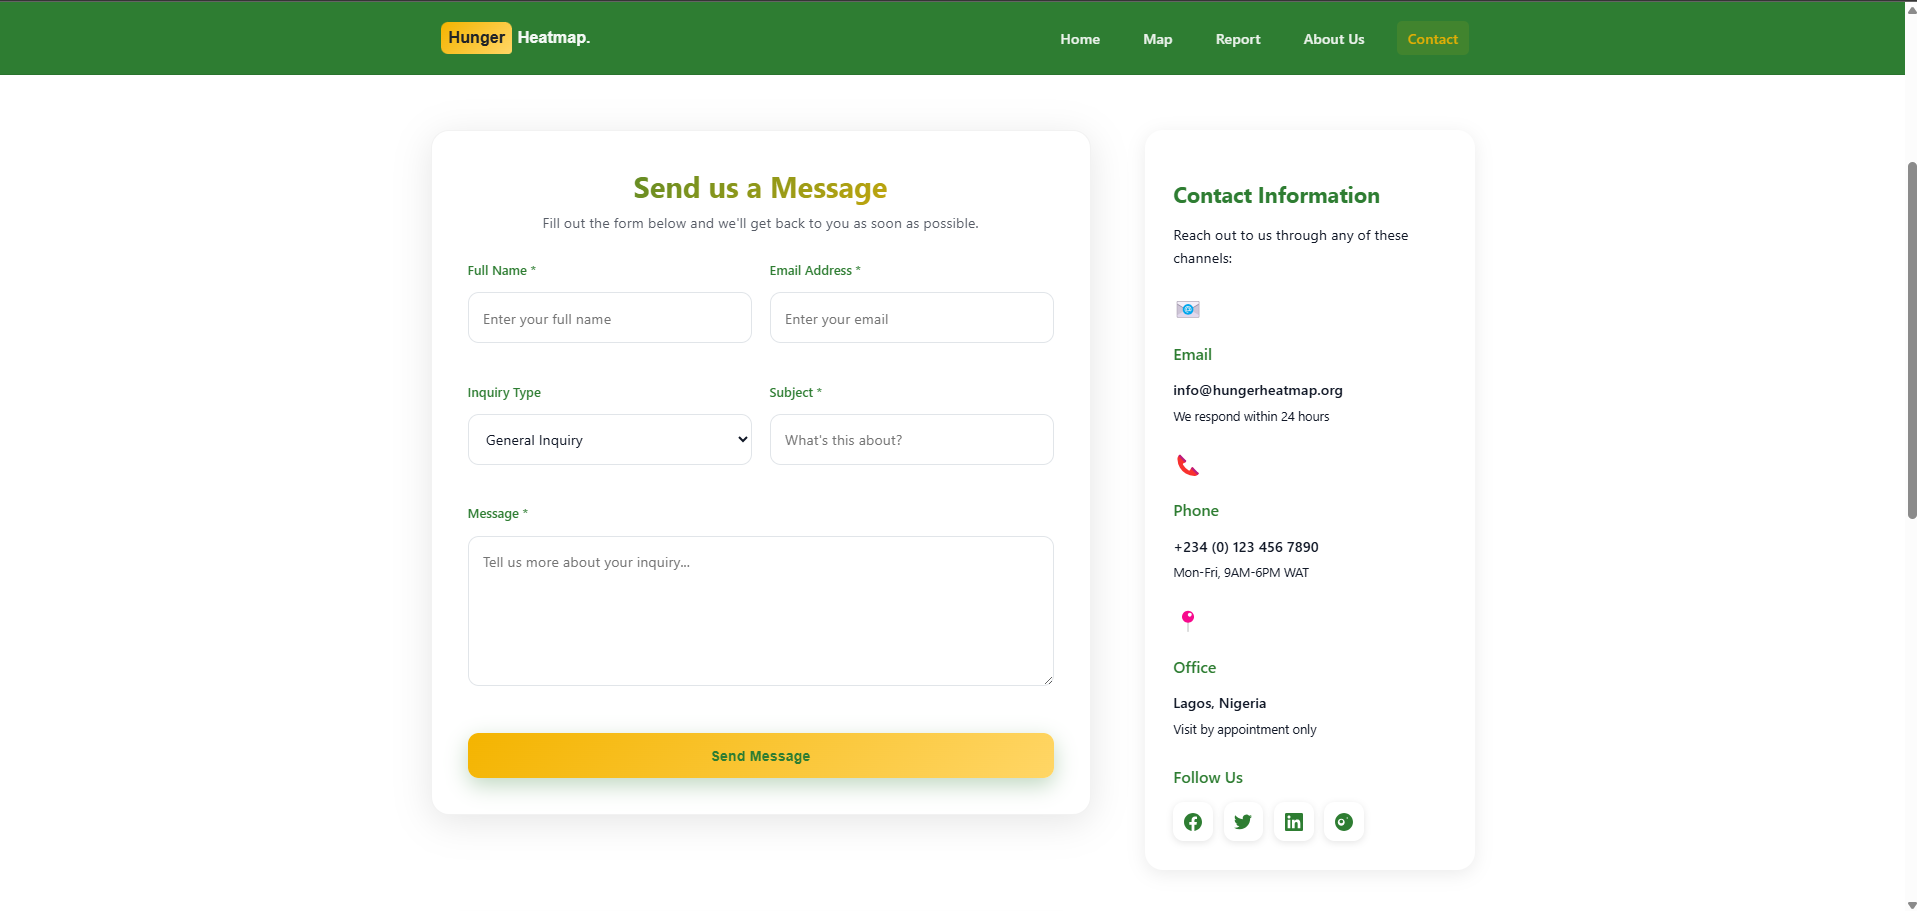
Contact Us Desktop


Inspiration
Food insecurity remains one of the world’s most persistent challenges, and yet, many communities and organizations are ready to help; they just lack clear visibility on where the need is most urgent. The idea for Hunger Heatmap was born out of a desire to use technology to bridge that gap. Inspired by crisis mapping tools and donation platforms, we wanted to create something that makes hunger data visible, actionable, and collaborative.
What it does
Hunger Heatmap is a simple, map-based platform that helps visualize areas experiencing food scarcity or hunger issues.
- Individuals can report food insecurity in their communities.
- Organizations and volunteers can view the live map to identify hotspots and respond effectively.
- Visitors can also learn more about hunger and get involved through the contact and report pages. It turns scattered data into a clear, visual story that drives awareness and action.
How we built it
Frontend: Built with React (Vite) for fast development and smooth UI. Styling: Implemented using plain CSS for full customization and lightweight performance. Map: Integrated an interactive map view to highlight reported hunger hotspots. Deployment: Hosted on Vercel for quick, reliable, and free hosting.
All development was done from scratch within the hackathon timeline.
Challenges we ran into
Finding the right map visualization that is lightweight, interactive, and easy to integrate without a heavy backend. Designing a UI that feels NGO-appropriate — impactful but not overwhelming. Choosing the right assets (like hero images) to match the theme without copyright or download issues.
Accomplishments that we're proud of
Taking the project from idea to a fully functional MVP within a short time frame. Building a clean, responsive UI with multiple pages and a working interactive map. Clearly communicating a complex global issue (hunger) through a simple, impactful interface. Deploying the entire project successfully and making it accessible online.
What we learned
How to quickly ideate and execute a complete product flow under time pressure. The importance of UI clarity and how small design decisions can change how people interact with data. How to work efficiently without relying on heavy libraries — using React + plain CSS effectively. Better understanding of map integrations and deployment pipelines using Vercel.
What's next for Hunger Heatmap
Add user authentication so organizations and verified reporters can manage data more securely. Enable pin clustering, severity levels, and filters on the map for deeper insights. Build a simple backend/API to store reports persistently. Partner with local NGOs and food banks to make the map a real-time coordination tool for food aid distribution. Expand the platform to support multiple regions and languages.


Log in or sign up for Devpost to join the conversation.