❤️ Inspiration
Heart disease is one of the major health challenges worldwide, and understanding cardiovascular health can be difficult for people who are not familiar with medical terminology. Clinical reports often contain complex numbers and measurements that may be challenging to interpret.
We wanted to explore how Artificial Intelligence could make cardiovascular risk information easier to understand through meaningful predictions and visual explanations.
This idea inspired us to create HRIDYAM AI — an AI-powered cardiovascular risk prediction and 3D visualization platform designed to bring complex heart health information closer to everyone.
Our vision is simple: make heart-related risk information easier to understand, visualize, and explore.
💡 What We Learned
While developing HRIDYAM AI, we explored how machine learning can be applied to healthcare-related datasets and how different clinical parameters can contribute to cardiovascular risk prediction.
We gained experience in:
- Understanding and preprocessing clinical datasets.
- Building and evaluating machine learning classification models.
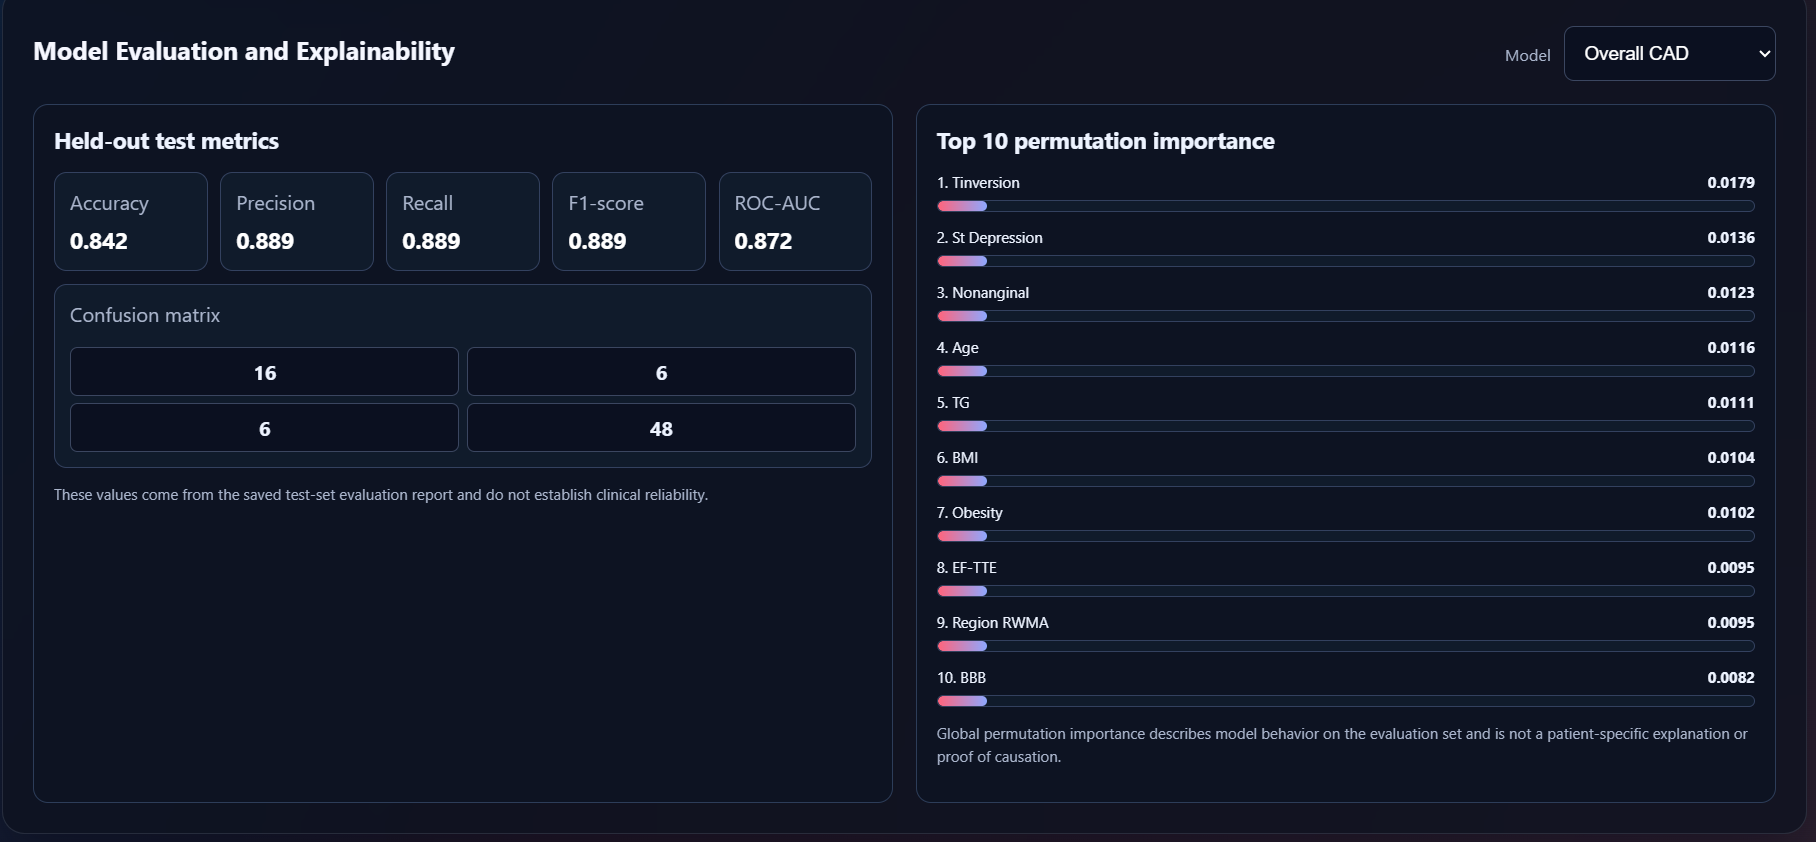
- Using performance metrics such as Accuracy, Precision, Recall, F1-score, and ROC-AUC.
- Understanding the importance of explainable AI techniques such as SHAP.
- Creating interactive 3D visualizations using modern web technologies.
- Connecting a machine learning backend with a user-friendly frontend.
- Understanding the importance of data quality, privacy, and responsible AI in healthcare.
We also learned that a prediction becomes more useful when users can understand the factors behind it rather than simply seeing a percentage.
🛠️ How We Built It
HRIDYAM AI combines machine learning, clinical data analysis, and interactive 3D visualization into a single platform.
Our development approach includes the following components:
- Dataset and Data Preprocessing
We use the UCI Extension of the Z-Alizadeh Sani dataset as the planned foundation for model development. It contains clinical and demographic information relevant to cardiovascular disease analysis.
The data is prepared by handling missing values, encoding categorical variables, and selecting relevant features. Target-related columns such as LAD, LCX, RCA, and Cath are excluded from model inputs to prevent data leakage.
- Machine Learning Model
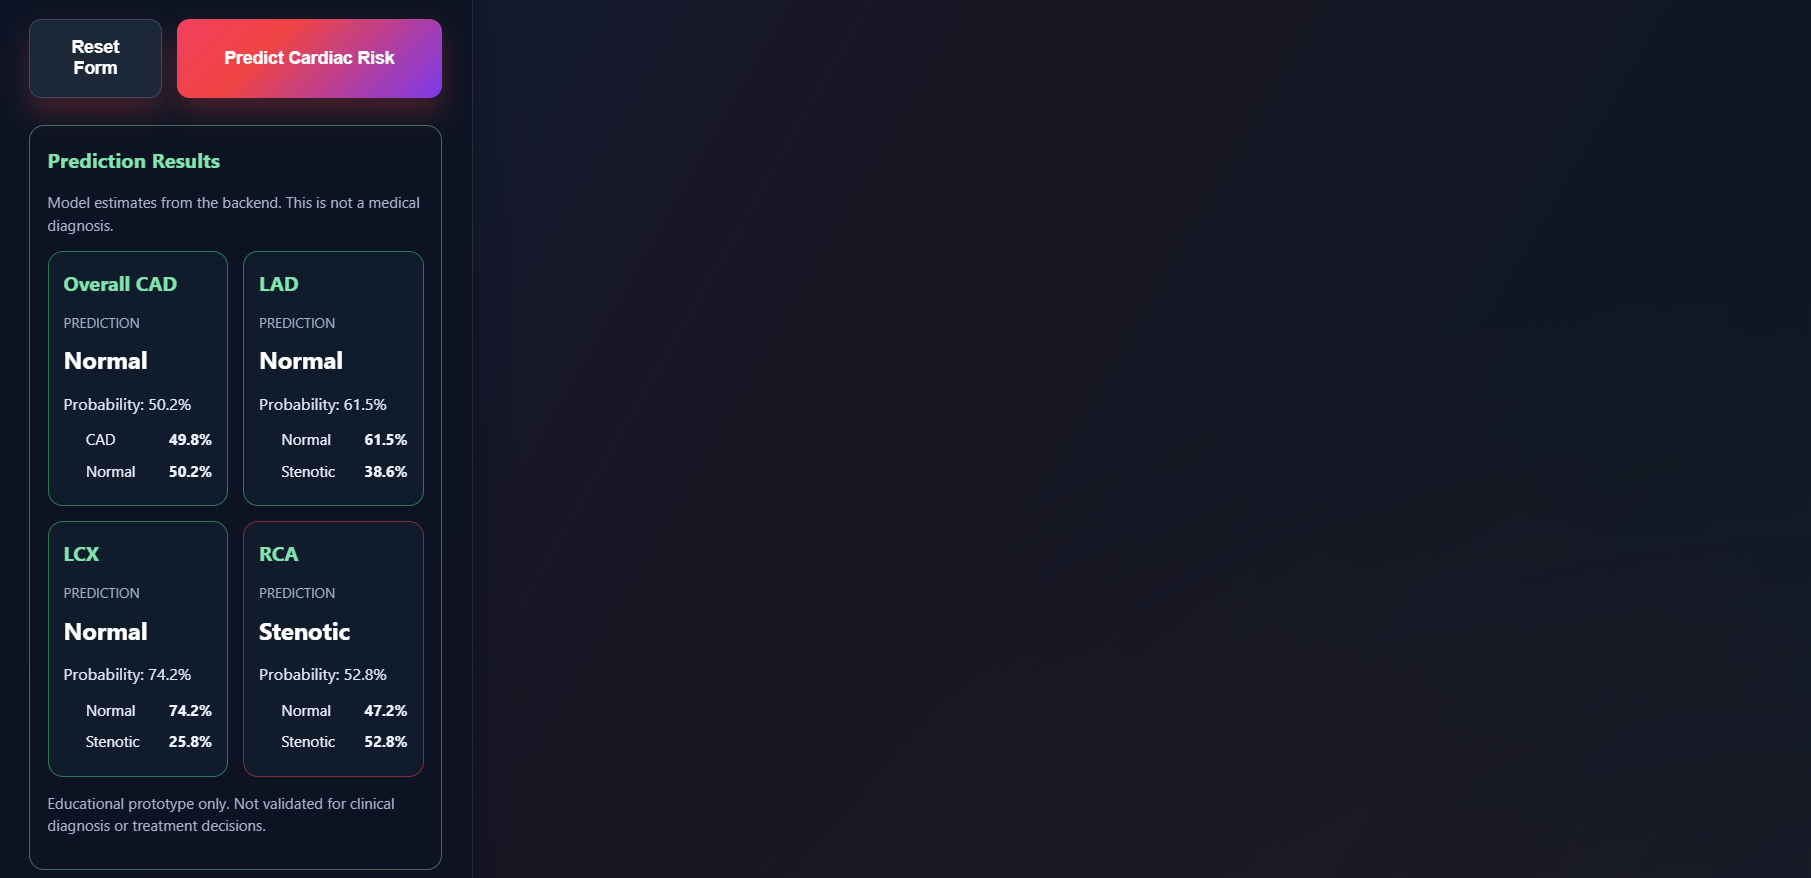
We use machine learning classification techniques to estimate:
- Overall Coronary Artery Disease (CAD) risk.
- LAD stenosis probability.
- LCX stenosis probability.
- RCA stenosis probability.
The models are evaluated using standard classification metrics to understand their performance.
- Interactive 3D Heart Visualization
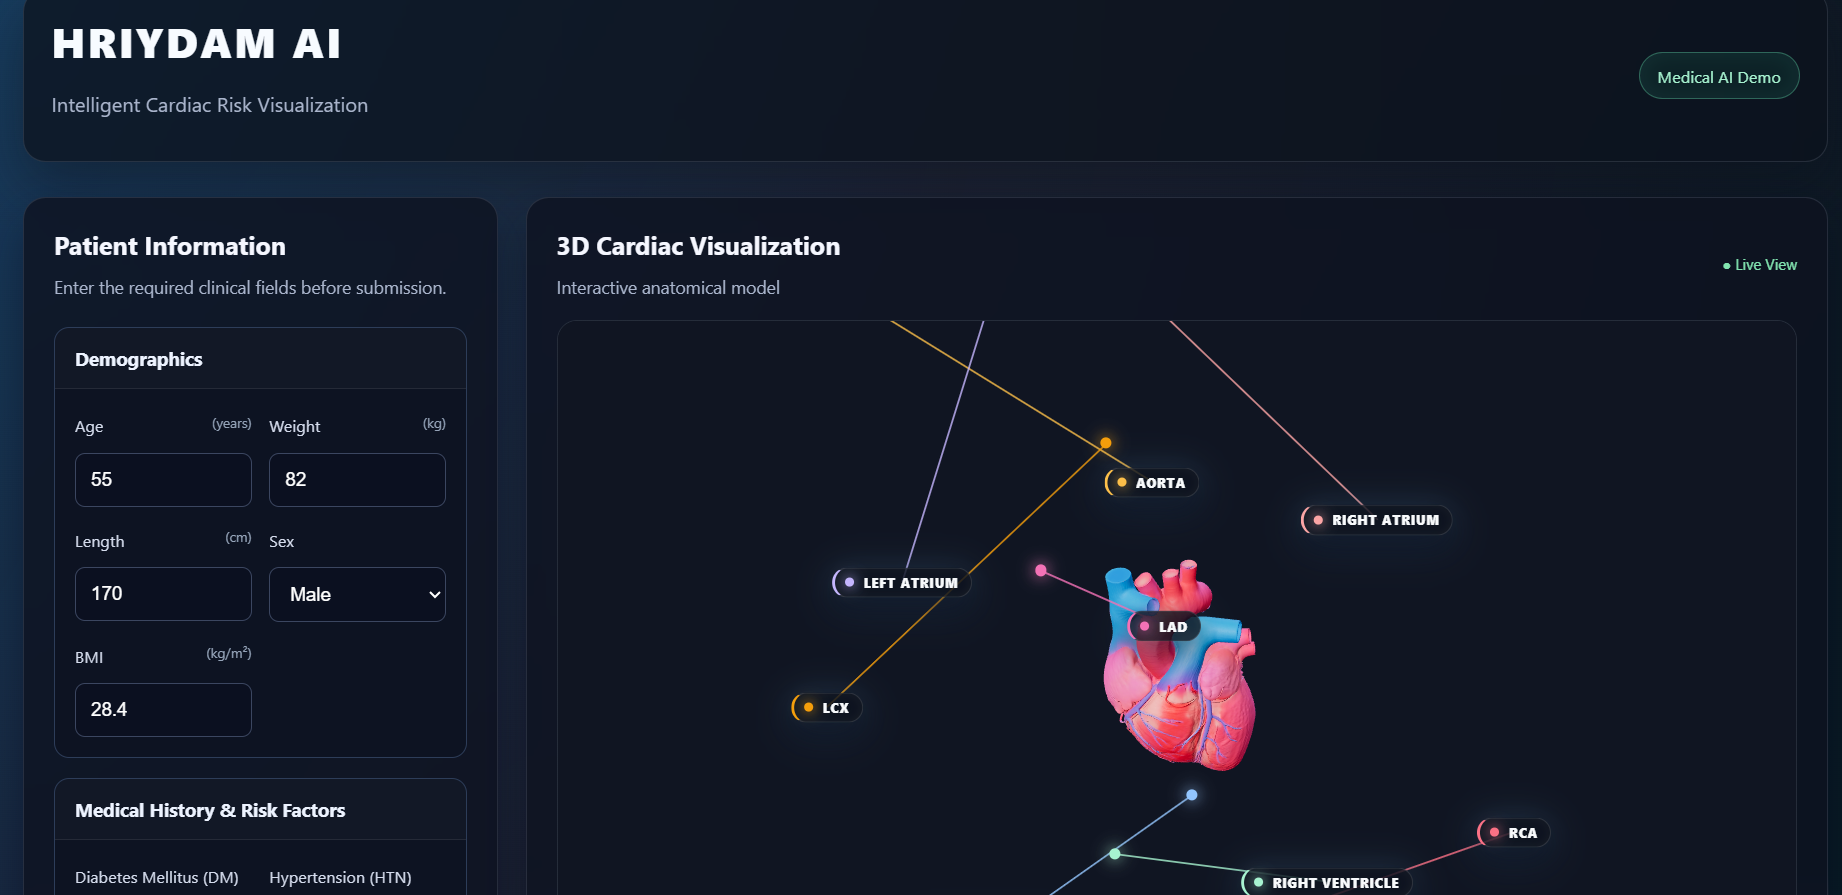
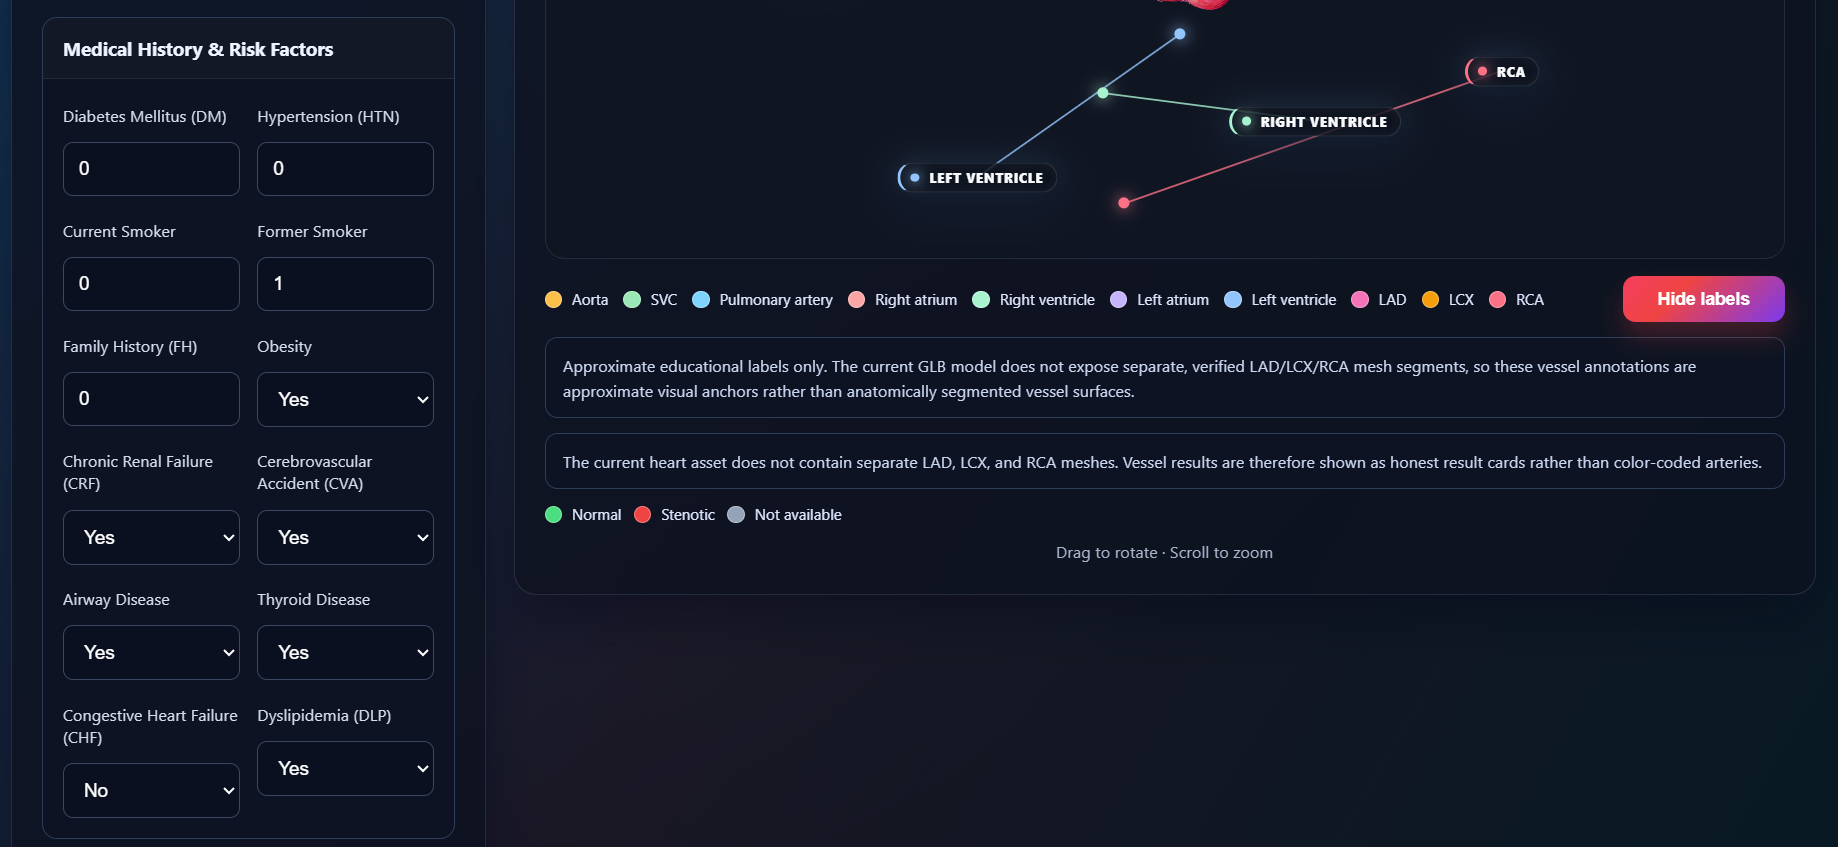
We aim to integrate an interactive 3D heart model that allows users to rotate, zoom, and explore different coronary artery regions.
Color-coded visual indicators represent the predicted risk levels for LAD, LCX, and RCA, helping users understand the model's output visually.
- Explainable AI Dashboard
The dashboard is designed to display prediction results, relevant clinical measurements, and feature contributions using explainable AI techniques such as SHAP.
This helps make the model's predictions more understandable and transparent.
- Application Integration
The planned application architecture connects a Python-based machine learning backend with an interactive web frontend, bringing predictions, explanations, and 3D visualization together.
🚧 Challenges We Faced
Developing HRIDYAM AI involves several technical and design challenges.
- Clinical Data Complexity: Understanding medical features and preparing clinical data in a suitable format for machine learning requires careful preprocessing.
- Data Leakage: We needed to ensure that target-related information was not accidentally included in model training.
- Prediction Reliability: Evaluating multiple classification models and selecting suitable performance metrics is important, especially when working with medical datasets.
- 3D Visualization: Representing coronary arteries and their risk levels in an understandable 3D environment requires careful visualization design.
- Explainability: Making machine learning predictions understandable without oversimplifying clinical information is another important challenge.
- System Integration: Connecting the machine learning pipeline, backend API, frontend dashboard, and 3D visualization requires coordination between multiple technologies.
These challenges helped shape our development approach and encouraged us to focus on both technical functionality and user understanding.
🚀 What's Next?
We aim to improve HRIDYAM AI by exploring better prediction models, more detailed explainability, improved 3D anatomical visualization, and a more intuitive user experience.
Our long-term goal is to make complex cardiovascular risk information easier to explore through the combination of AI and visualization.
HRIDYAM AI — BECAUSE EVERY HEART MATTERS.
Disclaimer: HRIDYAM AI is a research and educational prototype. Its predictions are intended for demonstration and decision-support exploration only. It is not a substitute for professional medical advice, diagnosis, or clinical imaging.
Built With
- artificial-intelligence
- css
- data-visualization
- fastapi
- html
- javascript
- machine-learning
- numpy
- pandas
- plotly
- python
- react
- react-three-fiber
- rest-api
- scikit-learn
- shap
- three.js
- uci
- vite
- webgl

Log in or sign up for Devpost to join the conversation.