-
-
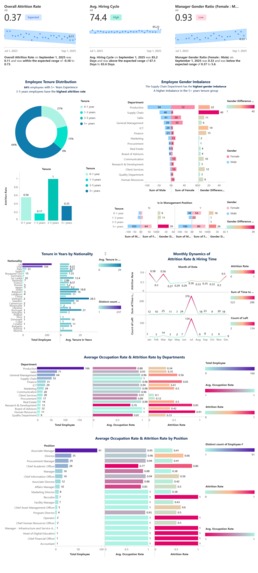
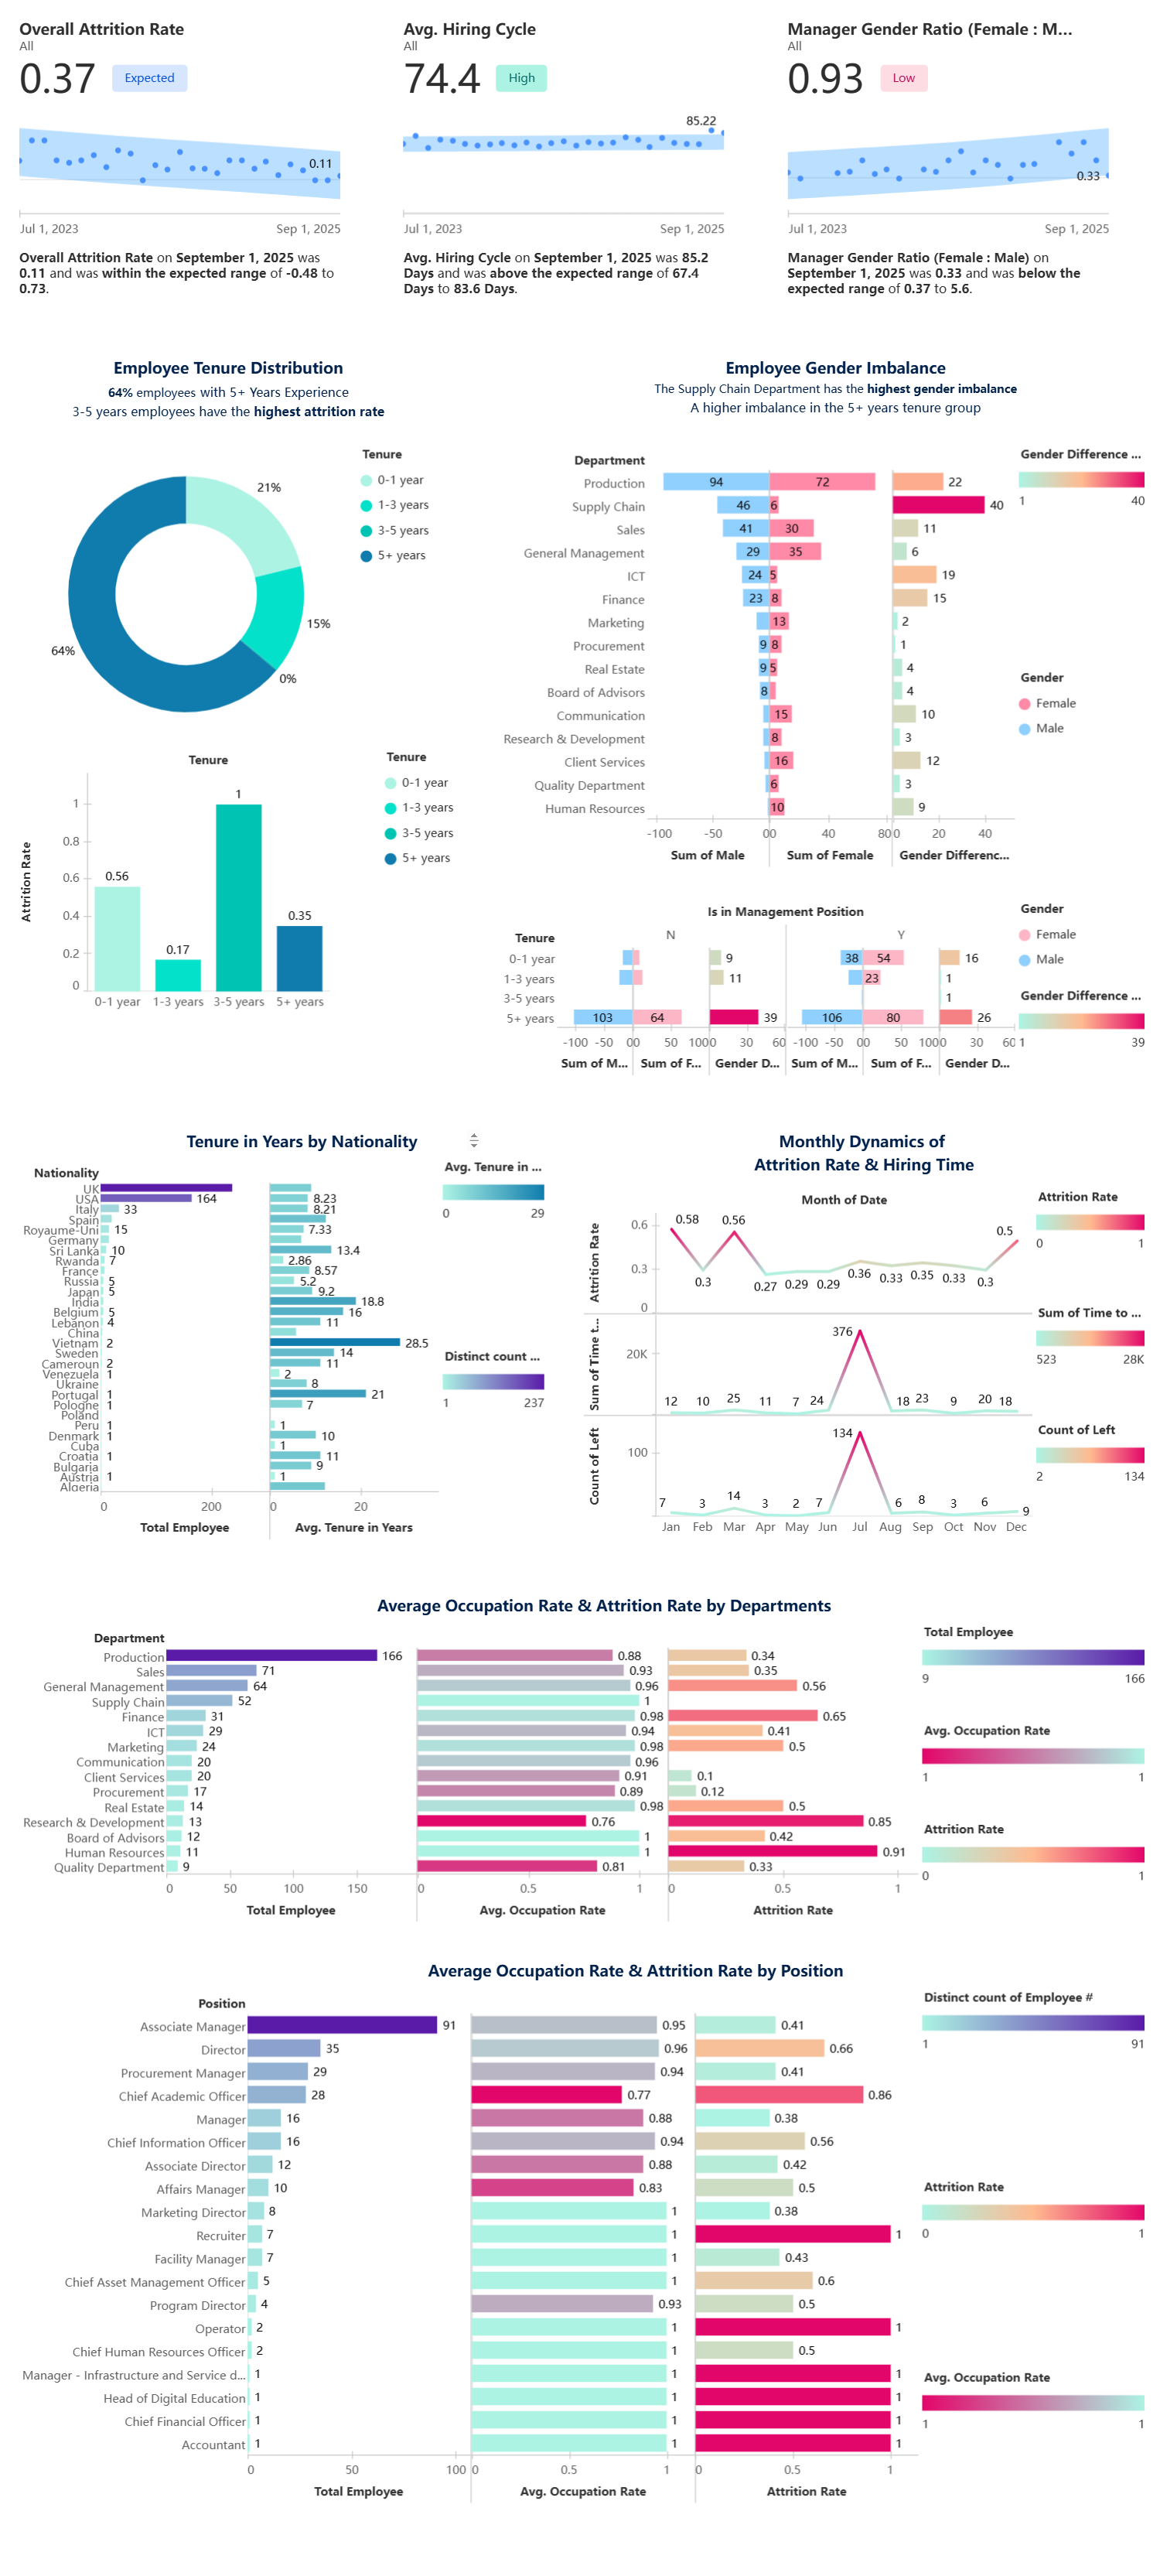
Overall HR Dashboard, downloaded from Tableau Next of Salesforce.
-
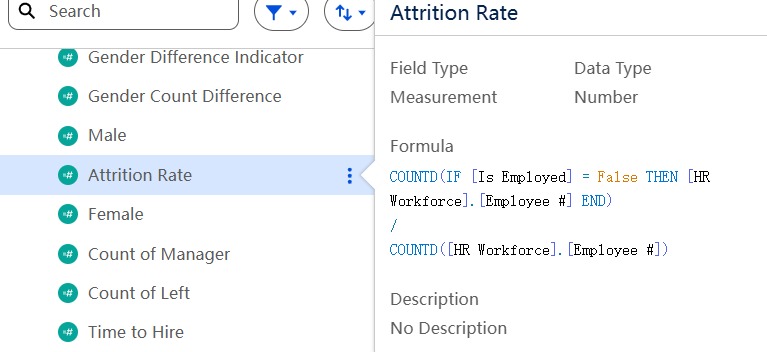
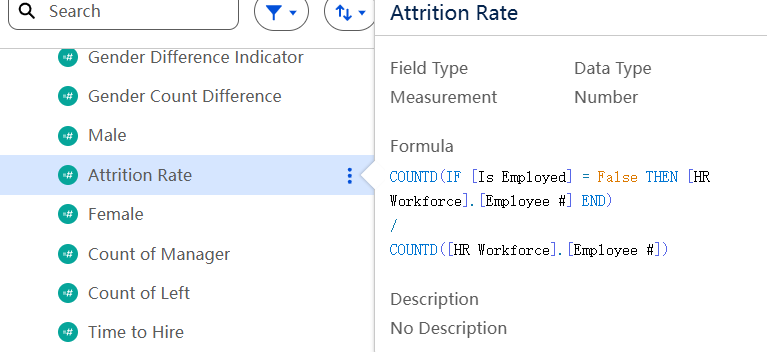
Attrition Rate Calculation Field
-
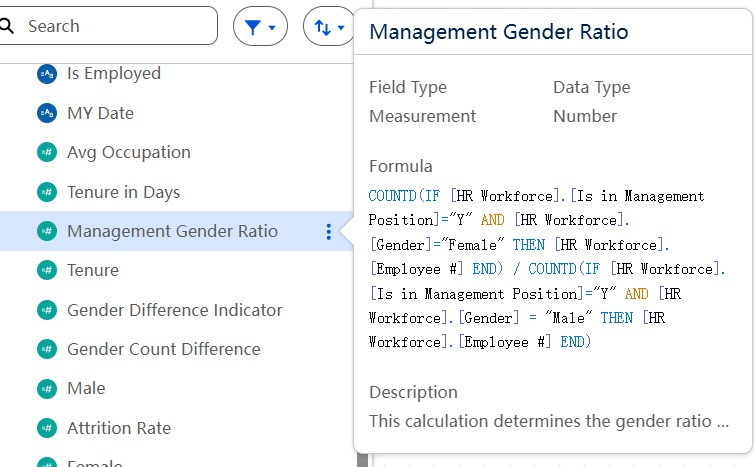
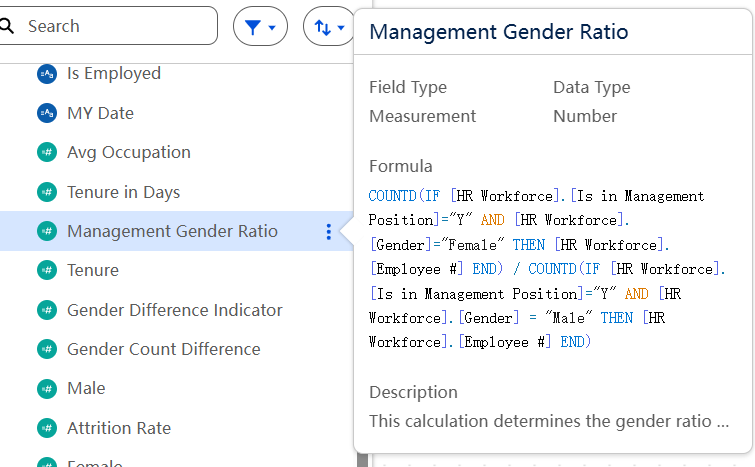
Gender Ratio of Management Position Calculation Field
-
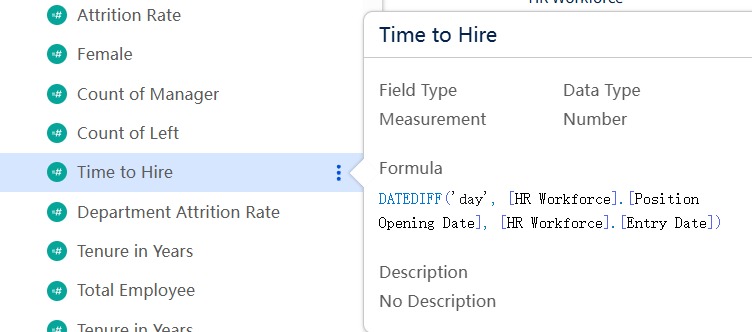
Hiring Cycle Calculation Field
-
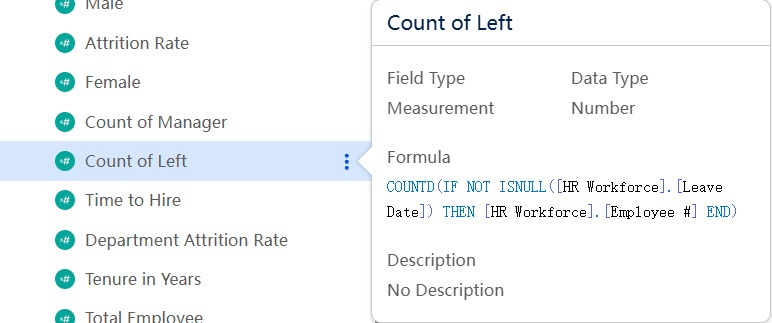
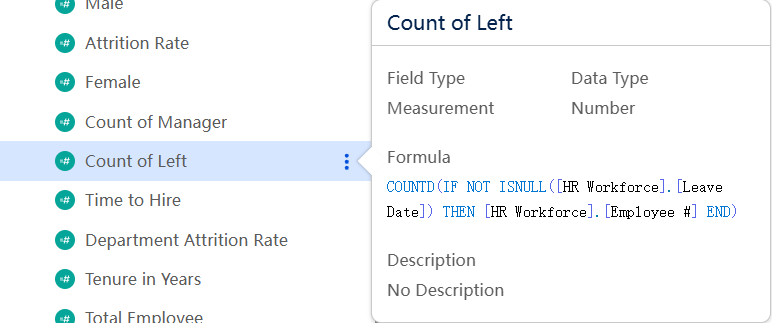
Count of Left Employees Calculation Field

Inspiration
Investigate the factors affecting HR decisions from multiple dimensions.
What it does
It's just a dashboard that reveals the attrition rate, hiring cycle, tenure level, gender imbalance, and the number of employees in each department/position within the company, as per the dataset. It can act as a helper for HR to make some data-driven decisions. Asking the following main questions in the initial phase:
- Loss of human resources: Which apartment runs off of human resources? What positions of employees are likely to leave? What is the total attrition rate of this company?
- Variety balance: How is the gender imbalance in each department? How is the nationality imbalance in this company?
- The Tenure The distribution of tenure level? The attrition rate of different tenure levels?
How I built it
I use Tableau Next in Salesforce with the dataset "HR Workforce". There are some core calculation fields I created, including:
- Tenure Level in YEAR (0-1 year, 1-3 years, 3-5 years, 5+ years)
- Attrition Rate
- Hire Period
- Gender Count Difference I use light green-yellow-red color scheme to present any degree of caution.
Challenges I ran into
One of the aspects is that Tableau Next is not that functional compared to Tableau. It lacks in customer design and grouping. I have to give up some of my design ideas when making the chart. The advantage is that there is AI Einstein to help with writing calculation fields and Agentforce to validate the data.
Another aspect is that it can not export as an HTML file (at least I have tried it), so I won't integrate it into a single website for a better user experience.
Accomplishments that we're proud of
The only accomplishment that I have is that I just finished making a simple dashboard, thankfully.
What I learned
I have learned how to make a metric, how to connect to the Data Lake Object and make a Data Model Object from mapping, and how to work on Tableau Next on Salesforce.
What's next for HR Workforce Dashboard
Probably I can enhance the following points:
- Improve the user experience by integrate it to Tableau so that it can generate an HTML file to make a website.
- Make the charts more clearly and correctly visualize the information.
- Provide decision strategy by creating a predictive model with learning the patterns of metrics.
Log in or sign up for Devpost to join the conversation.