-
-

BRIDGE: Bridge the gap
-

Articles Tab
-

Visualization Tool: Average salaries per department
-

Recommendations to improve company equity based on data
-

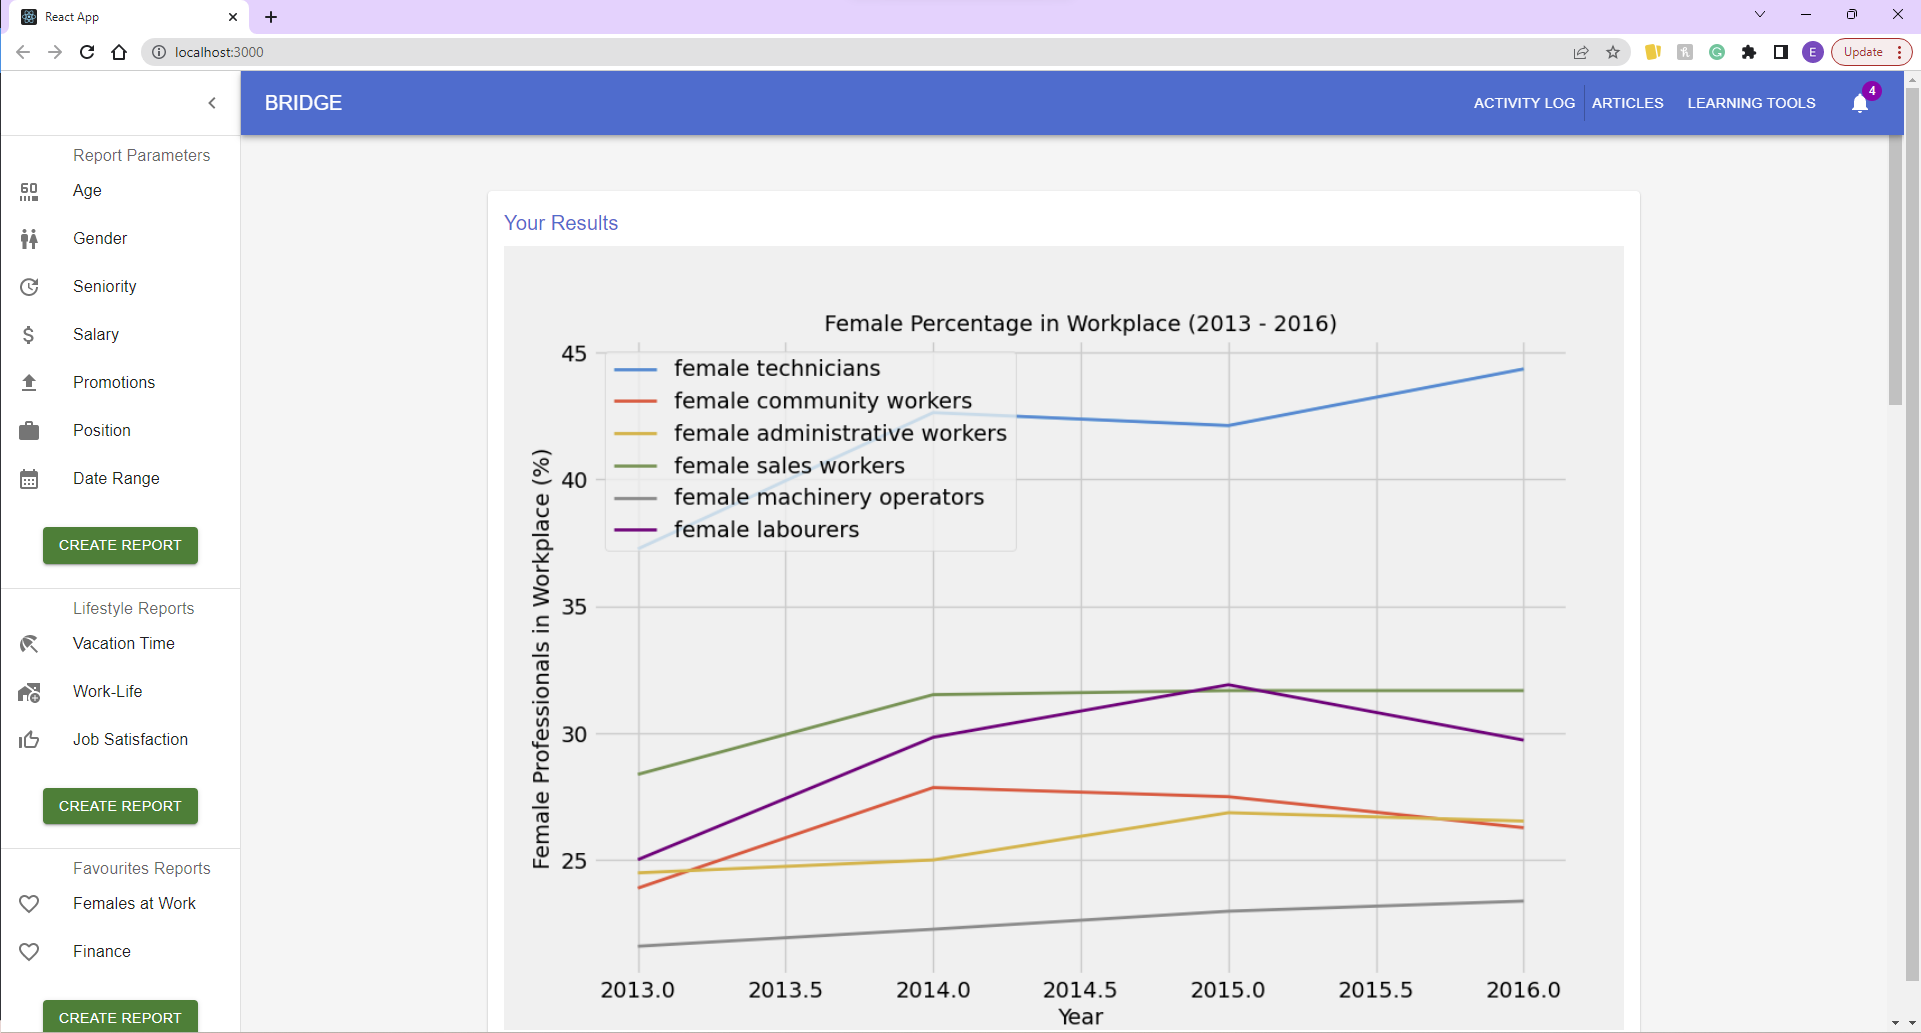
Visualization Tool: Female % per department overtime
-

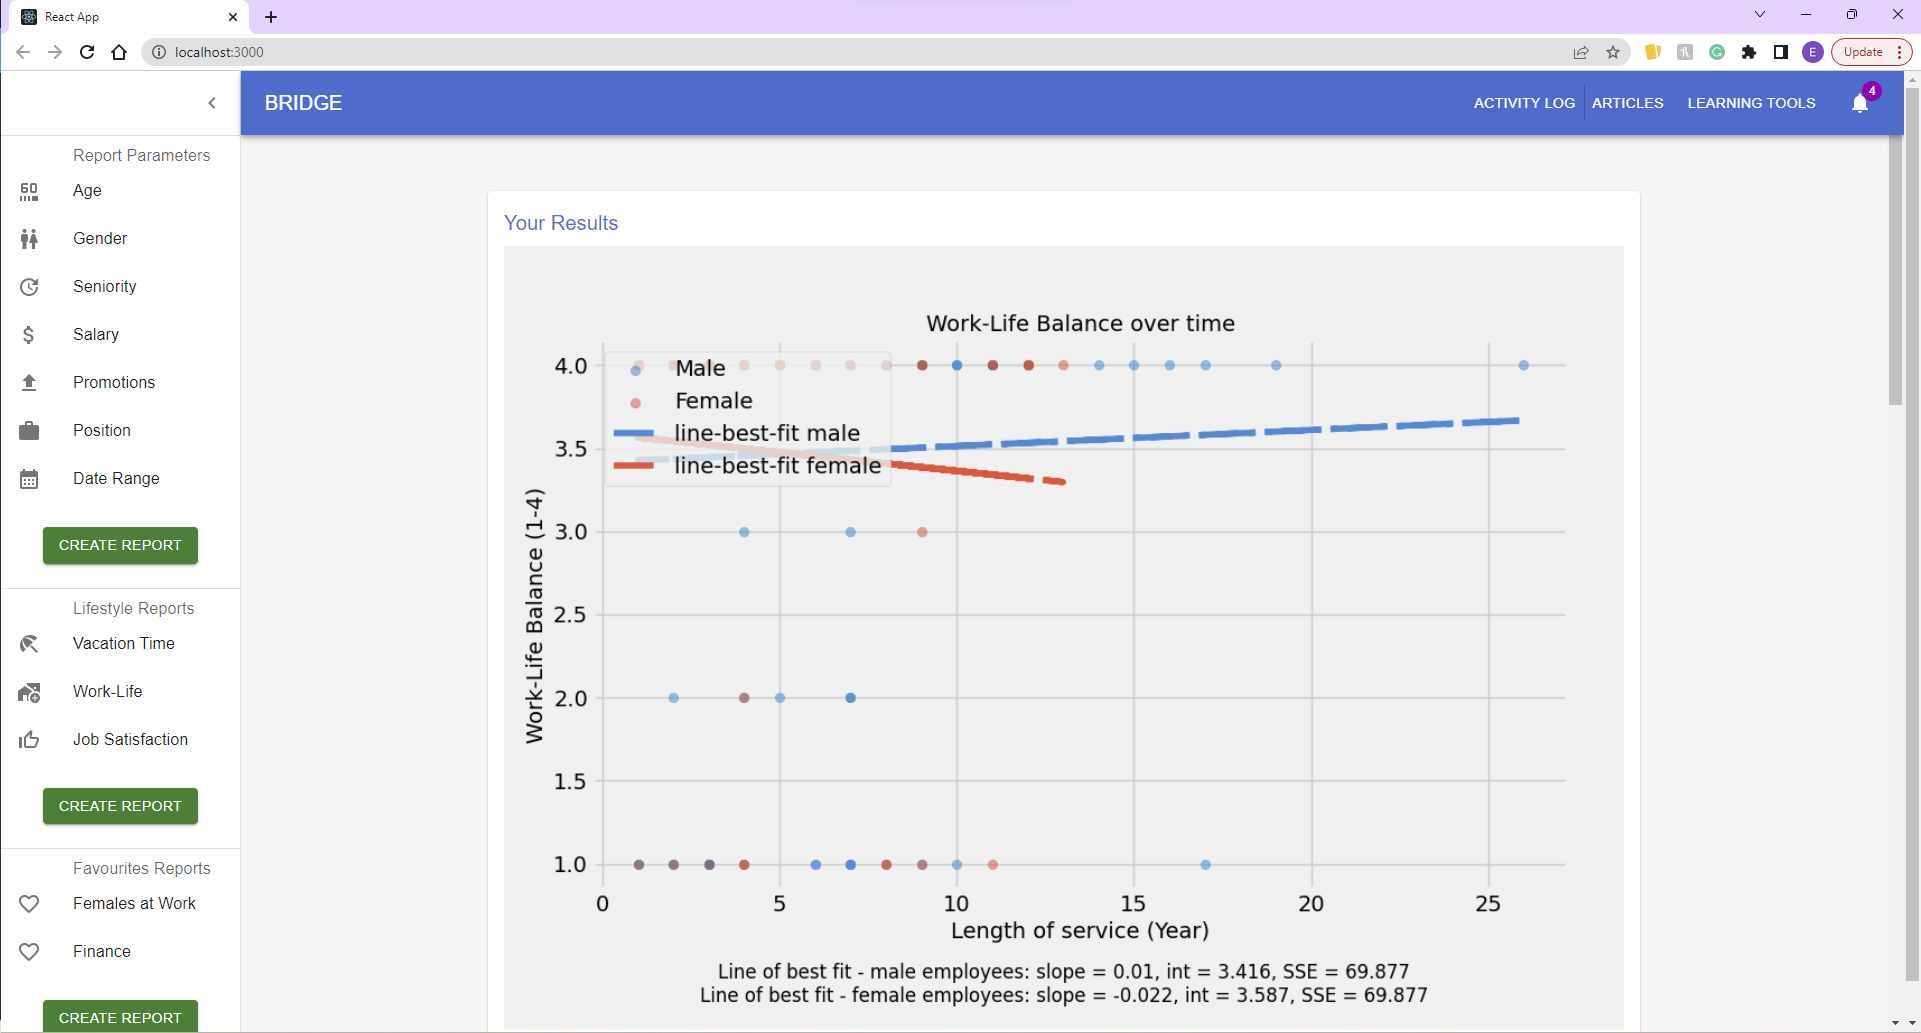
Visualization Tool: Work Life Balance of employees
-

Visualization Tool: Men to Women ratio per department
-
 GIF
GIF
BRIDGE: Visualization tool and Recommendations
-
 GIF
GIF
BRIDGE: Log Activities and Articles


Inspiration
While conducting our initial research to inspire an idea, one particular article had caught our attention.
Its' headline, was almost alarming: Gender pay gap in U.S. hasn't changed much in two decades
The gender gap in pay has remained relatively stable in the United States over the past 20 years or so. In 2022, women earned an average of 82% of what men earned, according to a new Pew Research Center analysis of median hourly earnings of both full and part-time workers. These results are similar to where the pay gap stood in 2002, when women earned 80% as much as men.
At the heart of this issue, we believe that companies could be more transparent about their hiring practices but also monitor the diversity and equity of their employees more regularly, striving to Bridge the gap and promote fair treatment of all employees, no matter their gender or background.
BRIDGE: Features
Using technology, how can we make real change and help promote equity at the workplace?
Introducing BRIDGE.
BRIDGE is a dashboard tool for a company's HR team to easily spot unconscious bias that may be happening, in a quantitative and effective way. Let's break it down:
1. Visualization tool of the company's employee demographics Quantify data about employees to visualize trends in hiring metrics and reveal potential biases. Our program allows for a selection of parameters (Age, Gender, Salary, Role, Seniority, Work-Life Balance, etc.) in which the user can choose which variables to monitor. By specifying the parameters they are interested in, our algorithm in the backend generates insightful graphs to visualize the data and identify potential areas for improvement.
2. Recommendations for areas to improve Suppose the user selects three basic parameters: Gender, Role, Salary. A bar graph is generated of the average salary of each gender across different roles at the company. Not only does BRIDGE provide us with this insightful visualization, but it would analyze the data and suggest areas for improvement. Suppose in one of the departments, men get paid a lot more on average than women, our algorithm would point this out and suggest resources to consider, such as articles from the "Articles" tab. To address this issue, it could recommend the company's HR team to host bi-weekly diversity panels, invite inspirational women keynote speakers, or organize social events to promote employee morale
3. Articles/resources on gender biases or fairness at the workplace Based on the information revealed by the visualization of the data, companies would be able to implement change in several ways. In the "Articles" tab of the program, the HR team has access to useful articles that retain relevant information to progress in the right direction. There is a storage of useful and educational content, equipping the HR team with the best tools in the industry. A "Learning Tools" tab is also available for the HR team to implement in case they have their own set of training modules
4. Activities Log that keeps track of company's progress in making real change happen With every action a company takes to bridge the gap between their workers, they get a step closer to realize a fair, empowering and safe work culture. The "Activities Log" tab keeps track of recent news or events that have happened in the company. It celebrates the promotions, awards, and contributions of its employees. With the help of their own HR team monitoring this log, companies can set clearly defined interim milestones and deadlines to achieve diversity and equity. They can utilize the "Activities Log" to continually measure themselves against their targets. Even better, on a quarter-yearly basis, it would be great for the HR team to review the log to see what the company has tried and identify what has worked and what has not.
How Bridge applies to the themes at Avanade International Women's Day Hackathon
Before implementing our project, we had worked hard on our vision and we wanted to have a strong purpose as to how BRIDGE would address the topic of #EmbracingEquity. In essence, we outlined the following issues we wanted to address specifically. Here is how our program addresses them:
| Issue Addressed | BRIDGE Feature | Description |
|---|---|---|
| 1. Review salaries and standardise pay between groups of employees | Graphing employee metrics | Our graphing tool allows for building insightful graphs and help HR visualize the health of their company culture in a quantitative way. By visualizing simple numbers (such as Job Satisfaction, Salary, Headcount etc.) into powerful graphs, we believe it would incentivize and make the data much more intuitive to the HR team. This would make it much easier for them to monitor employee satisfaction on a regular basis. They would be able to choose metrics of their employees, compare and monitor statistics to help them verify that they are treating staff equally and fairly. |
| 2. Be Transparent | Graphing employee metrics | Our graphing tool provides insightful metrics about the company's employee statistics. Our tool also allows for easy downloading of the graph generated. The company may decide to keep the graphs generated internal to the HR team or release it to the public for interviewees or any stakeholders. Be transparent and take action. Accompany the information with a clear action plan on the steps you are taking as an employer to close the equity gap, with clear targets and milestones. |
| 3. Diversify the board to give equal opportunity | Recommendations based on graphs | Based on the graph generated, our program would make intelligent recommendations based on any trends or patterns conveyed by the graph. The Recommendation feed would be an insightful tool in helping HR manage a healthier work place environment where women or any minority groups have equal opportunities to thrive and succeed. If the general trend is that women tend to get paid less for an equal position at the company, the Recommendations feed would point this out and suggest possible next steps to take action on this issue. |
| 4. Encourage and Support women to progress into more senior roles | Recommendations based on graphs, Articles | If women are not in leadership positions at the company, our graphical visualization should reveal this bias. To tackle the issue, there are articles provided to empower female employees who are applying for promotions and asking for pay raises. When a promotion is advertised, line managers should be encouraged to check whether their high potential female colleagues have applied and if not ask why. |
| 5. Provide training on unconscious bias | Articles, Activities Log | The Activities Log tracks the company's efforts in bridging the gap between different groups of employees at the company. Any accomplishments should be listed and promoted there. Although this does not guarantee that attitudes will change, it does help employees to understand their biases and to work towards eliminating them. |
| 6. Have a clear policy on discrimination | Articles, Activities Log | There are readily available resources in the "Articles" tab to address this issue. The HR team is encouraged to create a clear, unbiased, non-retaliatory discrimination policy that ensures employees have a proper way to comment or report on inappropriate treatment in the workplace. |
| 7. Promote a culture of meritocracy | Activities Log | Promote a culture where great ideas come from all levels, genders and races and all voices are welcome and respected around the table. Companies can set goals in the "Activities Log" and work towards achieving meritocracy one step at a time. Promote eschewing traditional board candidates — retired chief executive officers, who are predominantly older white men — and opting for diverse members, many of them first-timers with no experience. |
| 8. Progress towards fairness and inclusivity in the workplace | Activities Log | Set employee diversity targets, broken down by business lines and functions. The company should have clearly defined interim milestones and deadlines, so that they can continually measure themselves against their targets. HR can keep track of their progress in the “Activities Log” page. Furthermore, managers and decision makers are held responsible and accountable for meeting those targets. |
| 9. Implement gender neutral recruitment processes | Resources provided for a more equitable hiring process | The "Learning tools" tab comprises of useful training tools that are always accessible to the HR team. In essence, any resources to aid in making the workplace fair and equitable should be stored there. For example, to make the hiring process much fairer, the HR team should have a resource to ensure there is a balanced number of female and male interviewers, such that interviewees may be judged by a diverse panel of the companies’ leadership. |
How we built it
Utilizing React for the front end, we used several React components and frontend libraries such as material UI. We were able to customize and add components with the knowledge of JavaScript, HTML and CSS.
We pulled 2 datasets from Kaggle to act as our mock database to graph visualizations:
Finally, we used numpy, matplotlib, pandas as our graph visualization tools to generate graphs of the employee metrics. This is all in Python.
What's next for BRIDGE
Implement a dynamic database with GET and PUT endpoints
- Currently, the employee's data is stored in a csv file that we are parsing through to generate graphs. Ultimately, the goal is to integrate a relational database custom to the company's employee data.
Refactor program code and test coverage
- Improve upon the software design choices and run through more test coverage of any potential errors.
Improve and add more functionalities to BRIDGE
- Add more interactive components to the program, such as a notification system, a more diverse set of graphs (3D, interactive, statistic models etc.) to offer even more insight into specific metrics of the employee dataset.
Implement AI to make relevant recommendations
- Develop a machine learning model that can train on different sets of graphs and make accurate recommendations for areas of improvement. This would require a more complex implementation utilizing artificial intelligence and a more rigorous analysis of the data in a statistical sense.


Log in or sign up for Devpost to join the conversation.