Inspiration
Since our team are composed of international students and non-native speaker in English, the theme "Minority status and Language", which is the third theme in the data set of Social Science track, raised our interest to work on this project.
What it does
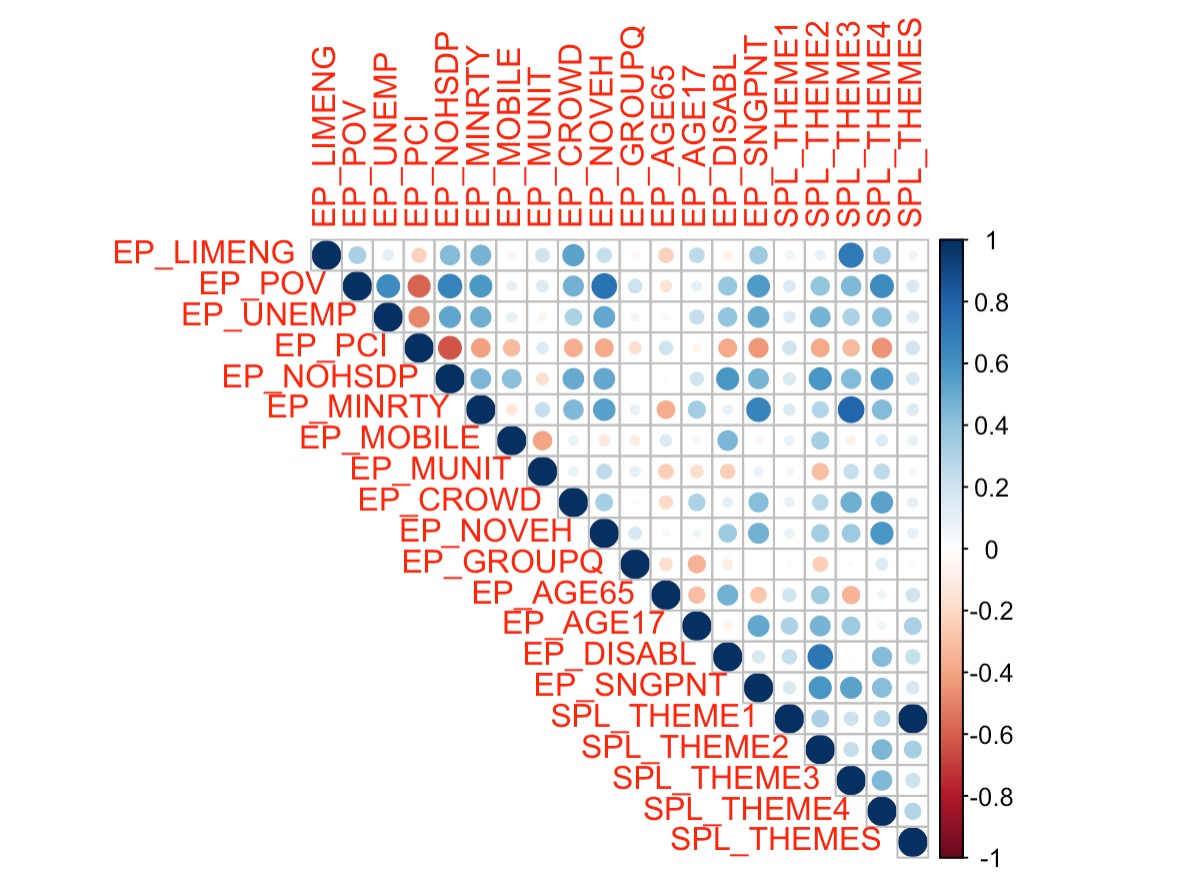
We analyze the basic correlations between the final SVI index and the various variables that it's composed of; build linear models between variables we are interested in; make hypotheses towards some interesting points we see in the process of analysis; give suggestions towards the government according to our outcomes of analyzation.
How we built it
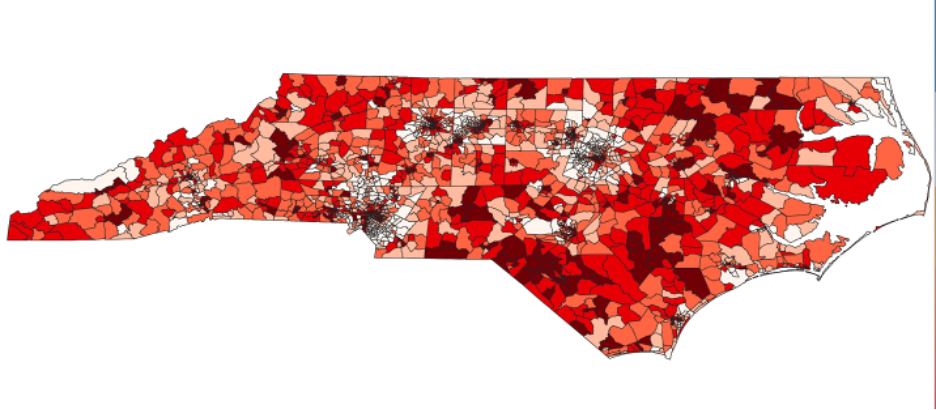
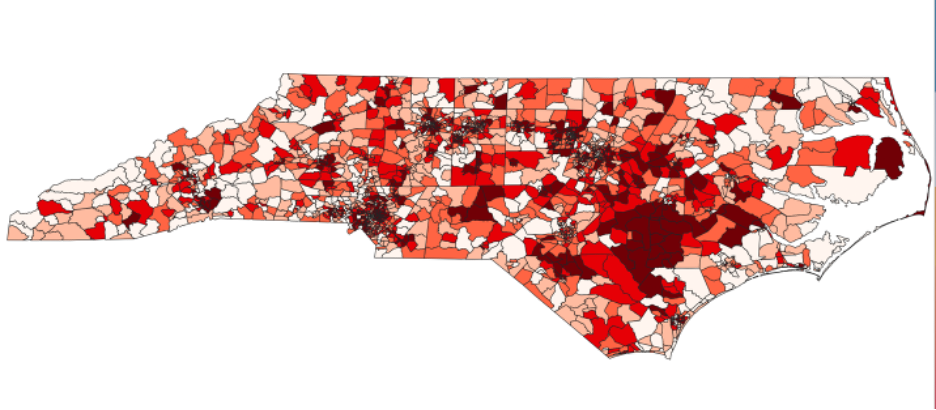
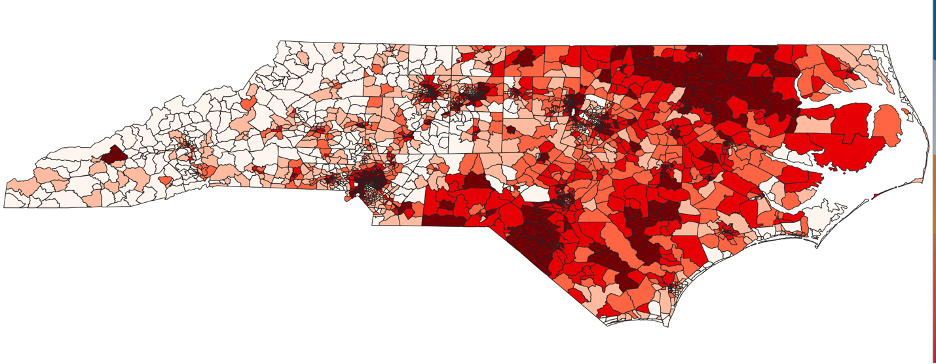
Using R, we basically built our project on constructing linear models, doing correlation analysis, and visualization of data. Plus, we also used GIS (Geographic Information System) to visualize the data we gained based on the map of NC.
Challenges we ran into
By seeing the data set, we found it so huge with so many variables and data records. Only two of us had experience using R in programming before, and none of us has experience in processing such a big dataset including over 60 thousand records. At first, we also do not have a clear clue and theme of the concentration of our project because the data set has so many things that can be analyzed. Finally, we got our inspiration and decided on our theme by looking at many extra materials and information about this SVI index from youtube videos and the official website.
Built With
- gis
- qgis
- r
- rstudio


Log in or sign up for Devpost to join the conversation.