-
-
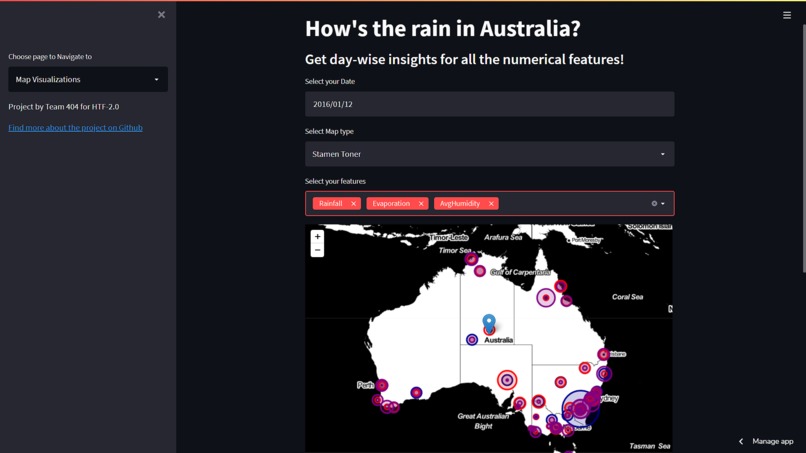
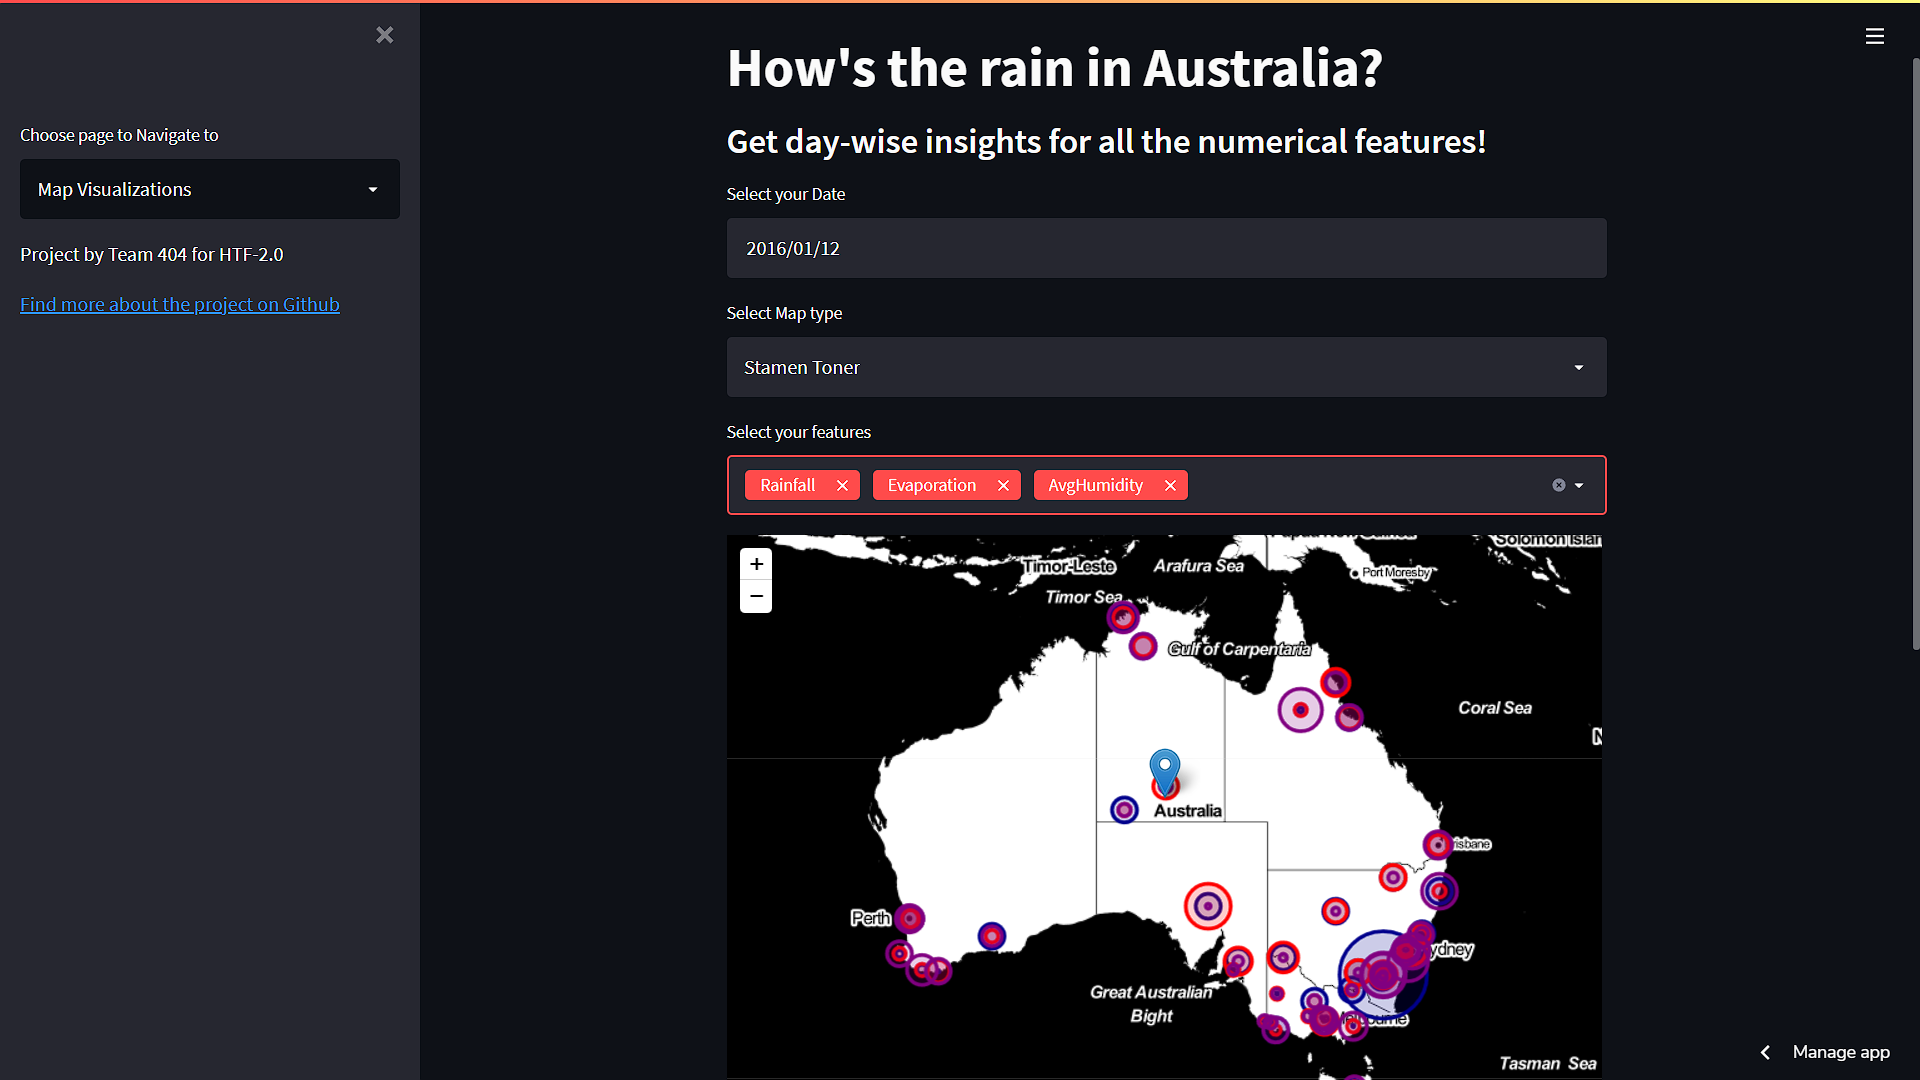
Maps and Features
-
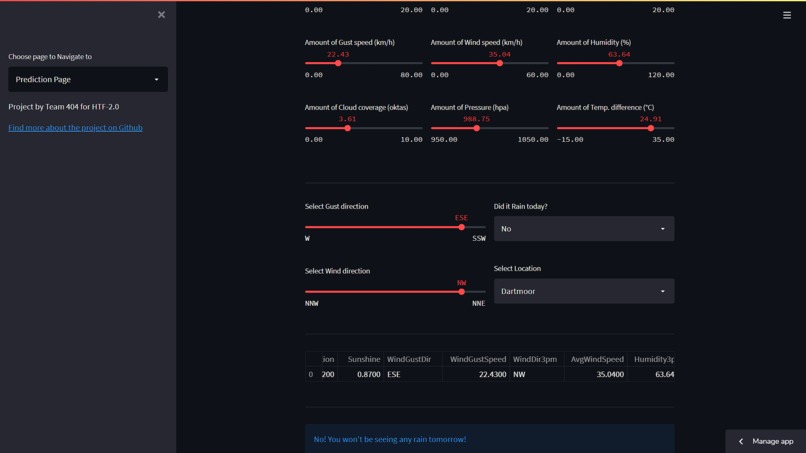
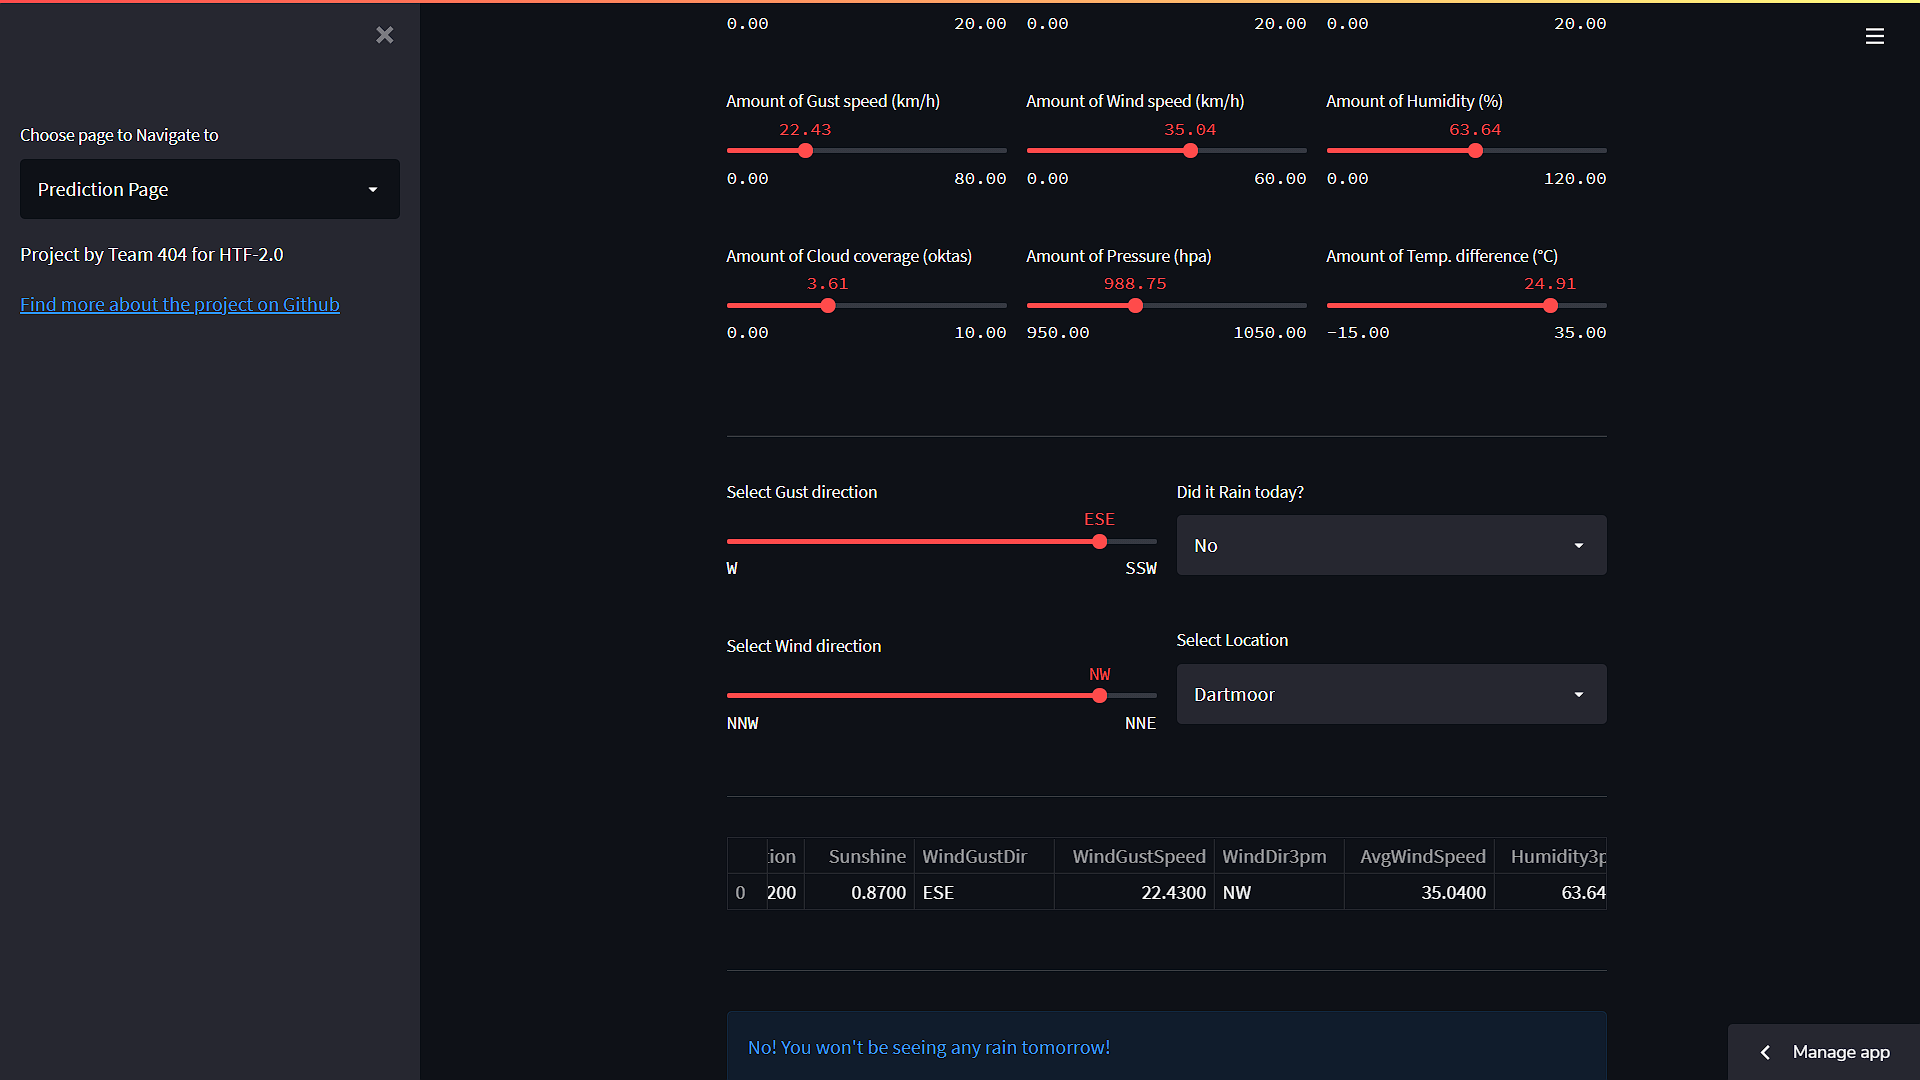
Predictions and Inputs
-
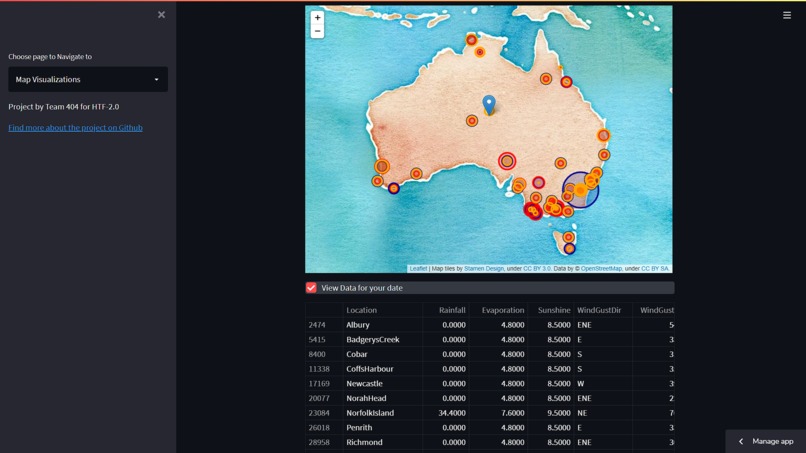
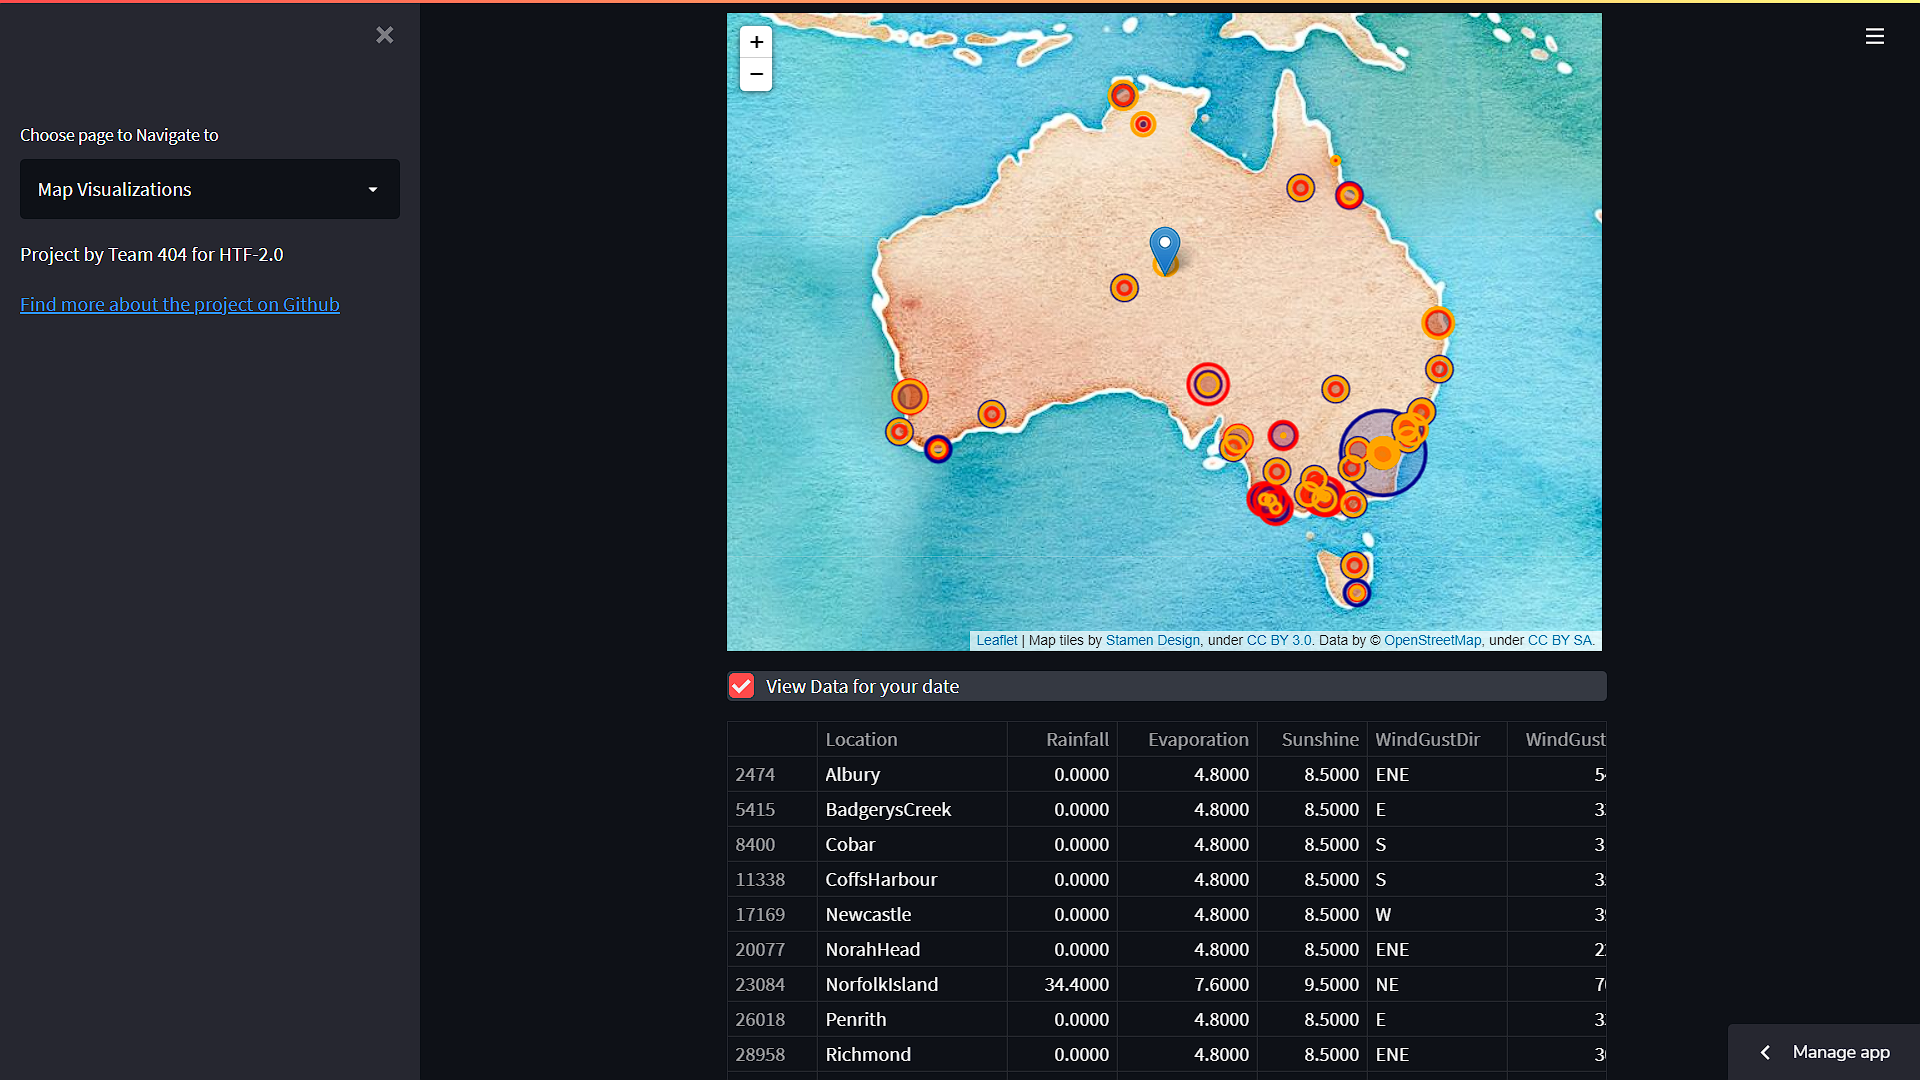
Maps and Data
-
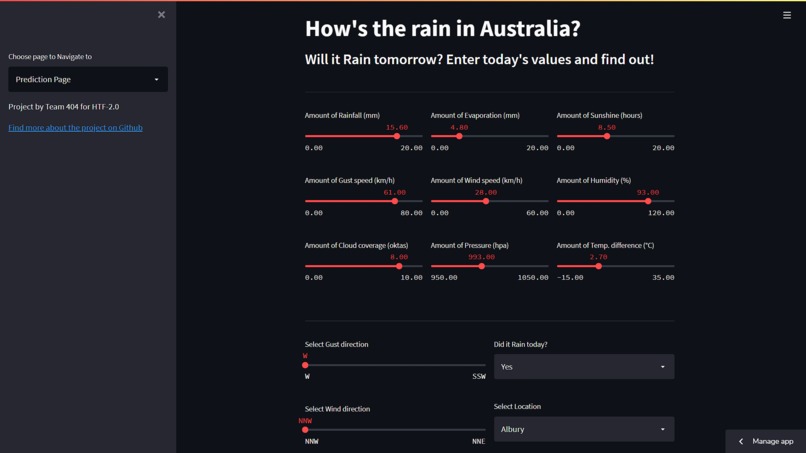
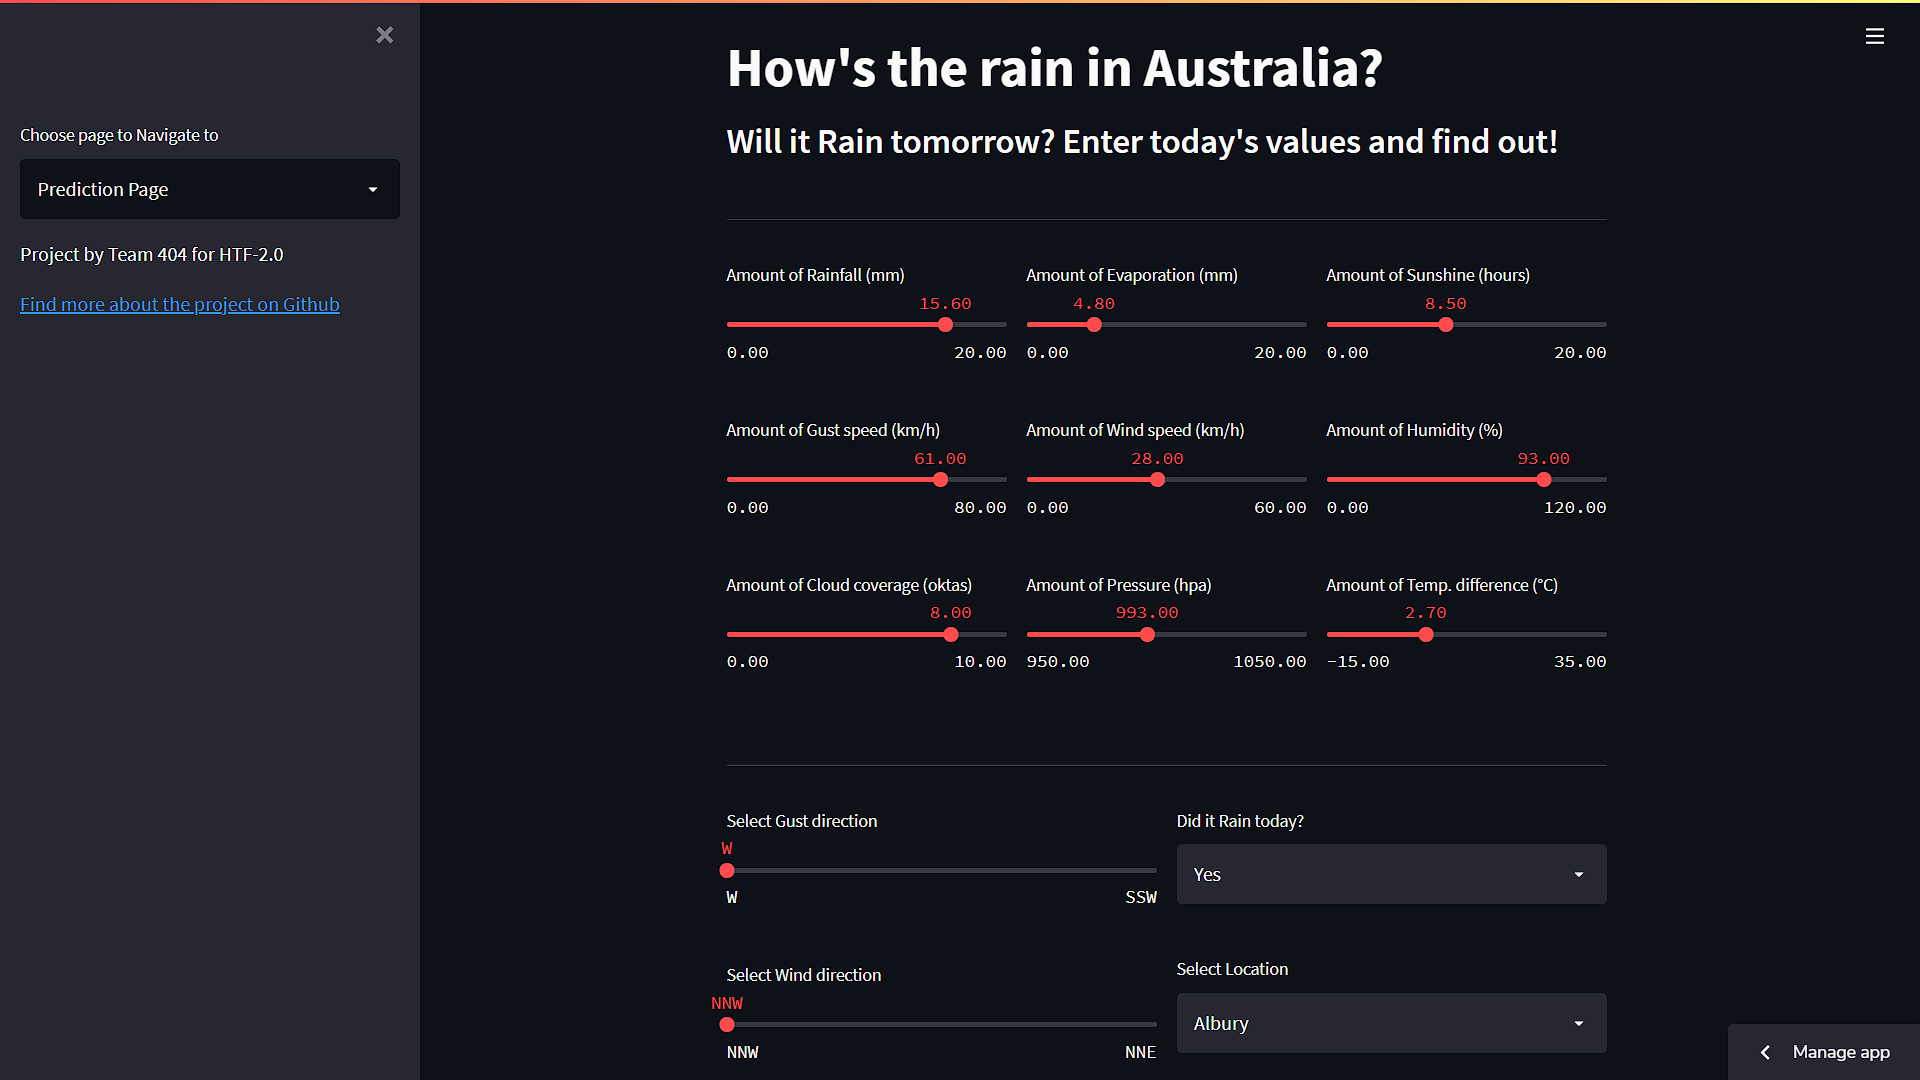
Input widgets and Features
Inspiration :
The unfortunate bushfires during 2019-2020 spiked some intrigue among people around the globe. Almost everyone knew what the situation was, how it was being taken care of, what precautions are to be followed but little did we know about the fact that bushfires have been an annual calamity in Australia for decades. And that begs the question of what is it that makes Australia so prone to such frequently occurring disasters.
Rain in Australia plays a bigger role than any other, it calms and eases the bushfires but also brings dangerous floods and storms with it. Yet, over the years, researchers and scientists have only found the level of precipitation to be decreasing with time. In fact, the overall average temperature of the continent has also increased during the period.
Here, we try to understand and work with the 'Rain in Australia' dataset and try to provide a simple platform for any user to interact and visualize various factors that affect the possibility of rain. Along with interactive and customizable maps, users can also try predicting a day after's rain by simply entering the present day's values.
What is HTRIA :
HTRIA, short for 'How's the Rain in Australia' is a project that explores and understands the rainfall patterns of 49 unique locations in Australia. One can find details pertaining to any location on any distinct day and also get predictions on the chance of rain for the day after.
Acknowledging the unpredictable weather conditions in the country, our model makes predictions by taking 15 features into account. You can find the public dataset here.
The machine learning model is saved into a
.picklefile (Pickle is a module in Python used for serializing and de-serializing Python objects. This converts Python objects like lists, dictionaries, etc. into byte streams, i.e. zeroes and ones.)Our Streamlit Web application consists of two pages.
- Predictions: Page where the user enters the values of all the required features and then our model predicts if it will (or) will not rain tomorrow.
- Maps: Page where the user can get day-wise insights of all the numerical features visualized on the interactive map of Australia.
What we learned:
Through this project, we gained a lot more information about the current state of the climate in Australia than we would have got from news articles and conferences.
From the technical point of view, we learnt how to develop and manage a multi-page streamlit web application and also for the first time tried implementing interactive maps using the folium library.
Apart from that we also got a chance to expand our knowledge in the field of Machine Learning and explore more ways of working with data.
Tech Stack :
Back-end :
- Pickle
- Scikit-Learn
- Machine Learning
Front-end :
- Folium
- Streamlit
Try it out yourself :
- Install Libraries :
pip install -r requirements.txt - Run the Main Application:
streamlit run app.py - If on the Predictions Page,
- Try adjusting values with sliders and select-boxes
- The predicted result will be displayed at the bottom
- Navigate to the Visualizations page using the sidebar
- If on the Visualizations Page,
- Pick a date from the data-picker by clicking on the date box
- Choose a Map Style from the select-box
- Choose any feature(s) and watch the map get populated with markers
- Move around the map using the pointer or zoom in and out
Challenges we ran into :
- Filtering out a handful of useful features from 25 of them
- Keeping the Layout clean and user-friendly
Accomplishments we're proud of :
- Being able to complete the project in 48 Hours
- Getting our hands dirty with a new library (Folium)
What's next for HTRIA :
- Plots and Charts visualizing features with each other
- Improving the accuracy and ease of use for the users
Team 404 :
Built With
- folium
- python
- scikit-learn
- streamlit


Log in or sign up for Devpost to join the conversation.