-
-
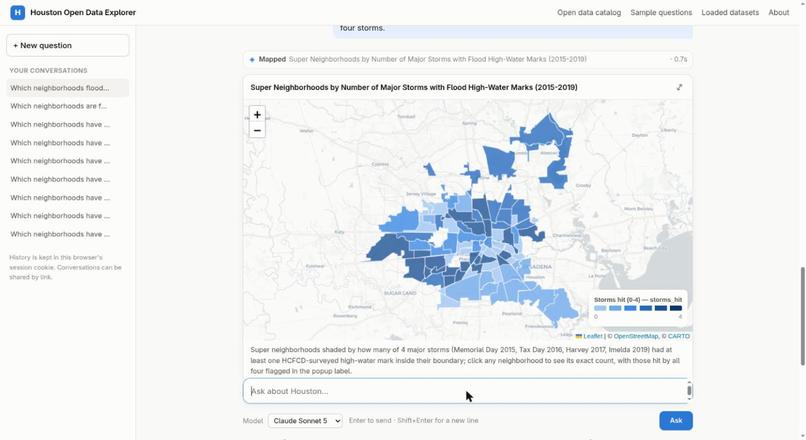
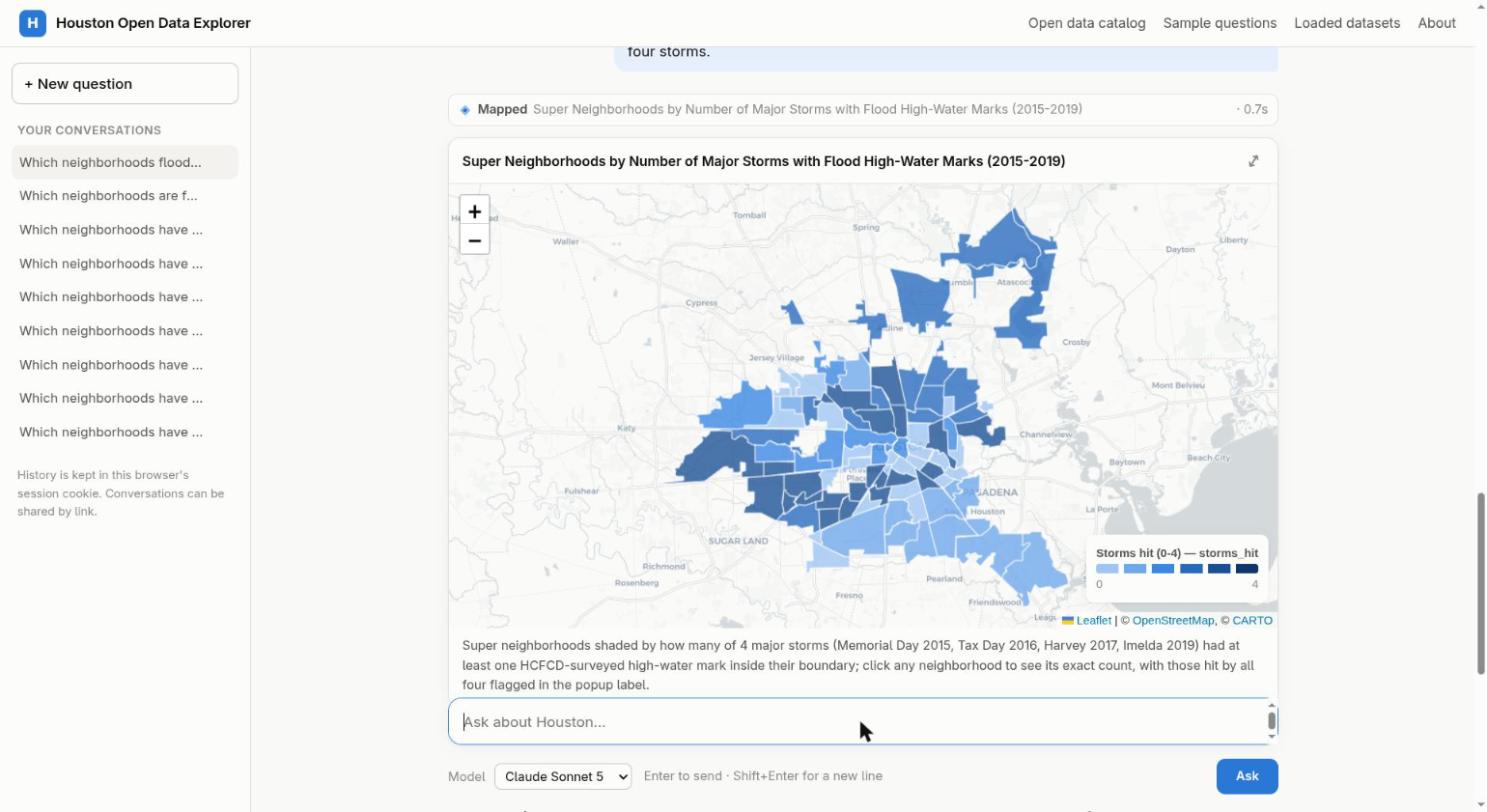
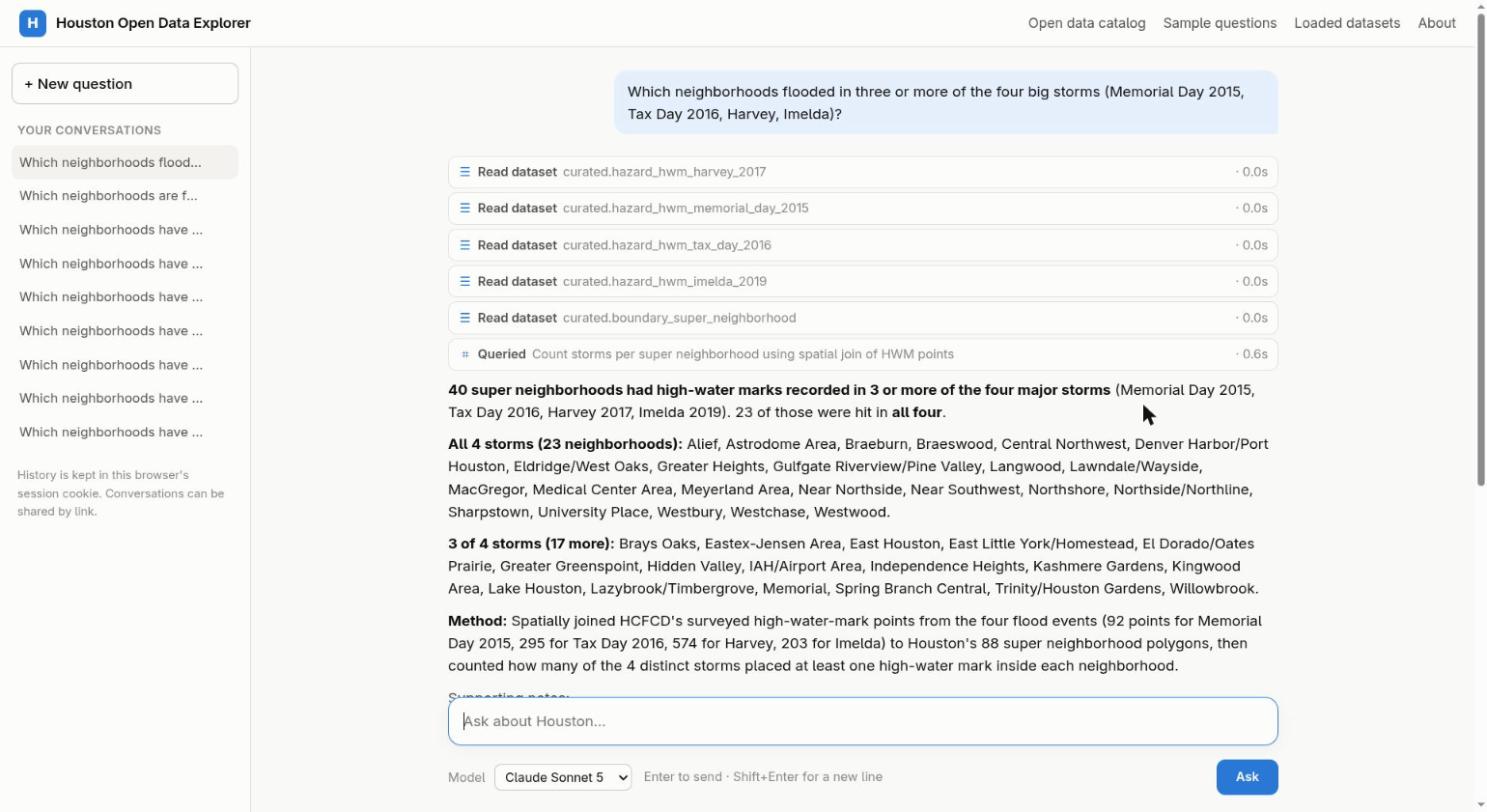
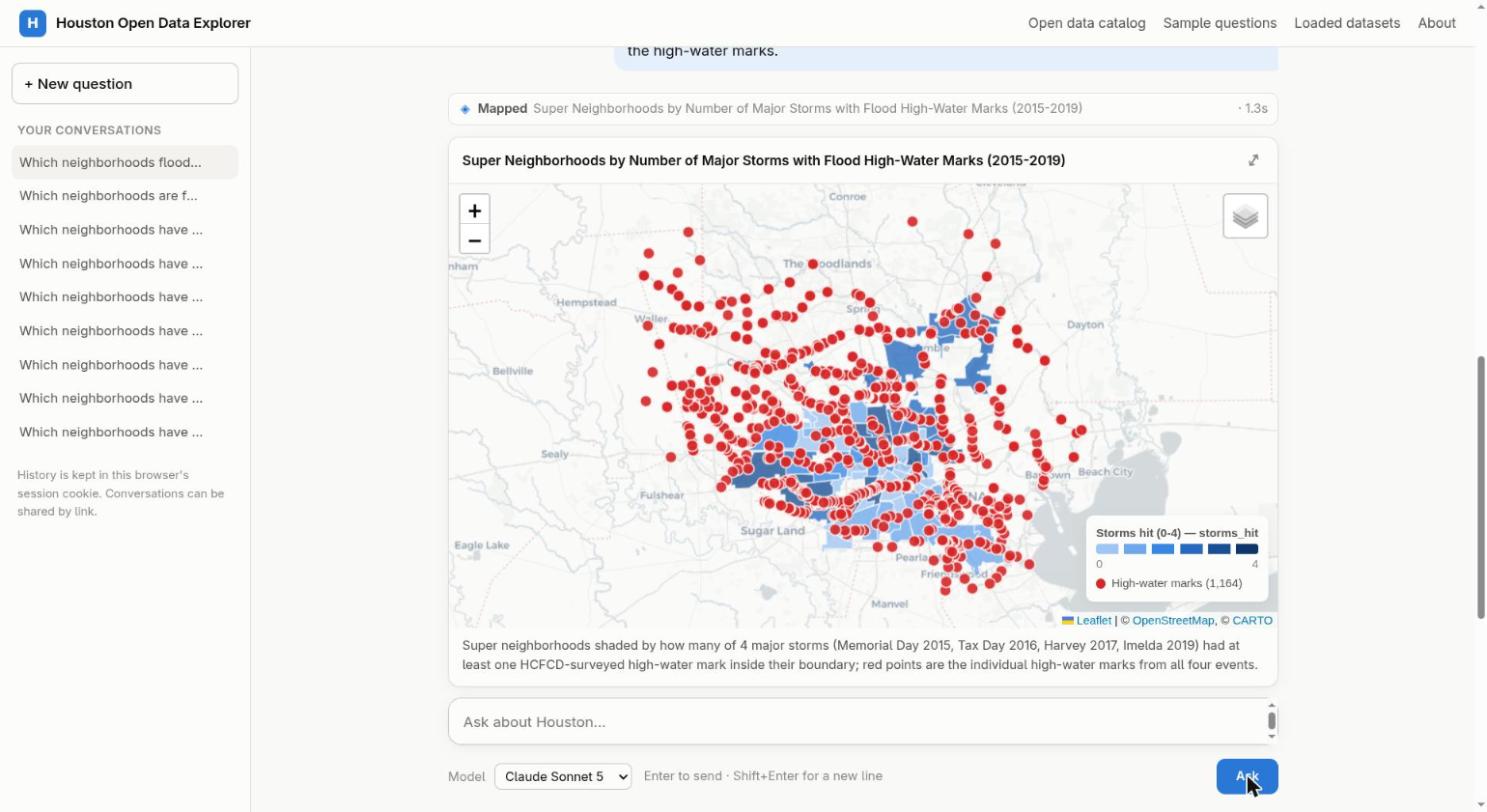
Neighborhoods shaded by how many of 4 big storms flooded them (2015–2019)
-
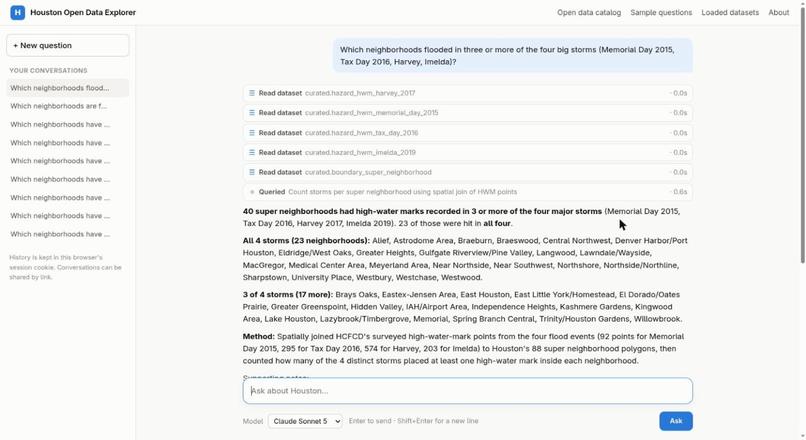
Plain-English question, answered in 25 seconds, every step shown
-
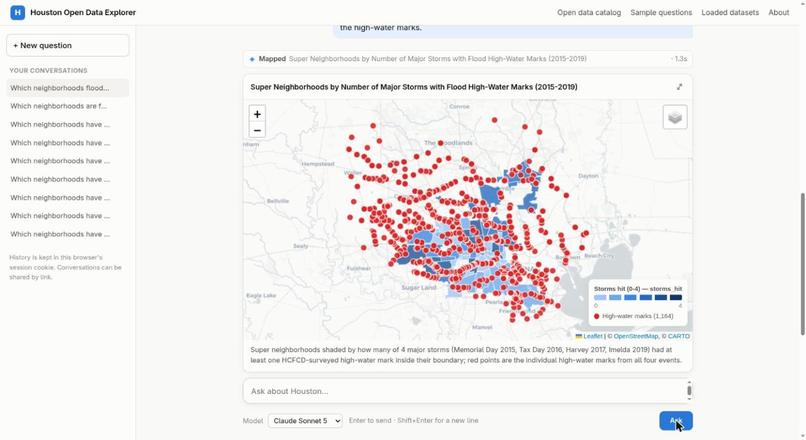
Same map with all 1,164 surveyed high-water marks
Inspiration
Houston publishes a huge amount of open data, but it's scattered. The City has two ArcGIS Hub sites over several servers, plus a separate spreadsheet portal. Harris County, the Flood Control District, Rice University and HARC each run their own ArcGIS organizations, and FEMA, the Census Bureau, CDC and EPA publish more. No one keeps track of all of it, and most of it is never joined together.
I started with a small plan: load a few interesting City layers (storm drains, high-water marks, crime) into PostGIS and put an AI chat on top to answer cross-layer questions such as "which neighborhoods have both high crime and repeated flooding?"
What it does
fasthouston.org has three parts:
- A catalog of everything. 7,218 datasets and layers from 16 sources, searchable in one place, whether they're loaded or not. Each entry is marked as loaded, a candidate, a likely staff working copy, or "needs permission first". The public can suggest new sources.
- One database with all the useful data. 150 layers and datasets, about 8.5 million rows, in a single PostGIS database, all in the same coordinate system and ready to join. It covers boundaries, facilities, drainage, streets, traffic safety, flooding, permits, environment, transit, crime (5 years of HPD NIBRS) and 5.6 million 311 requests.
- An AI analyst. Ask a question in plain English. The model reads a data dictionary, picks the relevant datasets, writes SQL, runs it on a read-only copy, and answers with a number, table, chart or map. It shows every query and a one-line method, so you can check its work.
Sample questions, each joining data from different publishers:
- Which neighborhoods flooded in three or more of the four big storms (Memorial Day 2015, Tax Day 2016, Harvey, Imelda)?
- Which super neighborhoods rank high on 311 flooding complaints, FEMA flood-insurance claims and Harvey high-water marks, and how socially vulnerable are they?
- Where do EPA toxic air releases, concrete batch plants, county air-sensor exceedances and high adult asthma rates overlap? Map them together.
- One table for every council district: crimes per 1,000 residents, structural fires, median days to close pothole requests, fatal crashes in 2025, and poverty rate.
There are 94 sample questions on the site, and you can run the same question on 15 AI models (Claude, GPT, Gemini, Grok, Qwen, DeepSeek, Kimi and others) to compare their answers.
How we built it
The project changed direction halfway through, and that change is the main result.
The first plan was a curated set of about 15 layers. But each question I worked on (flooding first) made Claude suggest another dataset that would help, and those datasets often came from ArcGIS servers I didn't know existed. So I kept asking, "what else is on that server?" The list grew from two City Hubs (342 layers) to the County organization (3,112 items), then Flood Control, then Rice (2,888 items), then HARC. By Friday night I had thousands of candidate layers and no reasonable way to decide in advance which ones mattered.
So I asked a different question: how much data would it take to just load all of it?
The answer was: not much. Every layer of real interest came to 150 layers, about 8.5 million rows and under 10 GB in PostGIS, including the raw copies, curated copies and spatial indexes (9.4 GB total). The logged download time for all of it was under half an hour. What was left over was mostly duplicates of parcel layers, bulk utility networks, and staff working copies, and even those are listed in the catalog.
That changed the design. I no longer had to guess in advance which data might be useful. The work became:
- A catalog of every source: every portal enumerated in one place, with staff working copies, metadata-only items and research copies that need permission flagged.
- One database: every layer of interest reprojected into one coordinate system, indexed, and traced back to its source layer and load run.
- A data dictionary of 146 described datasets in 14 categories, with each one's quirks noted.
- The web app: any of 15 AI models answers through read-only database access with query time limits, and replies with maps and charts. A daily cost cap keeps it affordable.
- An answer-quality loop: method lines and self-checks in every answer, user reports, nightly review of weak answers, and a regression set of questions with known answers.
The catalog, statistics and analyses are public at https://github.com/buck/houstonopendataexplorer. The software is not open source.
Stack: Python, PostgreSQL + PostGIS, Leaflet, Vega-Lite, OpenRouter, Claude Code, running on my own hardware.
Challenges we ran into
- Finding the data was harder than loading it. The City's "test" server (
geogimstest) is actually the live one. One County organization mixes authoritative layers with hundreds of personal working copies. Portals disagree on names, and some list items that can't be queried. - Official boundaries don't line up. Super neighborhoods, council districts, police beats, ZIP codes and census tracts all cut the city differently, so the analyst has to allocate by area and say so.
- Deciding what not to publish. Rice hosts a research copy of 2.46 million geocoded HFD incidents. It's publicly readable but not meant for reuse, so it's catalogued as "needs permission" and not loaded.
- Making AI answers trustworthy. Early answers sounded confident and were sometimes wrong. That led to the method lines, self-checks, and regression set. One example: 2024 data alone suggested Alief was Houston's late-night assault hotspot, but loading five years reversed that; it's Sharpstown (chi-square p < 0.0001).
Accomplishments that we're proud of
- A census of Houston's open data that I don't think existed before: 7,218 items across 16 sources.
- Going from about 24 layers to 150 in one day, because loading everything turned out to be cheap.
- Questions that used to take a data team days, joining crime, flooding, 311, FEMA, Census and EPA, now take about a minute, with the SQL shown.
- A public, working site: https://fasthouston.org
What we learned
- Loading everything is often cheaper than choosing. A city's entire useful GIS output fits on a laptop. Once it's in one database, you stop asking "is there data for this?" and start asking better questions.
- AI is good at discovery. Claude kept finding servers and datasets I didn't know about. The breadth of this project came from following those leads.
- Trust takes work. Showing the query, stating the method and checking the result matter more than choosing a smarter model. Comparing 15 models side by side made that clear.
What's next for fasthouston.org
- Load the next tier: City checkbook, payroll and budget; HCFCD buyout areas; live county air sensors with burst alerts; METRO GTFS frequency; 1930s redlining maps.
- Nightly refresh of every loaded layer, so the database stays current as the portals change.
- Users: council offices, journalists, nonprofits, researchers and residents, who all need answers without a GIS analyst.
- The City's internal data. The same setup (read-only role, provenance for every row, bounded AI access, hardware you control) is what a city IT department would need to point it at internal systems.
- Other cities. Nothing here is specific to Houston except the source list. The same harvester and loader would work for any county's ArcGIS sprawl: Dallas, San Antonio, New York, Chicago.
Part of a Houston flood toolkit: Know it (fasthouston.org), See it (Flood AR: demo), Act on it (floodroutes: https://floodroutes.nbolt.com).
Built With
- claude
- esri
- leaflet.js
- openrouter
- postgis
- postgresql
- python
- vega-lite

Log in or sign up for Devpost to join the conversation.