-

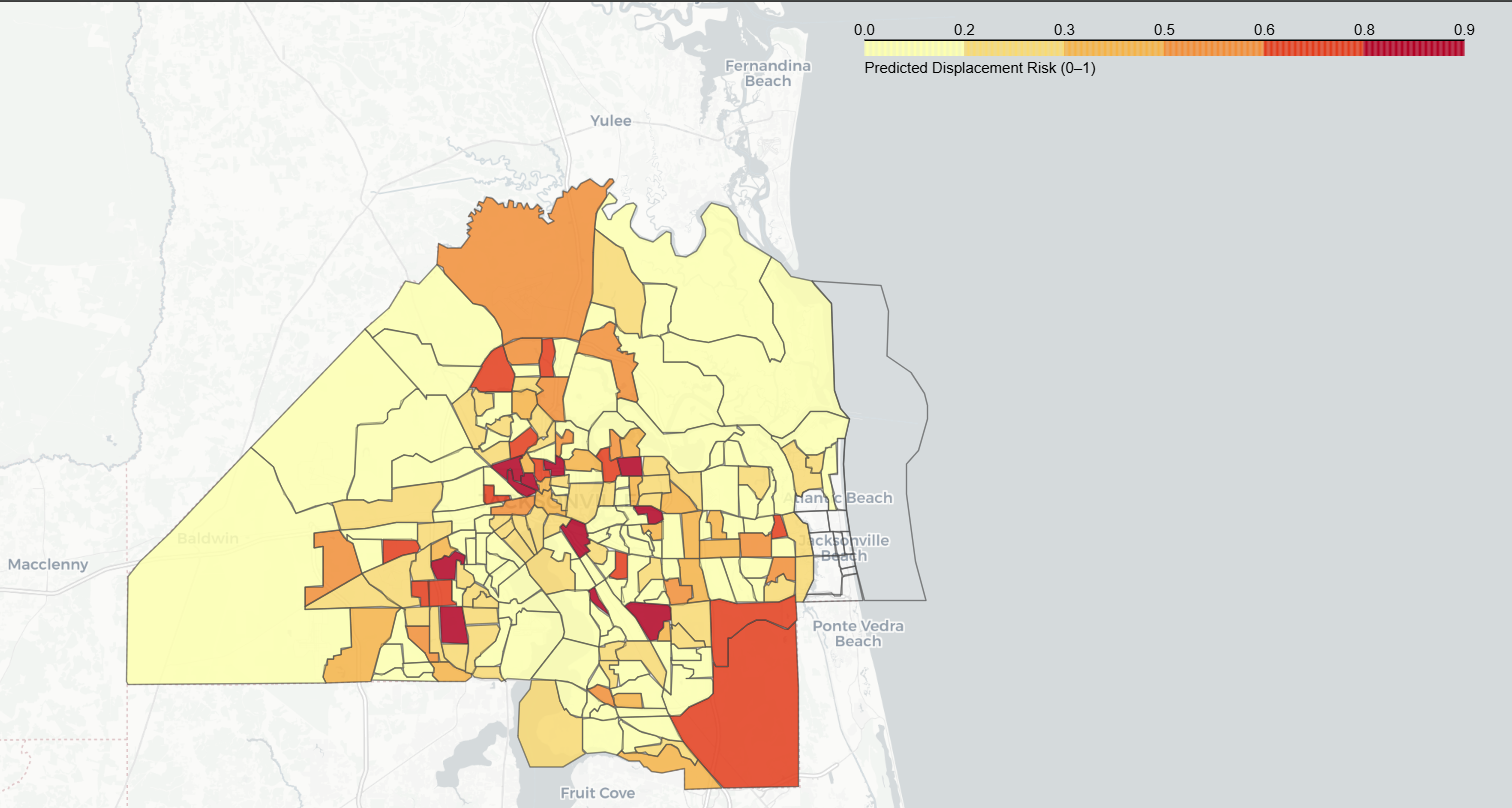
Jacksonville Displacement Risk Map
-

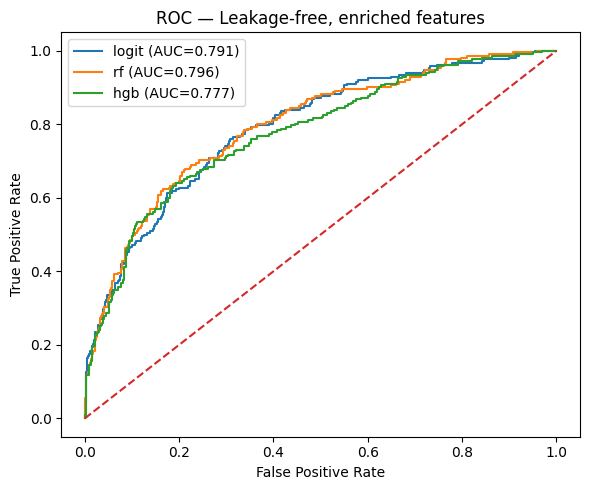
Model Performance
-

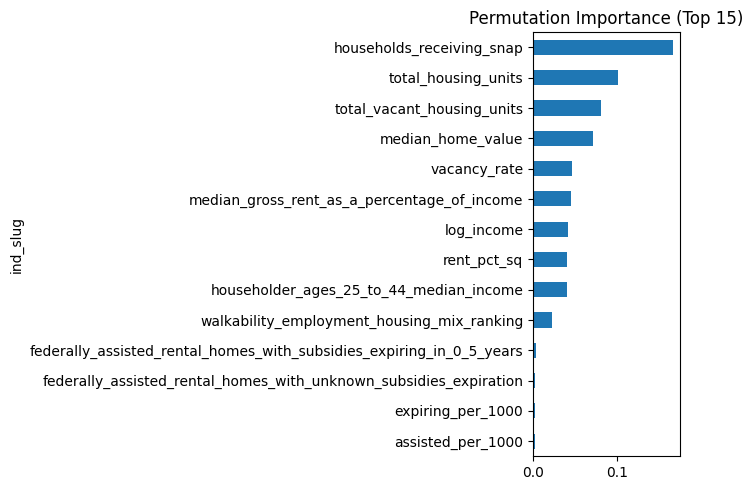
Permutation Importance
The team was motivated by the growing concern over affordable housing shortages and the social consequences of displacement.
Inspired by the vision of AI for social good, this project explores how machine learning can assist policymakers in detecting housing vulnerability early, before families are forced to relocate.
The goal was to transform static datasets into actionable intelligence that empowers local authorities to intervene proactively rather than reactively.
The proposed solution is a predictive analytics pipeline that: • Integrates 150+ publicly available datasets from HUD, USDA, and mySidewalk. • Cleans, standardizes, and merges neighborhood-level data across 20 U.S. cities. • Trains a machine learning model to classify each tract as low or high displacement risk. • Produces a city-level risk ranking and an interactive map visualization of Jacksonville’s neighborhoods. • Generates a policy playbook suggesting targeted interventions based on the main drivers of risk.
- Data Integration and Preprocessing • Combined multi-city datasets covering assisted housing, rent burden, income distribution, and demographic characteristics. • Standardized all records by Census Tract GEOIDs to ensure spatial alignment. • Removed missing and inconsistent entries while preserving data diversity.
- Feature Engineering • Extracted critical socioeconomic indicators including: - Median gross rent as a percentage of income - Median household income (ages 25–44) - Federally assisted units with subsidies expiring in 0–5 years - Overcrowding rate and SNAP (food assistance) percentage • Created derived variables such as vacancy rate and assisted housing per 1,000 units to capture structural vulnerability.
- Model Development • Implemented several classifiers (Logistic Regression, Random Forest, and Gradient Boosting). • Finalized the HistGradientBoostingClassifier, achieving an AUC of 0.796 on the validation set. • Target variable (y) represented high vs. low displacement risk (top quartile threshold).
- Visualization and Policy Layer • Used Folium and GeoPandas to visualize risk intensities by census tract. • Developed a policy recommendation table linking each tract’s primary driver to an actionable housing strategy (e.g., extending LIHTC subsidies, supporting workforce development). • Data Heterogeneity: The datasets had inconsistent naming conventions and missing tract identifiers, requiring significant preprocessing. • Computational Constraints: Handling 150+ large CSV files exceeded Colab’s RAM limits, necessitating optimization and lazy loading strategies. • Label Definition: Designing a fair, leakage-free risk label required balancing statistical rigor with interpretability. • Visualization Accuracy: Aligning GEOIDs to tract polygons to ensure the map correctly displayed Jacksonville’s spatial data.
Accomplishments: • Built a fully automated data-to-insight pipeline integrating public datasets from multiple sources. • Achieved a robust predictive model (AUC ≈ 0.8) using interpretable socioeconomic features. • Created an interactive risk map highlighting Jacksonville’s most vulnerable neighborhoods. • Developed a policy playbook that directly connects AI predictions to practical policy interventions. • Delivered results in a clear format suitable for policymakers, urban planners, and academic audiences alike.
What we learned: • Integration of AI and Policy: How predictive modeling can complement social policy analysis to guide interventions. • Data-Centric AI: The importance of data cleaning, feature engineering, and explainability over complex models. • Team Collaboration: Effective collaboration in data-driven research under hackathon time constraints. • Visualization Ethics: Presenting AI results responsibly to avoid misinterpretation of community risk.
What's next for Untitled: • Incorporate real-time eviction and property transaction data for short-term risk forecasting. • Extend the model to predict 6–12 month displacement probabilities dynamically. • Deploy a web-based dashboard for city agencies and housing nonprofits to access live risk analytics. • Scale the framework to additional metros such as Atlanta, Dallas, and Denver for nationwide benchmarking.
Built With
- geopandas
- gradient-boosting
- hud
- interactive-risk-map
- logistis-regression
- matplotlib
- mysidewalk
- numpy
- pandas
- python
- random-forest
- scikit-learn
- seaborn
- usda

Log in or sign up for Devpost to join the conversation.