-
-
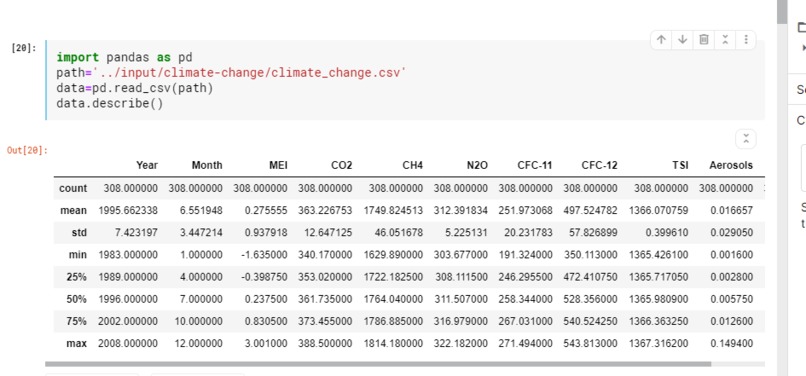
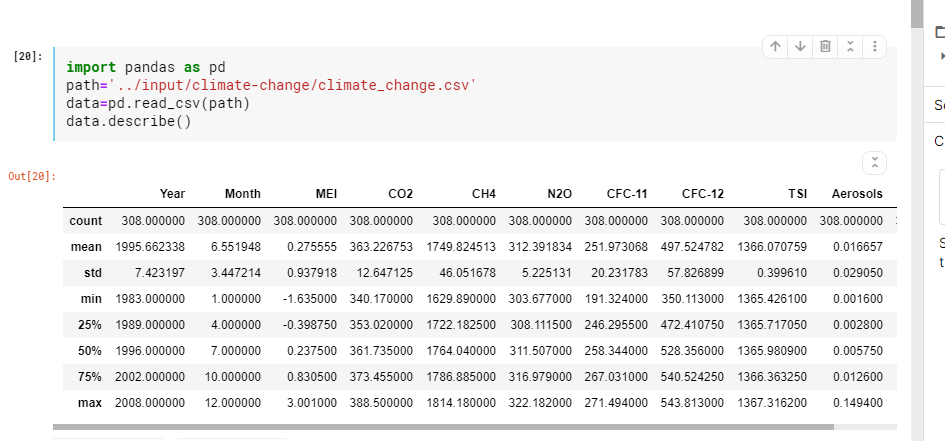
Here is a picture of importing pandas and the data
-
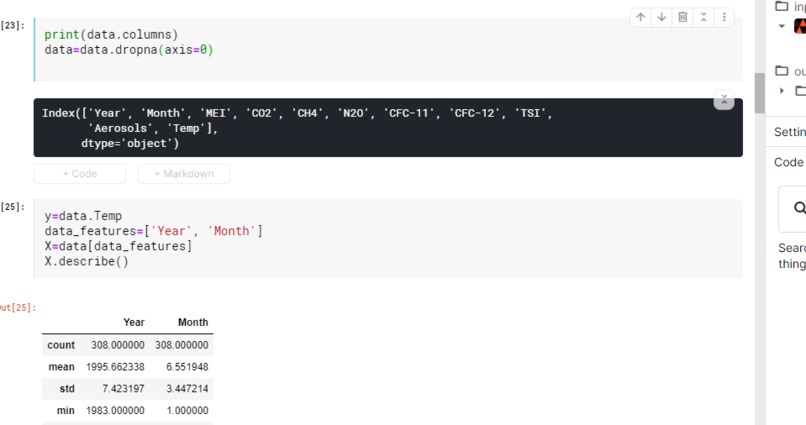
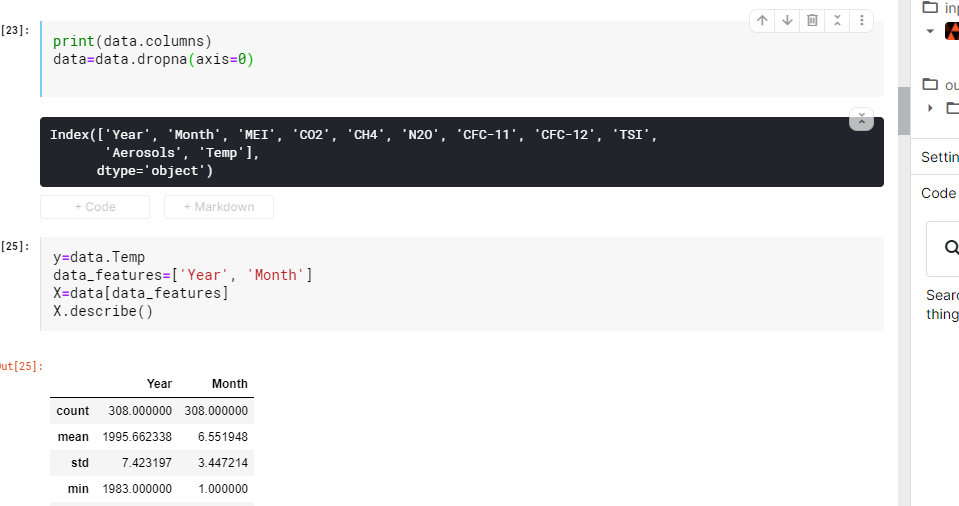
Here I set up the machine learning model (defining and fitting)
-
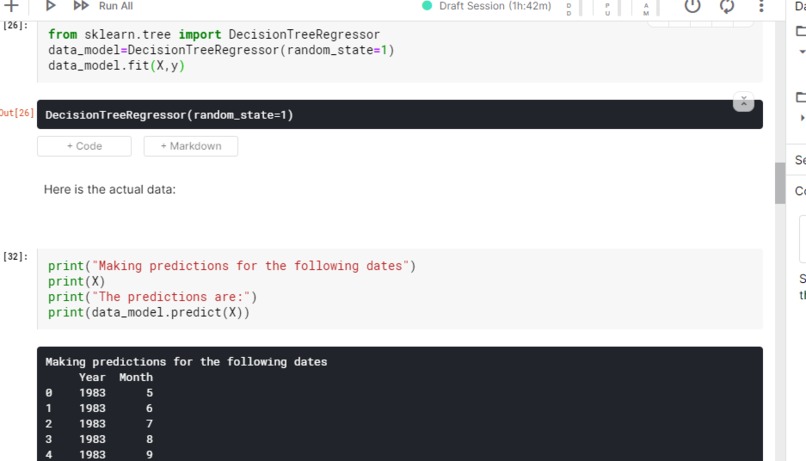
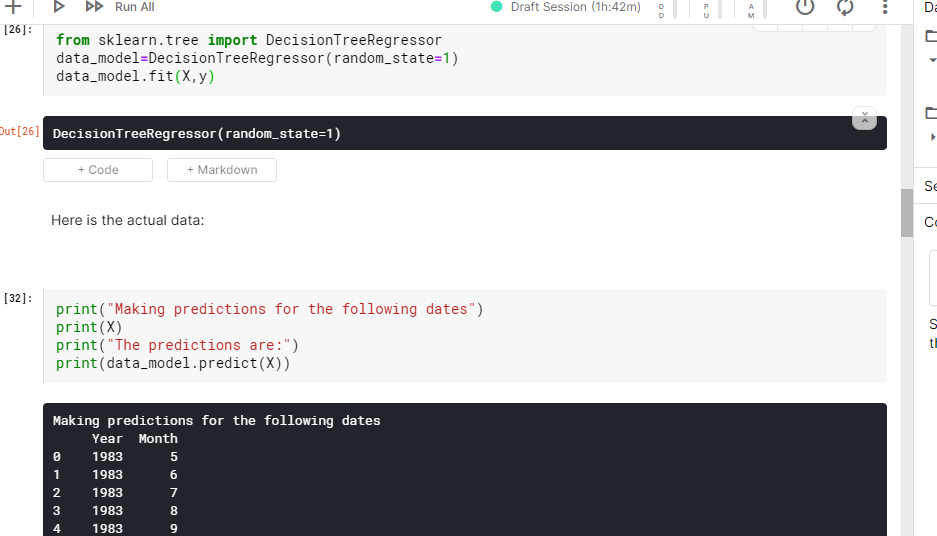
Here I actually predict the model
-
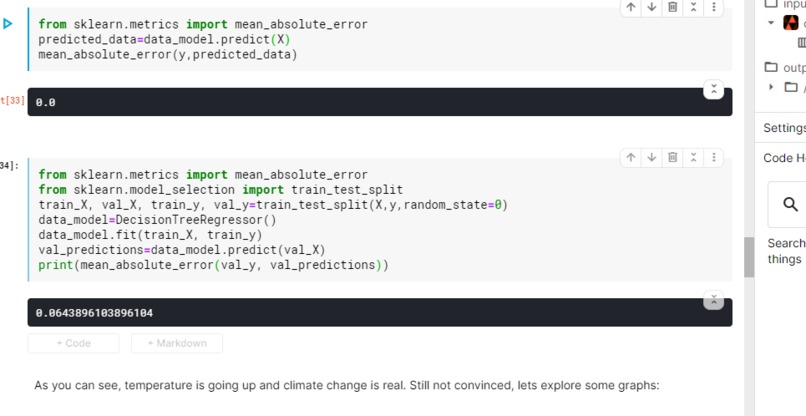
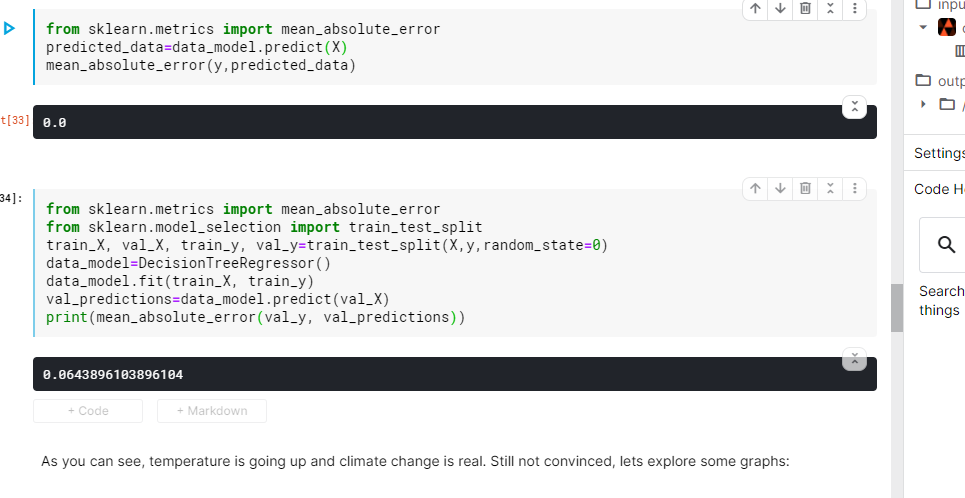
Here I evaluate the model using mean absolute average
-
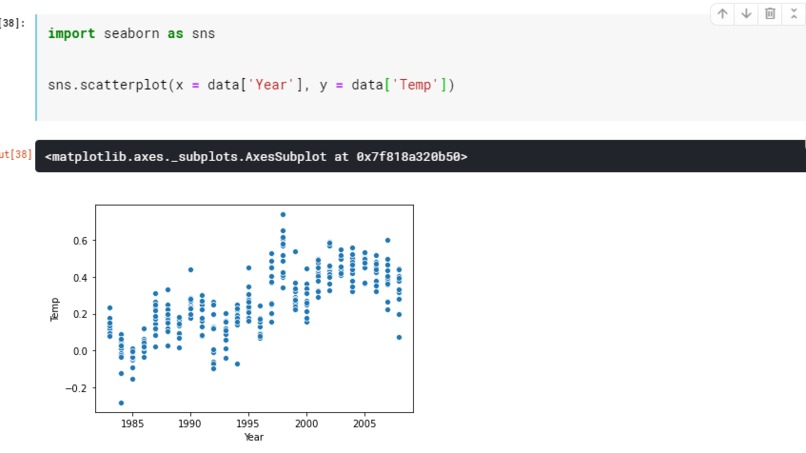
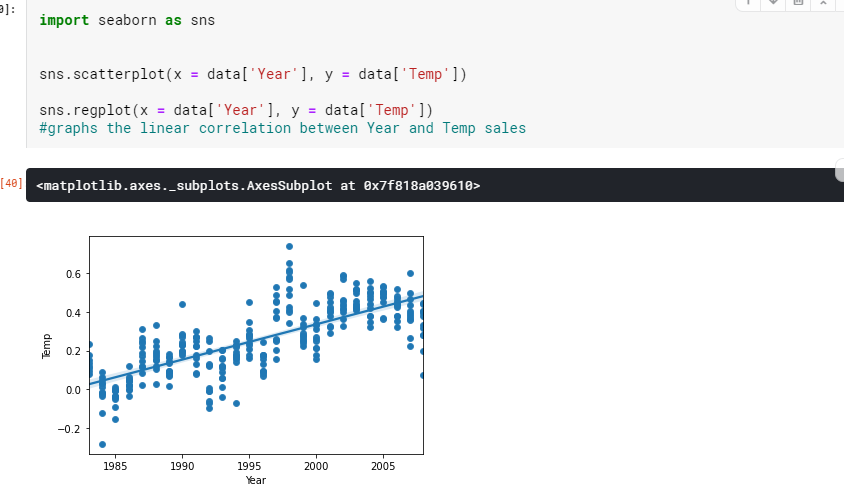
Here I make a graph given the climate change data
-
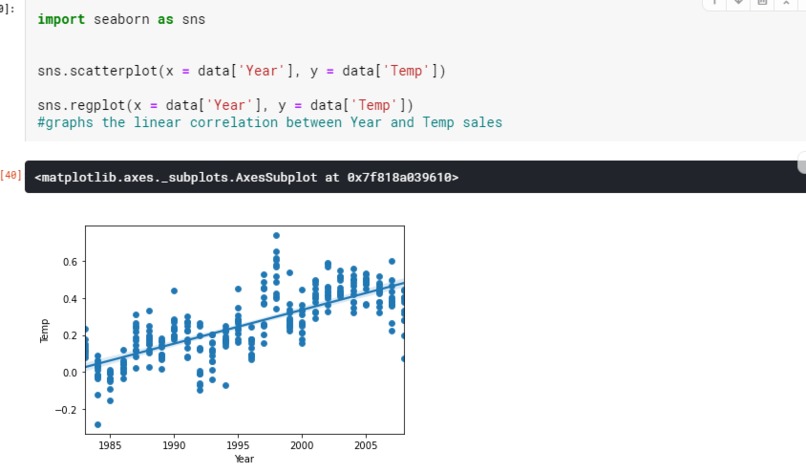
Here is another graph from the climate change data

Inspiration
For my project, I thought about what are the most urgent and lesser known/believed problems. Nothing popped out more than the climate crisis. People all around the globe believe the climate change is a hoax, and it is not real. The news agencies that inform the people about this problem make it very political. I decided to use python's data science and machine learning capabilities to try my best to inform the public in a non-political way, a way where the readers can interact with real, raw information. A way show that the temperature is rising, and climate change is real.
What it does
This project uses python's amazing data science and machine learning capabilities to visualize and provide information in a non-political way that can be trusted to try and inform the public about the current and still very imminent climate crisis.
How I built it
I went onto Kaggle, the best data science research platform (not sponsored) and found a trustworthy dataset that gathered the climate data from all around the world. (https://www.kaggle.com/econdata/climate-change) I used pandas, seaborn, and python's machine learning capabilities to create a project where I analyze and try inform the public about the climate crisis in a non-political way.
Challenges I ran into
I ran into many bugs along the way, from the dataset not working properly, to the limited amount of time due to the other events I had today, I am proud of how I overcame those challenges and pushed through.
Accomplishments that I'm proud of
I am proud of how I continued to work on my project with many obstacles in my way. I am also proud of what I created and the impact I hope to make.
What I learned
I learned many things along the way: from new data graphs, new machine learning possibilities and ideas, and an example of the positive impact of resilience, I am very happy I chose to do this today.
What's next for HOT, HOT, HOTTER!
Well, I plan on gathering more information about this topic, and getting this information to many more people.
Note: here is the link to the project if the try it out links do not work: https://www.kaggle.com/ericky101/hot-hot-hotter

Log in or sign up for Devpost to join the conversation.