Hospital_Emergency_Room_Dashboard
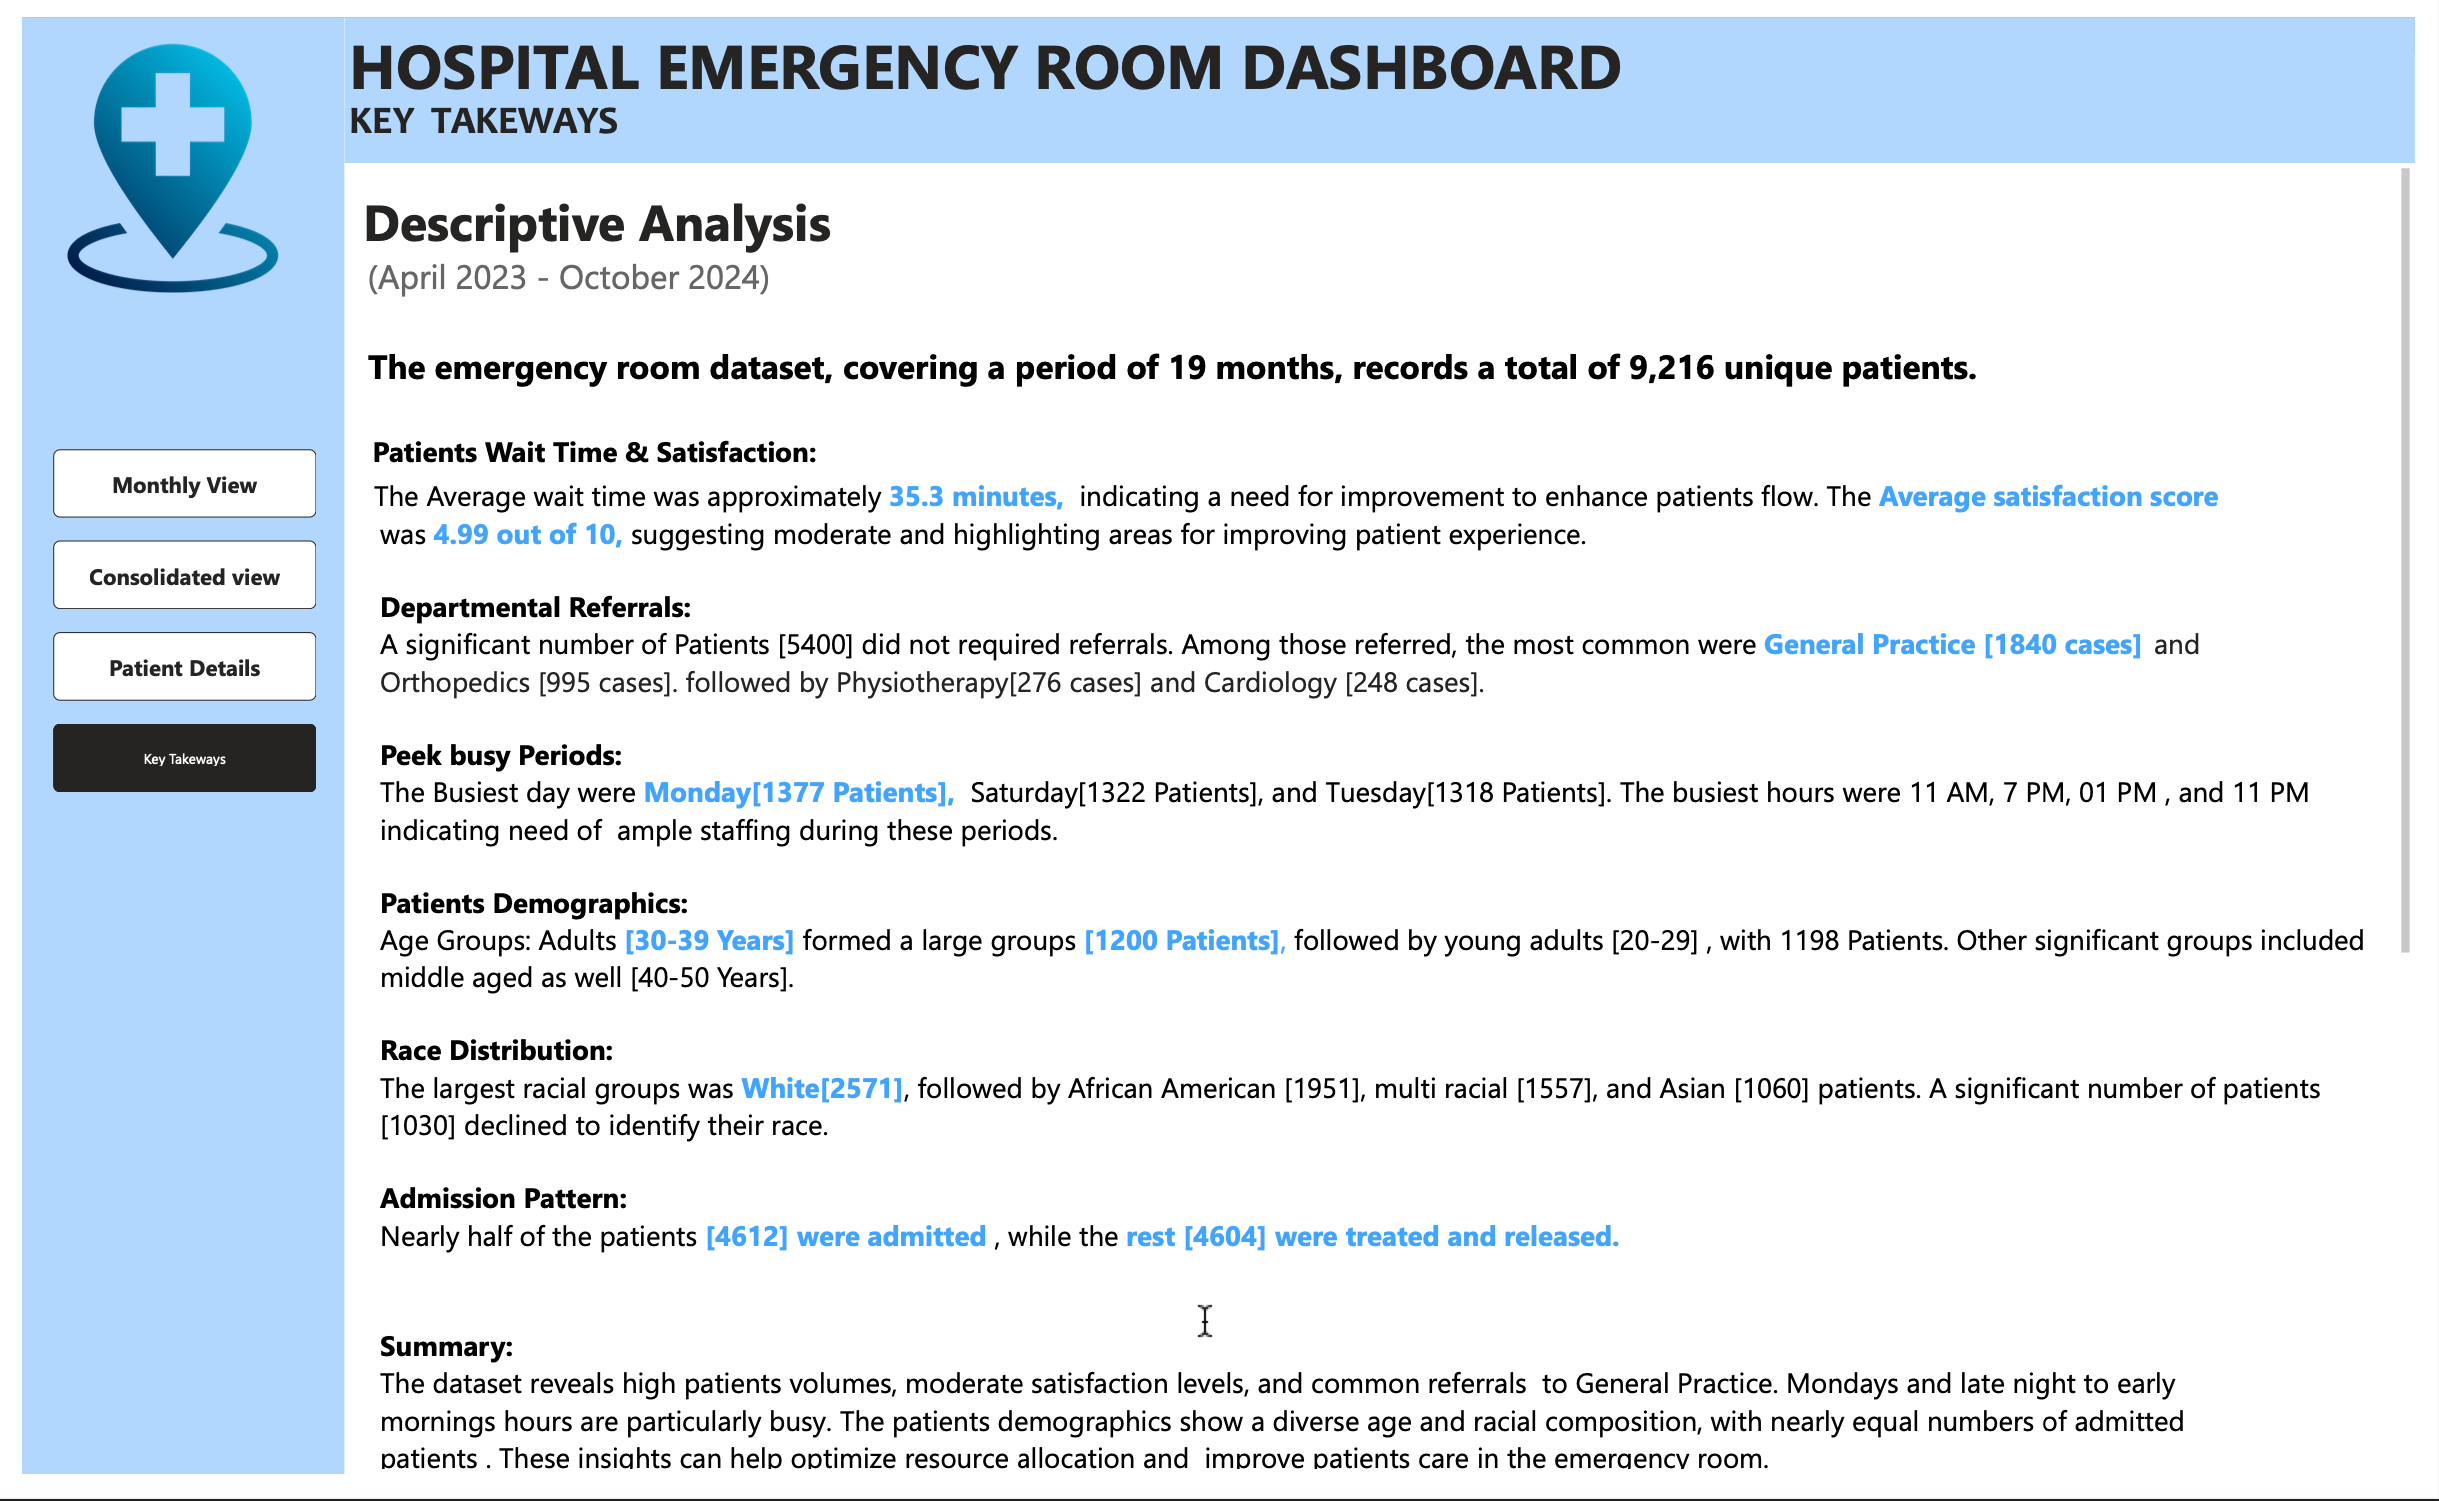
Descriptive Analysis (April 2023-October 2024) The emergency room dataset, covering a period of 19 months, records a total of 9,216 unique patients.
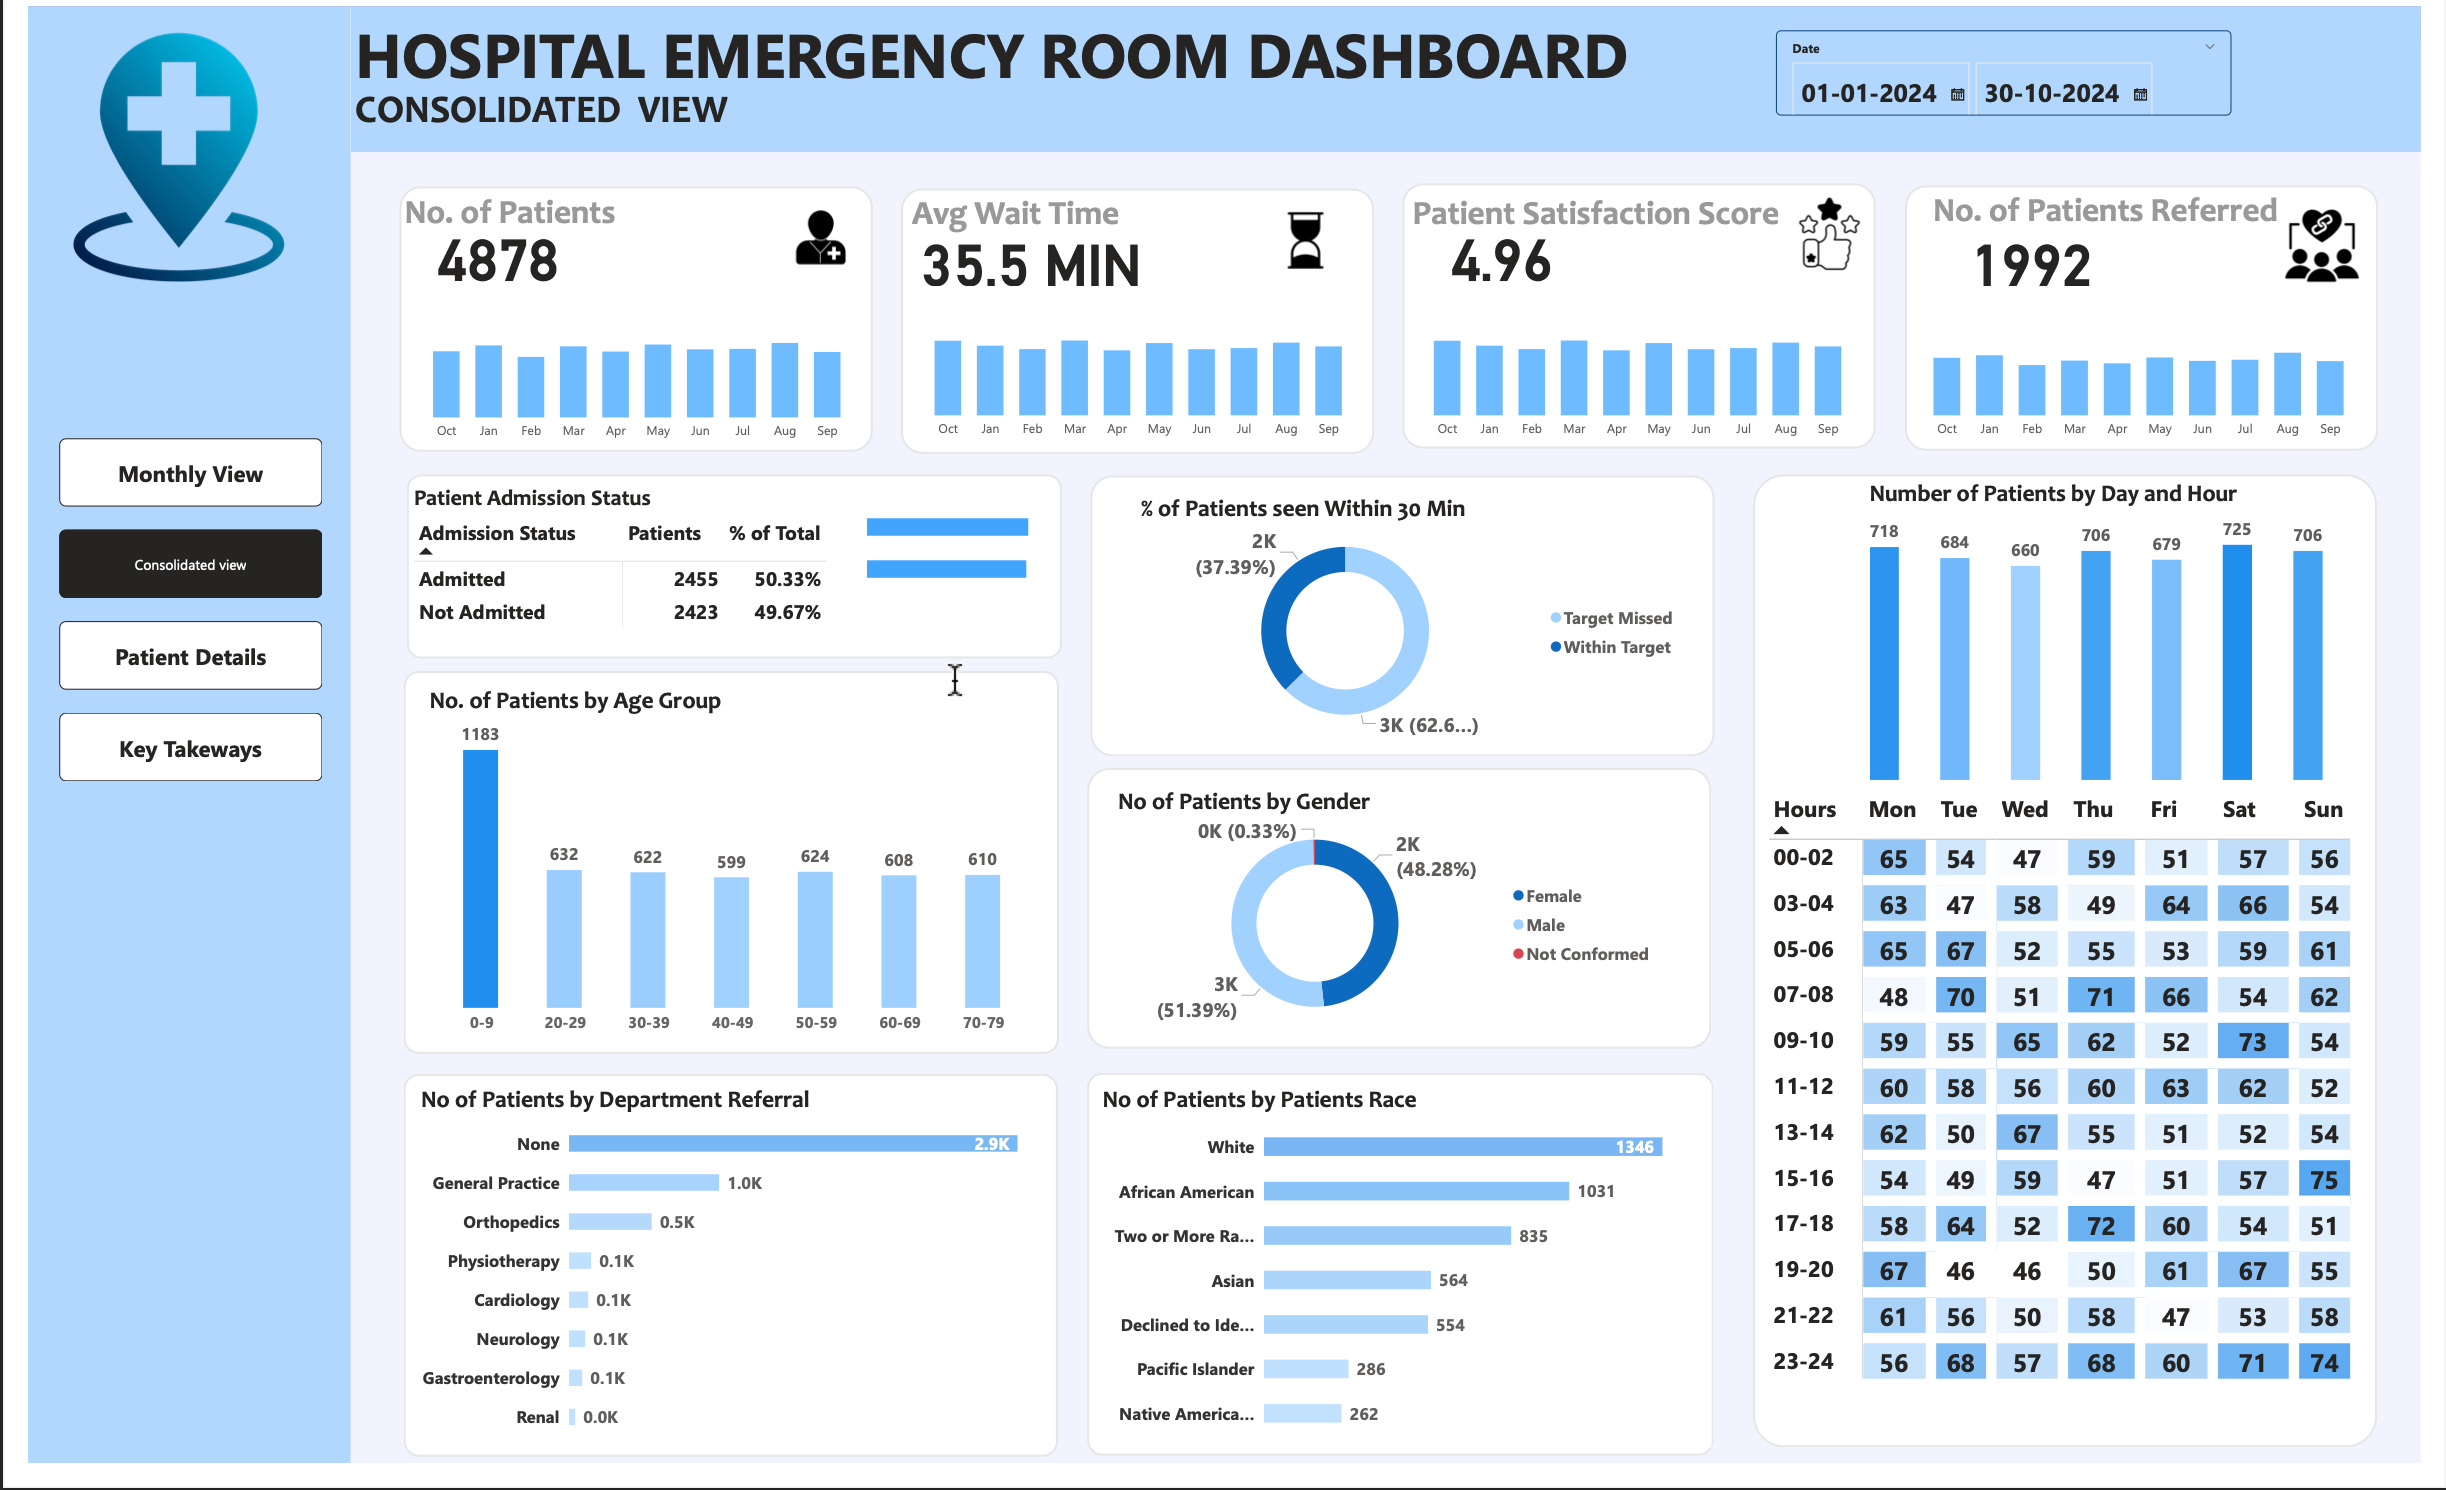
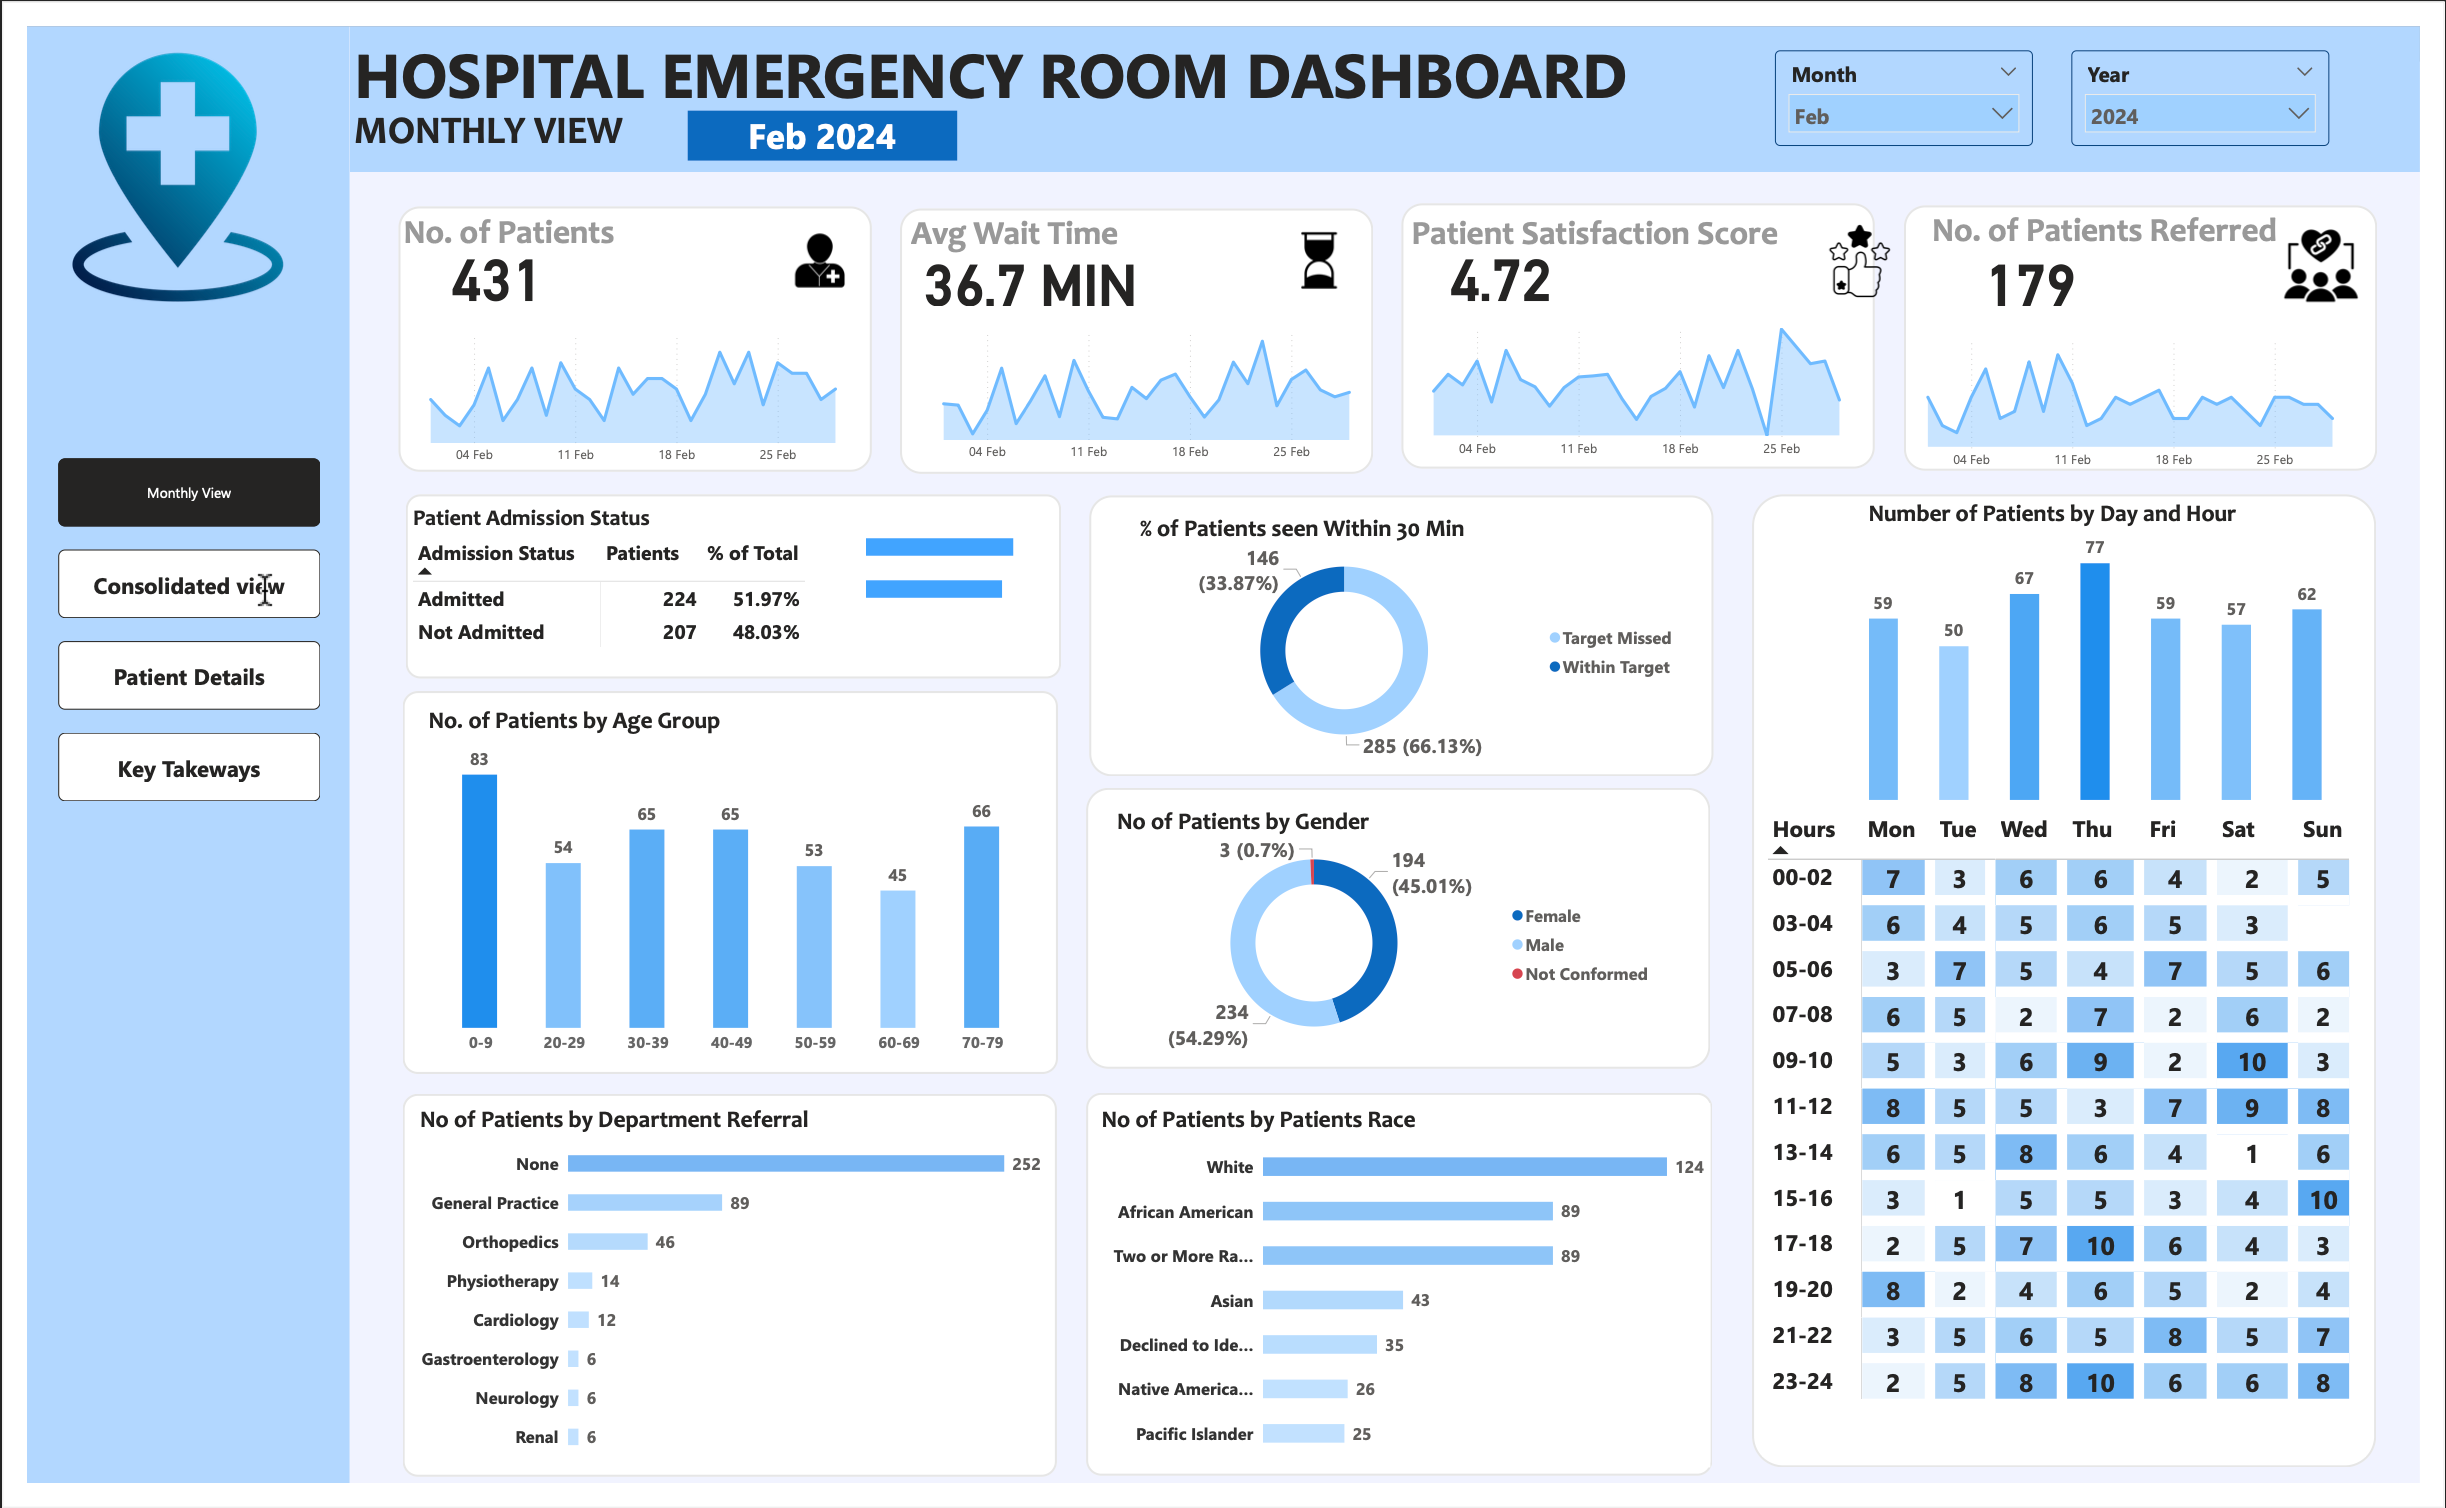
Patients Wait Time & Satisfaction: The Average wait time was approximately 35.3 minutes, indicating a need for improvement to enhance patients flow. The Average satisfaction score was 4.99 out of 10, suggesting moderate and highlighting areas for improving patient experience.
Departmental Referrals: A significant number of Patients (5400) did not required referrals. Among those referred, the most common were General Practice [1840 cases) and Orthopedics (995 cases), followed by Physiotherapy(276 cases) and Cardiology [248 cases)
Peek busy Periods: The Busiest day were Monday 1377 Patients), Saturday(1322 Patients), and Tuesday (1318 Patients). The busiest hours were 11 AM, 7 PM, 01 PM, and 11 PM indicating need of ample staffing during these periods
Patients Demographics: Age Groups: Adults (30-39 Years) formed a large groups (1200 Patients), followed by young adults (20-29), with 1198 Patients. Other significant groups included middle aged as well (40-50 Years).
Race Distribution: The largest racial groups was White (2571), followed by African American [1951], multi racial (1557), and Asian (1060) patients. A significant number of patients [1030] declined to identify their race.
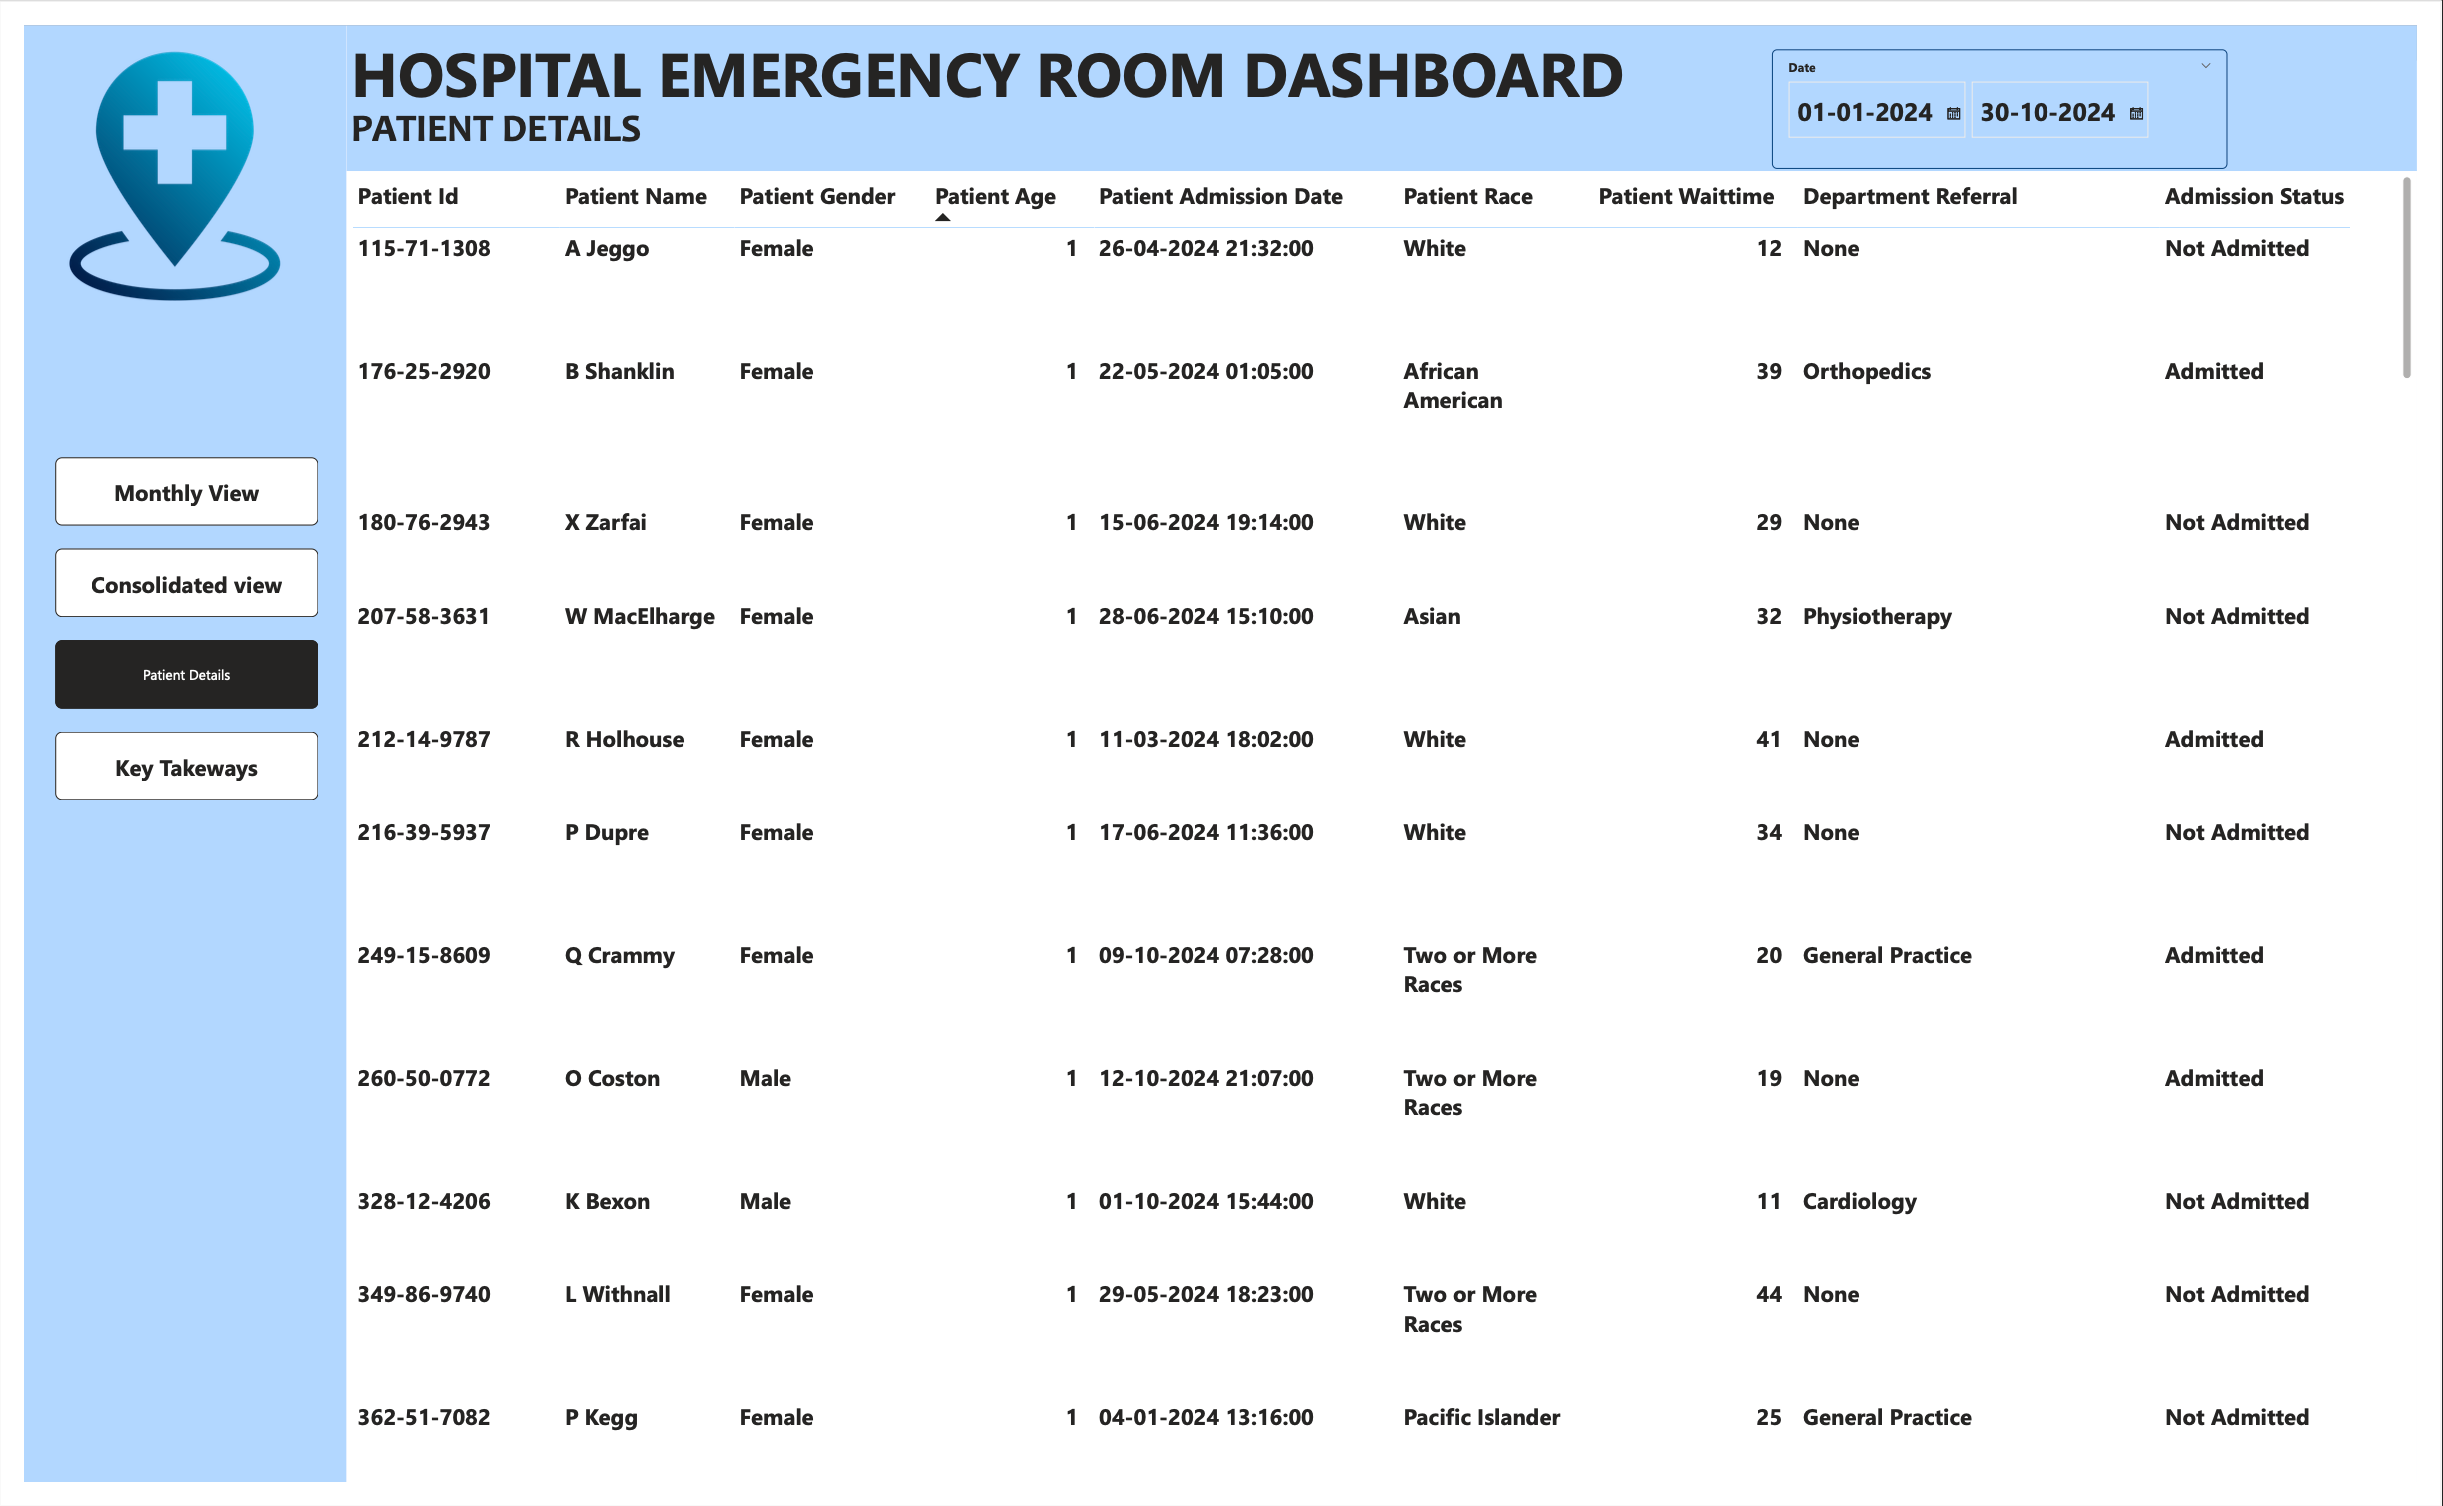
Admission Pattern: Nearly half of the patients [4612] were admitted, while the rest [4604] were treated and released.
Summary: The dataset reveals high patients volumes, moderate satisfaction levels, and common referrals to General Practice. Mondays and late night to early mornings hours are particularly busy. The patients demographics show a diverse age and racial composition, with nearly equal numbers of admitted patients. These insights can help optimize resource allocation and improve patients care in the emergency room.
Built With
- dax
- mysql
- power
- powerbi
- query

Log in or sign up for Devpost to join the conversation.