Inspiration
I was inspired to create an app with the mission to increase accessibility to healthcare since inequity in medicine is a significant issue the Bronx faces. I am interested in using computer science to support my community, and I found that access to healthcare could be ameliorated with this technology. An attribute of healthcare accessibility that sparked the idea for this app was specifically the cost of healthcare. Cost is a defining factor of healthcare accessibility as it determines whether or not someone could afford treatment. Compared to other New York City boroughs, the Bronx has the second-highest percentage of people under 65 who do not have healthcare with a portion of 8.8%(source). Additionally, in 2019, approximately 45% of New Yorkers delayed or avoided healthcare service due to its cost (source).
Computer science has been an interest of mine since I started python in 6th grade. This year, I started learning a new language: react native. This was the first language I learned that was oriented toward app development. One of my goals for this competition was to improve my skills in react native and data analysis whilst also developing a project that could be used to support my community.
What it does
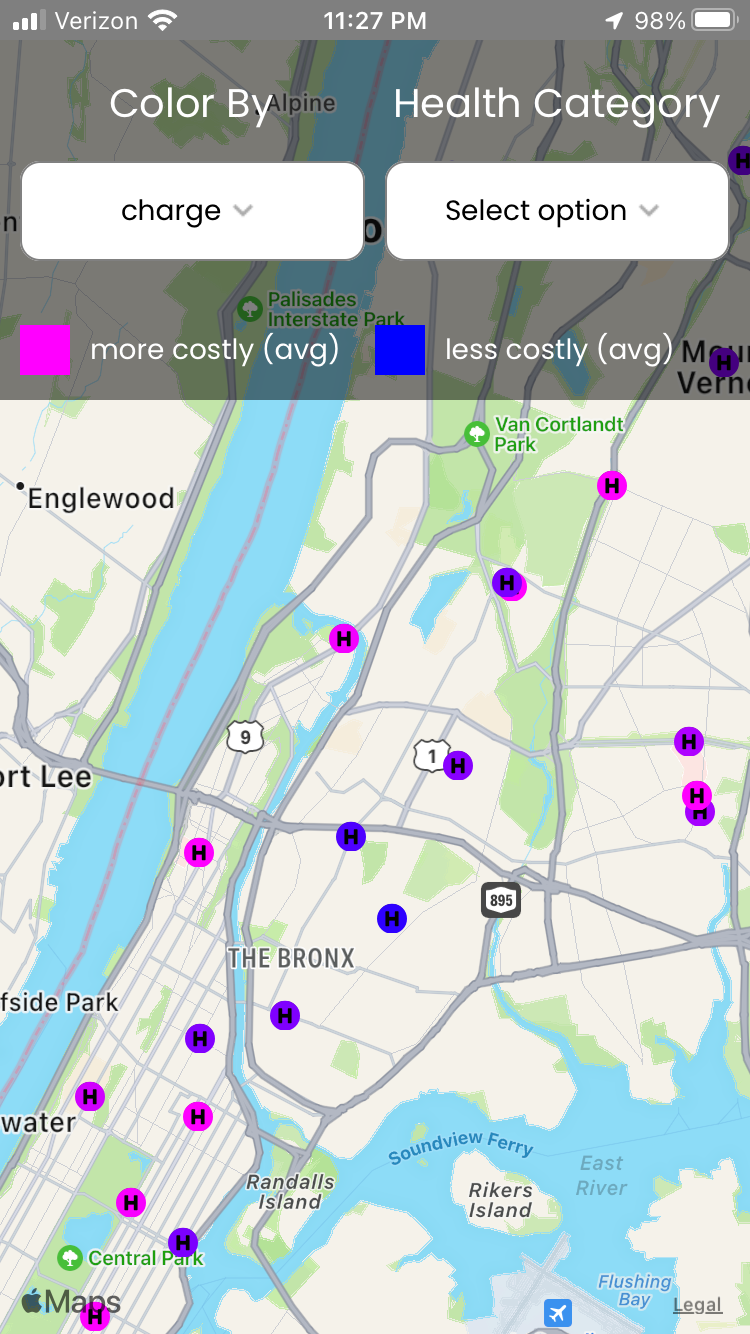
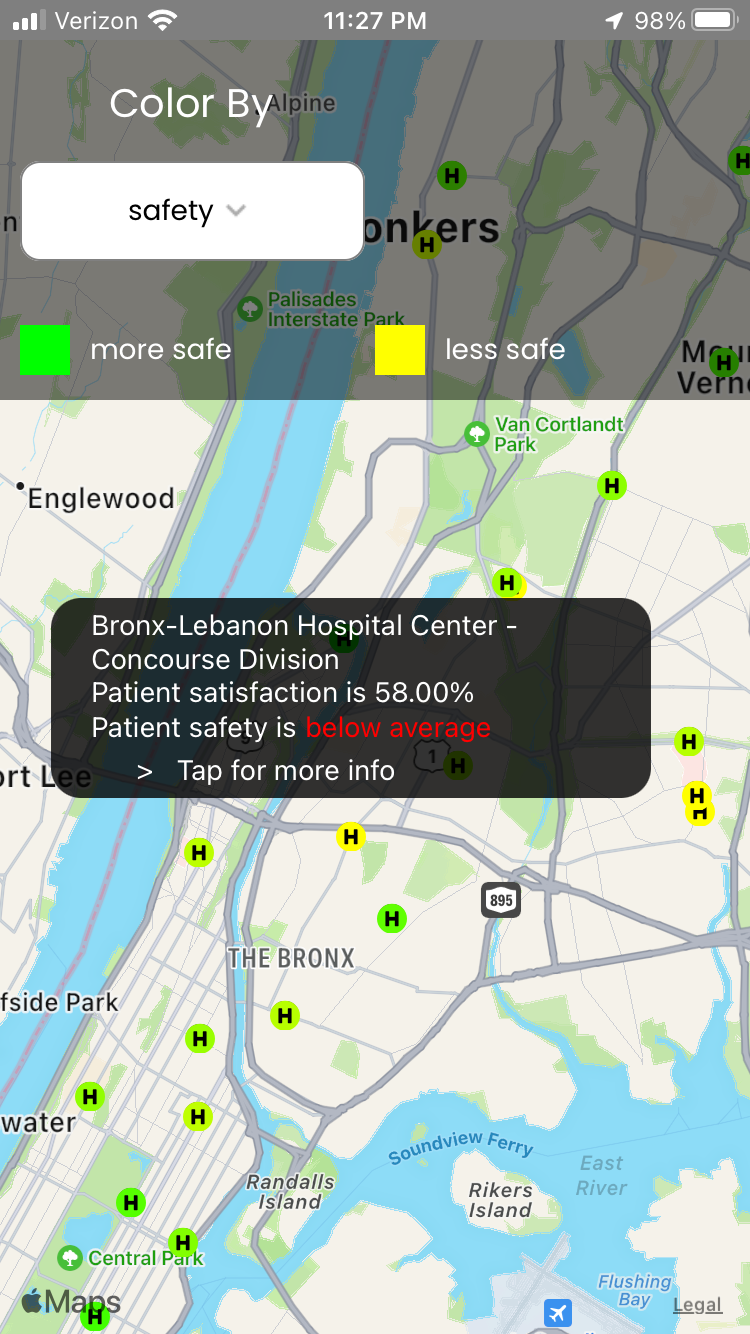
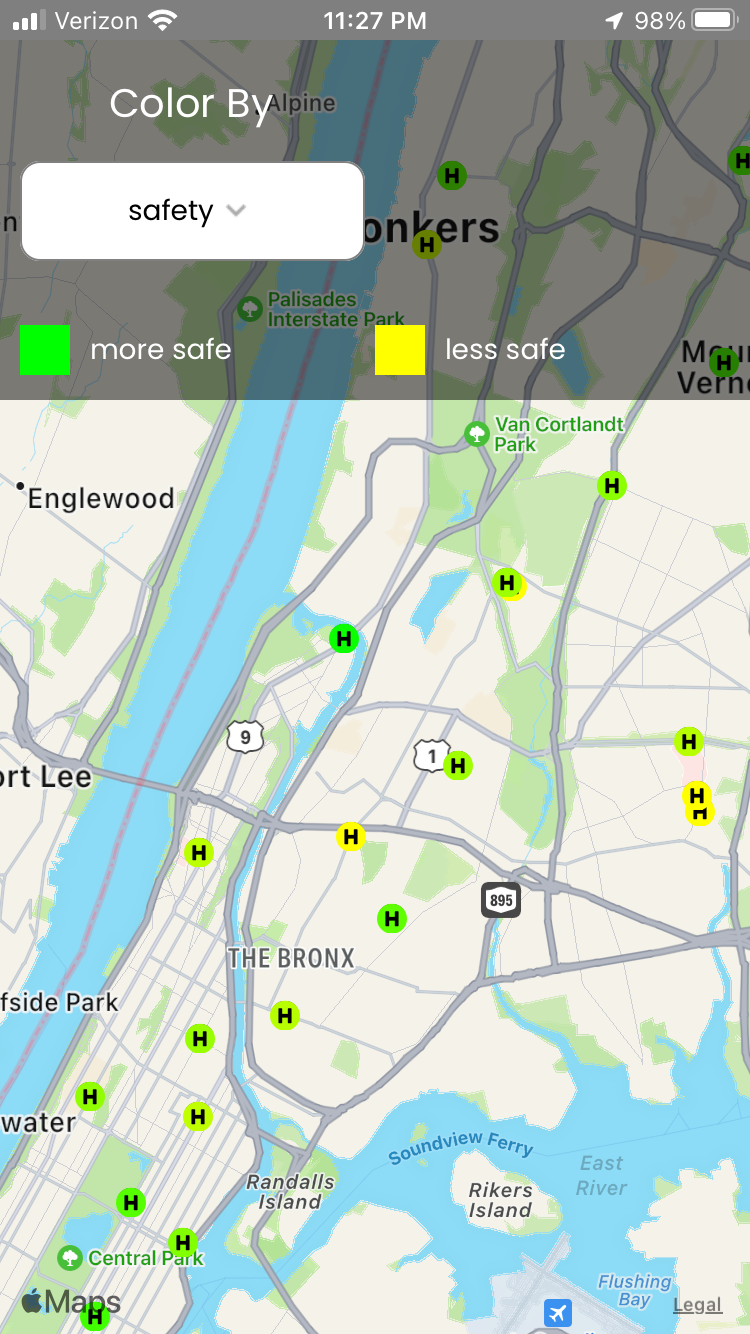
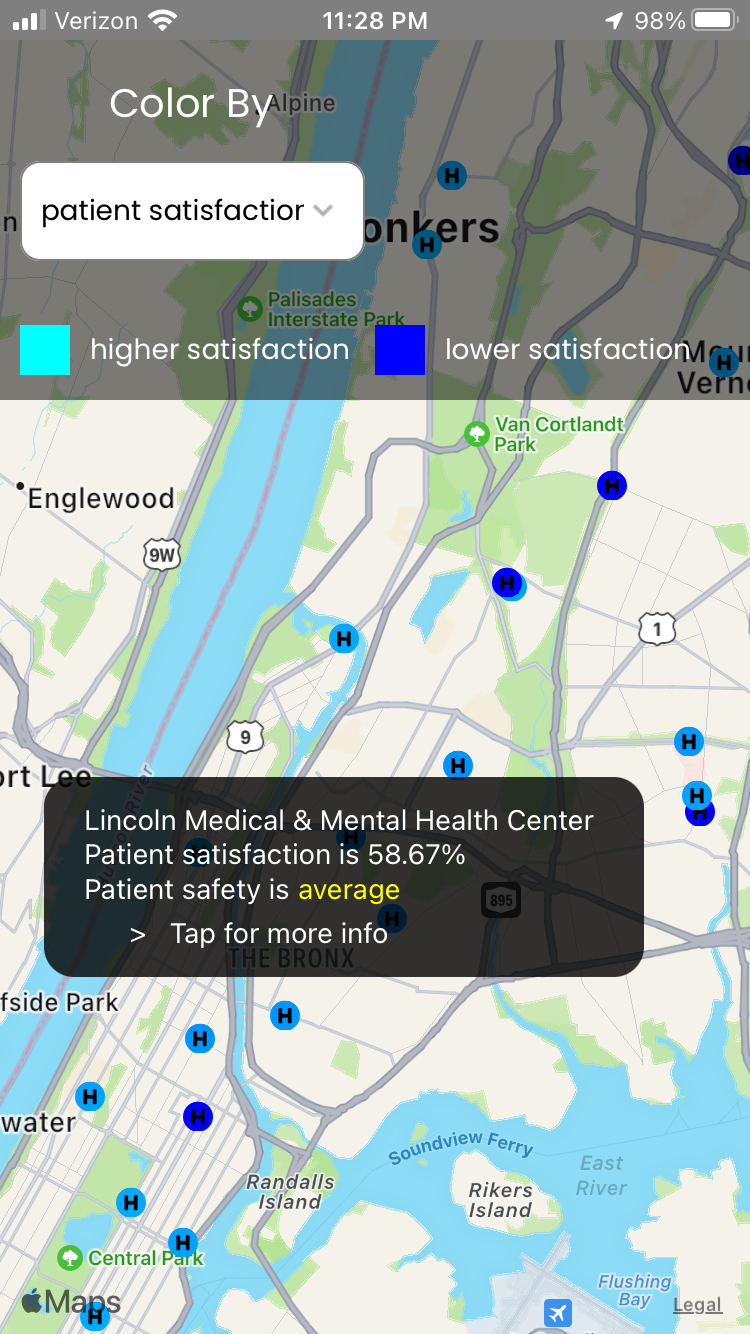
Hospital Find is an app that aims to increase accessibility to healthcare, transparency in the healthcare system, and trust in hospitals within the Bronx. One way the app does this is through cost comparisons across hospitals. The app displays a map of New York and places dots where each hospital is. Then, the color of the dot reflects different metrics such as the cost. Making the costs more transparent and easily comparable allows people to make more informed decisions about affordability. Another reason why people may avoid healthcare is due to mistrust within the community. The other variables that the color spectrum of the dots can represent are safety and patient satisfaction: two variables that increase transparency surrounding the quality of treatment.
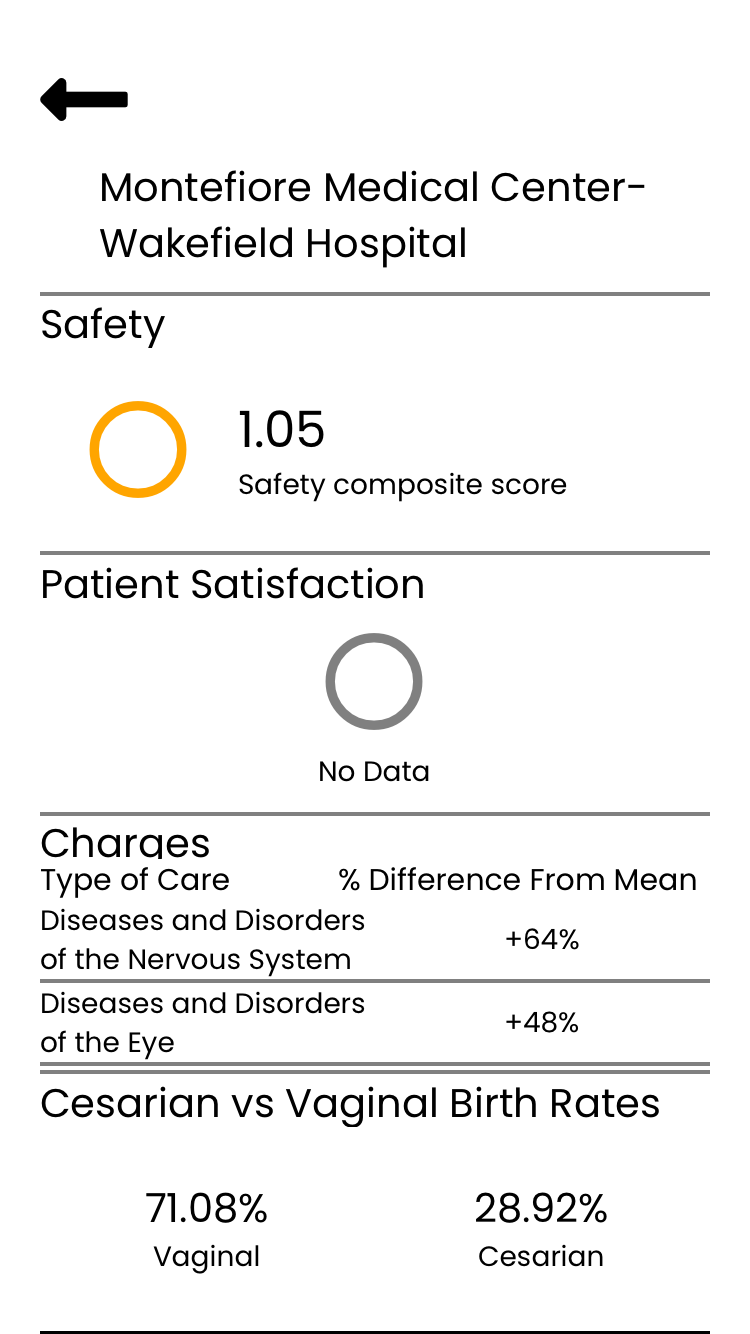
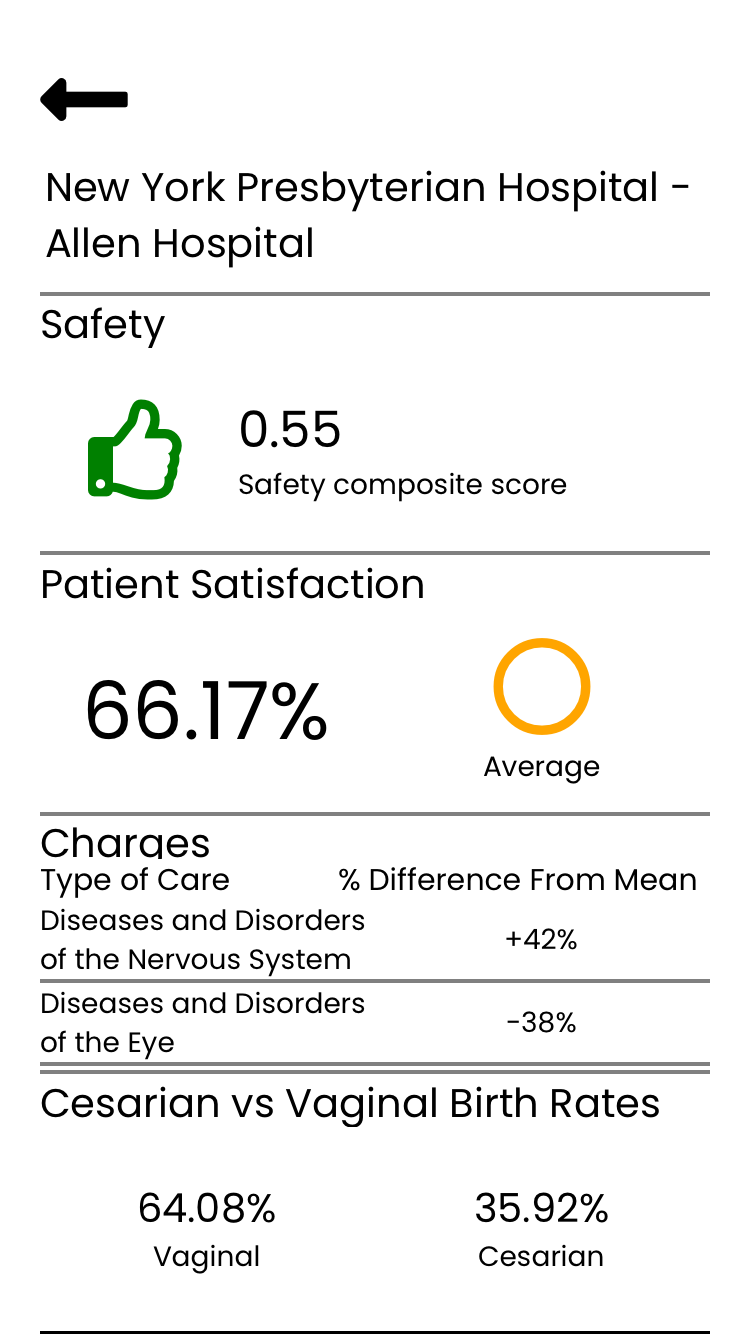
Hospital Find also provides more in-depth information about the mean charges relative to different healthcare categories, safety, patient satisfaction, and method of birth. The different healthcare groups compile the charges of various procedures associated with a type of condition, such as a burn or a respiratory condition. The safety and patient satisfaction scores are provided by the New York Department of Health. The safety variable is a composite score that assesses the complication rates among different medical procedures, and the patient satisfaction score is generated from the HCAHPS survey (source).
How we built it
The front end of the app was programmed in React Native. I chose this language since it is cross-platform and could be deployed to the app store or the google play store. To render the hospitals on the map, the Google Maps API was used.
On the backend, the data was downloaded from various database sources from the New York Department of Health (source) and then processed in Python and R. In Python, I used Pandas to stitch together multiple datasets, cleanse the text, and access latitude/longitude coordinates. R was used for numeric data analysis which mainly consisted of finding the difference in charge and cost across hospitals.
Once the app was created, since publishing to an app store takes time, the app was uploaded to Expo where anyone with an android phone can access it with a QR code.
Challenges we ran into
Data Collection One challenge was finding appropriate data that both had data from many hospitals and were descriptive. Once I realized the New York Department of Health published a lot of interesting data, it was also challenging to find an appropriate way to combine the data together. In the end, a JSON file was created that had a row for each hospital and several attributes about it such as location, costs, and safety.
Ethicality of Data Presentation The data must be presented in an ethical manner, that informs the user about the data, but does not make the choice for them. This was a major challenge as it required planning around the presentation of the data. For example, using a red-to-green scale for the cost may be misleading, since it is possible that a cheaper hospital may have worse satisfaction or safety scores.
Accomplishments that we're proud of
Within the time frame of the week, the majority of my time was spent coming up with a problem statement and then devising a solution for it. This left me just a couple of days to create an app; because of the relatively short time, I am very proud of the results. This experience has been new to me, but also exciting. It was fun to design an app in a short time frame since it provided an additional challenge of balancing additional features with time spent.
I am also proud of the entire process of creating the app. This competition gave me the platform to think of a problem, synthesize a solution, and then actually put it into action. I am proud that I was able to create something about an issue I am passionate about: the healthcare system.
What we learned
The Process of Creating a Project One skill I developed from this project was the process of creating an app that targeted a community issue. First, I brainstormed and found a problem statement first before then thinking of solutions for them. Then, there was research and data collection. Surprisingly to me, these two steps took the longest amount of time and they often bounced between each other. I learned that the most amount of time was spent defining the problem statement, collecting data, and devising a solution rather than the actual coding.
New Programming Concepts Doing this project also taught me new concepts and designs in React Native. In React Native learned how to use dropdown selectors, Google Maps API, and JSON files. I also learned how to use multiple different languages together to create a goal. This was something new to me, but nevertheless, an important tool that I will use in the future. I found that switching between R and Python for data analysis and cleaning was easier than sticking to one language since R made numeric analysis easier and python made text analysis easier.
The Healthcare System This project also prompted me to grow my knowledge of the healthcare system. For example, I learned about health insurance and the various types such as Medicaid and privatized. Some important types of hospitals I learned about for this project were the distinction between private and public hospitals, and the meaning of Medicaid/Medicare-supported hospitals. Other concepts I learned about were how health insurance worked, why some doctors don’t accept insurance, and the different methods of evaluating hospitals.
What's next for Hosptial Find
New Features There are many new features that should be implemented in future updates. Users should be able to find hospitals that are near them through a search bar. There should also be a feature where users can input how much they care about pricing, safety, and patient satisfaction, and then it would suggest hospitals that fit the criteria.
Vision for the Future My hope is that in the future, more recent and more descriptive data will be available of the costs, safety, and performance of hospitals in New York and the Bronx. Right now there are only four metrics (safety, cost, vaginal/cesarian birth ratio, and patient satisfaction); however, if there were more statistics, users would be more informed about the hospital. For example, another statistic that should be added is what types of insurance a hospital accepts. This would increase accessibility as users could go to hospitals that would likely accept their insurance and not waste time or spend a lot of extra money.
One way more data could be collected is if the app itself would allow users to comment on their experience or collect data about the price of their itemized bill at a hospital. Allowing for self-reported data would also benefit local communities the most since data could be analyzed on the neighborhood level.

Log in or sign up for Devpost to join the conversation.