-
-

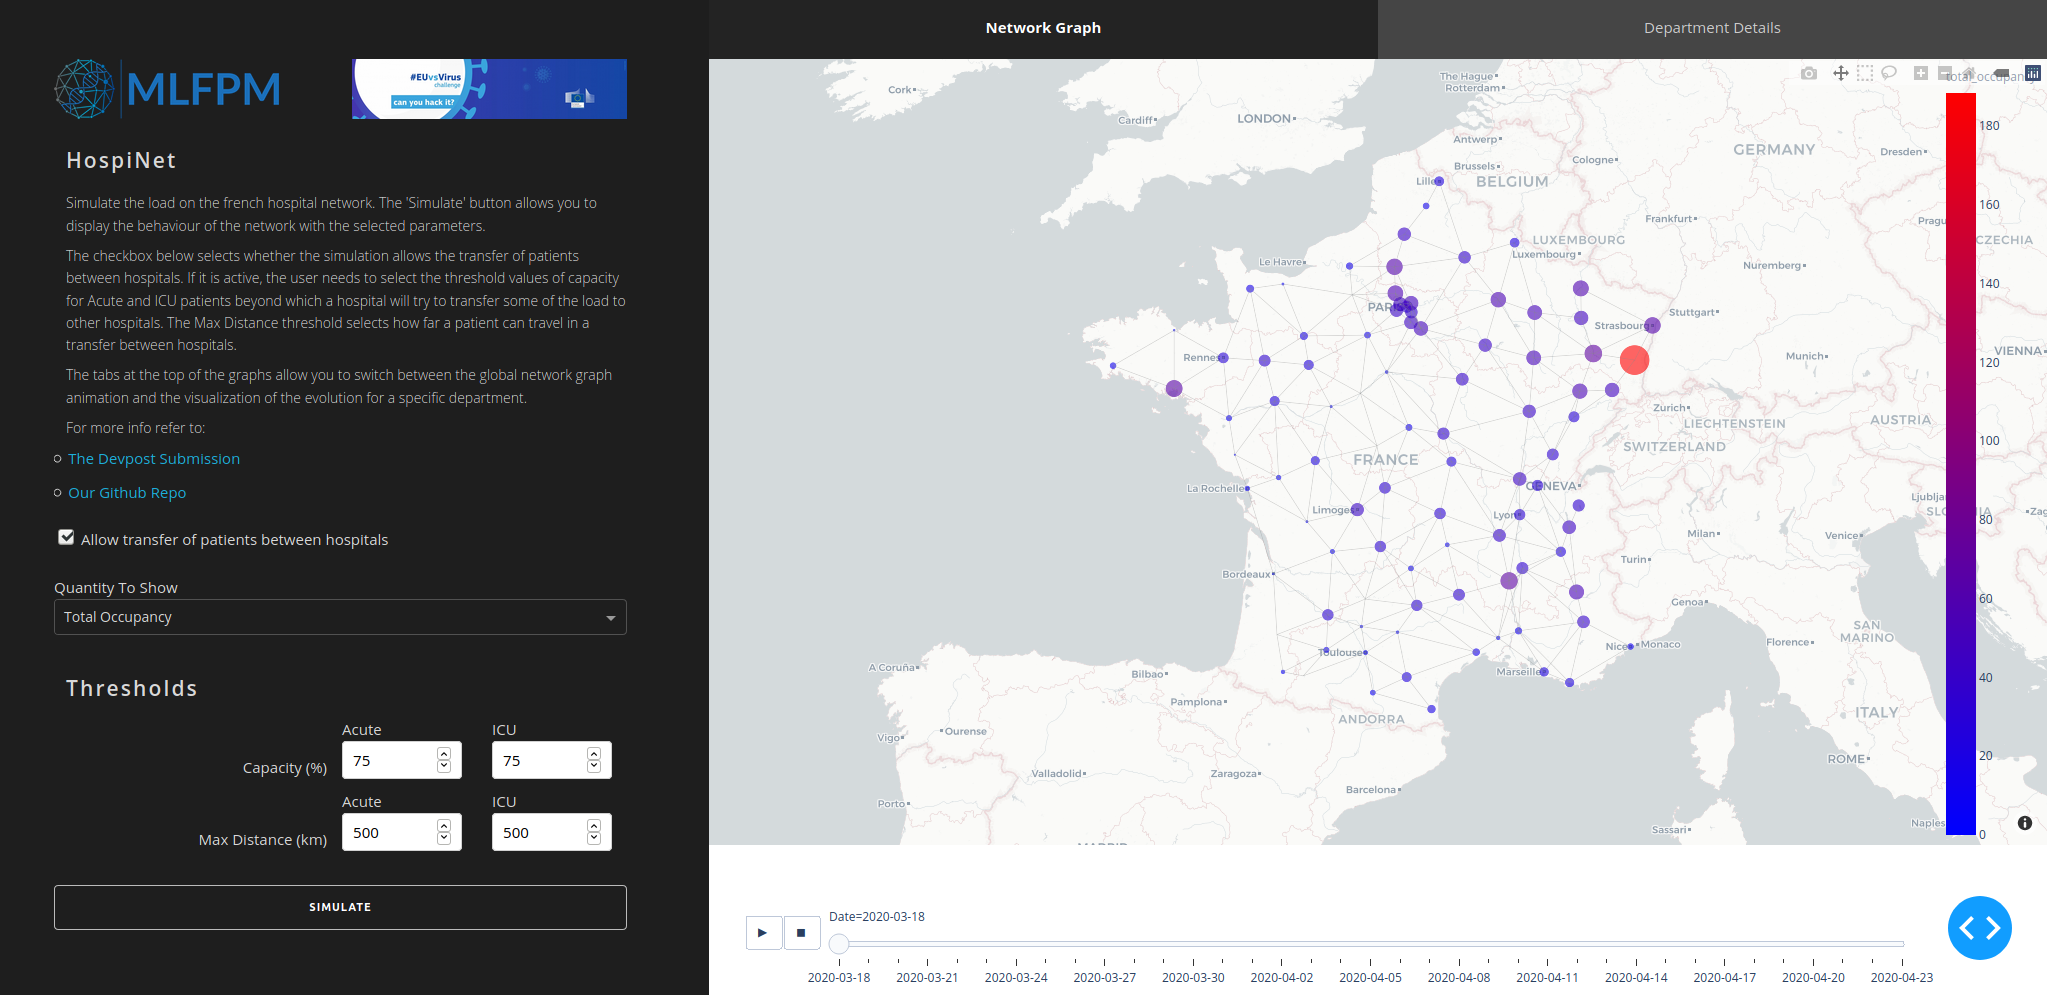
HospiNet interface
-

Number of reported hospital beds per departments
-
 GIF
GIF
Hospital occupancy over time - no patient propagation. Some regions get really overloaded, while others barely have patients.
-
 GIF
GIF
Hospital occupancy over time - patient propagation. Less affected nodes get more share of the overall load. Hubs still overload.


Inspiration
During the last few months, the world has been fighting against COVID-19. As a result, it has been dominating the media. A recurring problem seems to be a lack of preparedness and limited hospital resources for patients. However, certain regions have been hit significantly harder than others, resulting in an unevenly distributed load on the healthcare systems. Wouldn't it be nice to provide a solution to distributing the patient load more efficiently within hospitals, preventing them from overload? This is what inspired us to develop HospiNet.
What it does
In our simulations, we consider two scenarios. The first scenario simply shows the current statistics. These are the incoming patients in acute and ICU care, patients coming into a hospital, stay in that hospital. In the second one, we allow the movement of patients from one hospital to another. Moving patients happens when a hospital reaches a threshold capacity. Target hospitals will only accept patients when they are under their own threshold capacity. Targets are selected within a predefined radius, in order of closest to furthest.
How is it built
The code is developed in Python and hosted online at Heroku. The graph is defined using the networkx library. Additionally, we used the google_maps API.
Data sets
Patient count data set - *This dataset comes from a COVID-19 certified public service. In response to the COVID-19 pandemic, the French public data open platform Santé Publique France has made available daily reports a dataset of the ongoing hospitals' situation on the national territory. The reporting system is not exhaustive, hence the number of reporting establishments in a department varies over time. Also, some patients that have been reported at one point, maybe taken off the health structures' database whether the biological came back negative to COVID-19. We used the hospitals' dataset on a department level and by sex.
Hospital capacity data set - The French government provides a health establishment's annual statistics which is an exhaustive administrative inquiry from all health establishments in France (metropole and DOM-TOM) - Nombre de lits de réanimation, de soins intensifs et de soins continus en France, fin 2013 et 2018. This dataset describes the number of beds' evolution between 2013 and 2018, in the french health establishments. We used the given number of beds in 2018 per department.
Data representation
In our approach, France is represented as a graph: each node is the prefecture of each French department, and two nodes are connected through an edge in case the corresponding departments geographically border. Using the google_maps API we computed the distances between each of the nodes in the graph, which are used as edge weights in the graph. The nodes store as extra attributes the hospital capacity in the region and the current number of hospitalised patients, divided into ICU and acute care categories.
Propagation algorithm
Input: the graph representation of France, with the above-described nodes’ attributes.
Output: hospital-load for each department for all the considered time points.
Algorithm:
For each time point:
- Update incoming patient for each node
- For each node perform propagation (nodes are ordered by their degrees)
- compute the number of patients over capacity - what we would like to transfer
- get a list of available hospitals within a pre-defined radius, using shortest path algorithm
- loop over target nodes
- if the target can take in a certain amount of patients transfer, otherwise keep looking in the list of possible targets
- if no other hospital fulfils the criteria, keep the patients
We assume that the patient transfer is performed once a day after the incoming patient load is known. We also order the node ascending by their degrees of connectivity to avoid the scenario where more isolated nodes don't get a chance to distribute anymore because their more connected neighbours already flooded the possible nodes where they could propagate.
The solution’s impact on the crisis
This project is a case study that tries to find a solution to a problem in the current pandemic such that future pandemics might be handled in a more efficient way.
The necessities in order to continue the project
More detailed hospital admission data preferably by hospital bases. Correct information with regards to hospital capacity including regular capacity and additionally created capacity in case of an epidemic event.
Further investigation possibilities
The slope of the daily incoming patient count could be considered to dynamically adjust the capacity at which a hospital starts transferring patients or even accepting, in order to make the network more self-regulatory. Also, some dynamic programming approach could be developed to find the optimal way to distribute patients within nodes to get an even more uniform load distribution in the network.
The value of our solution after the crisis
The value of our project is mainly applicable to future pandemics, namely better distribution of patients among hospitals, preventing overload and lessening the pressure on hospital staff.


Log in or sign up for Devpost to join the conversation.