-
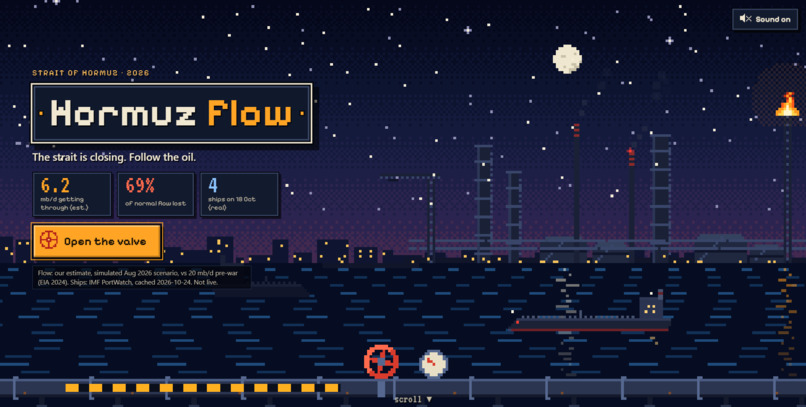
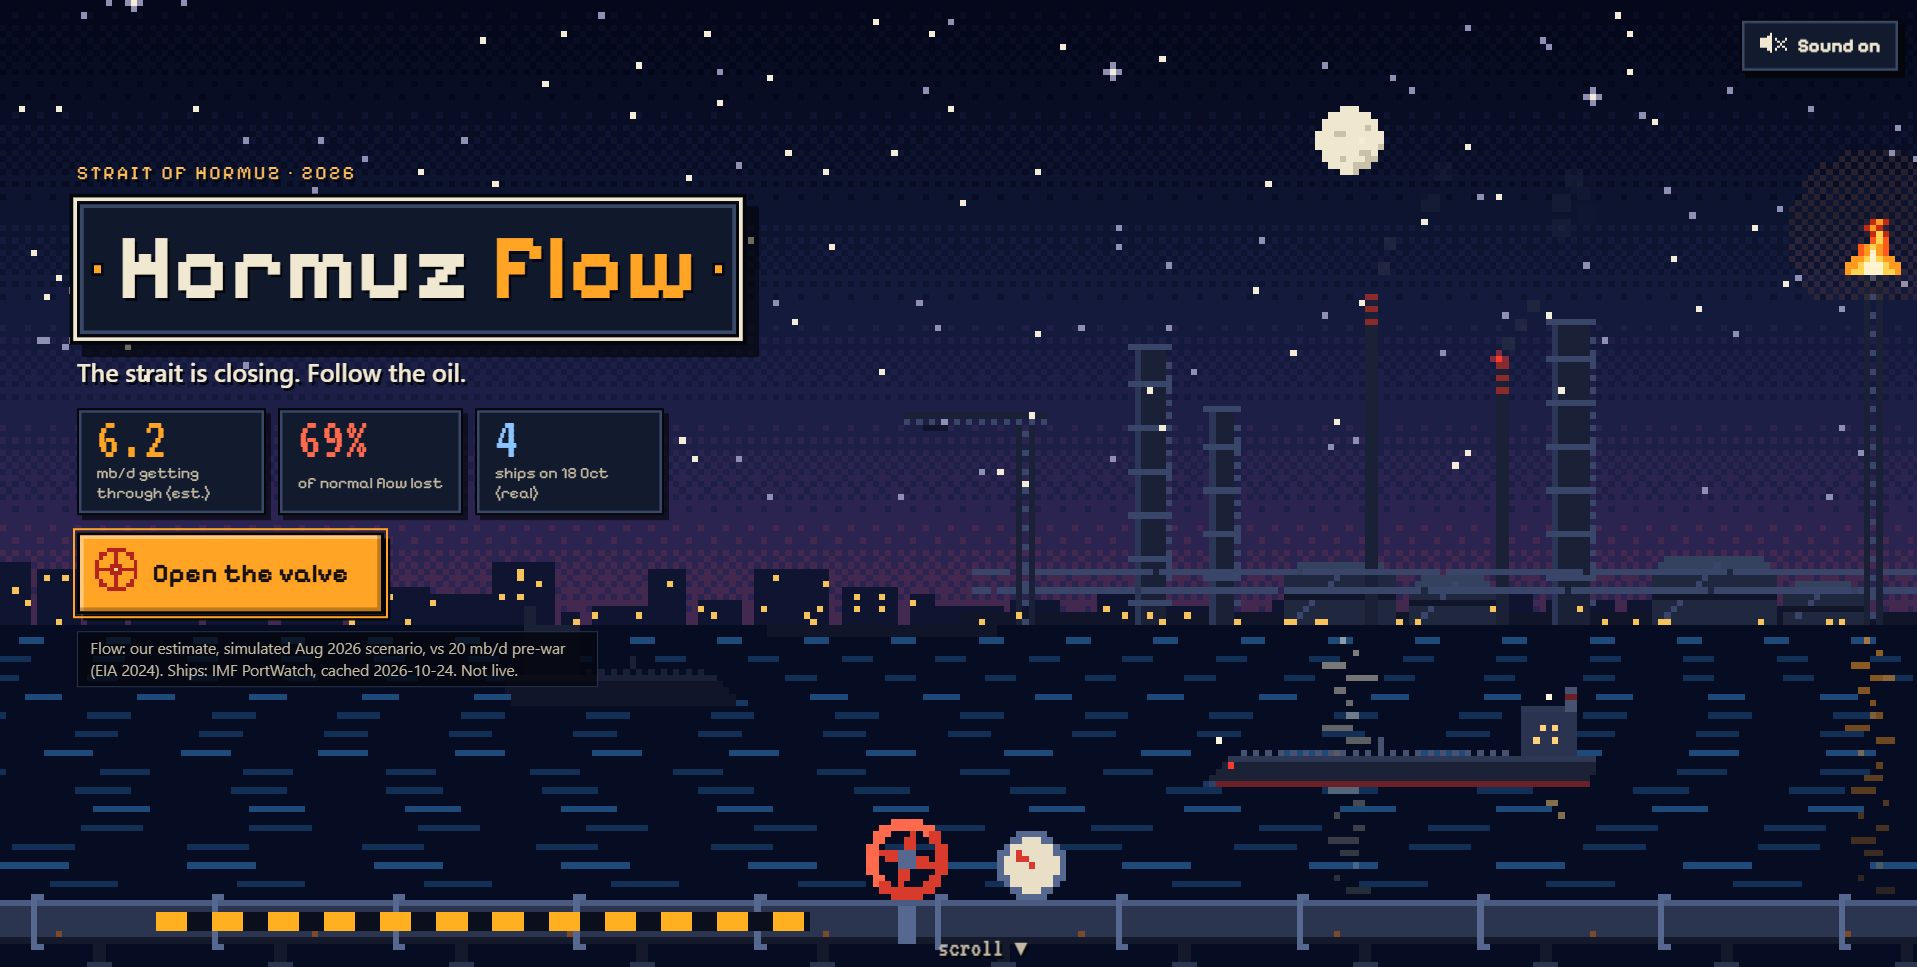
Landing page
-
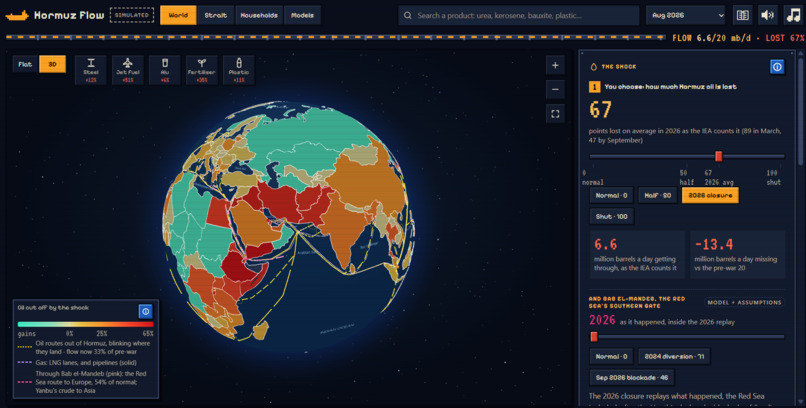
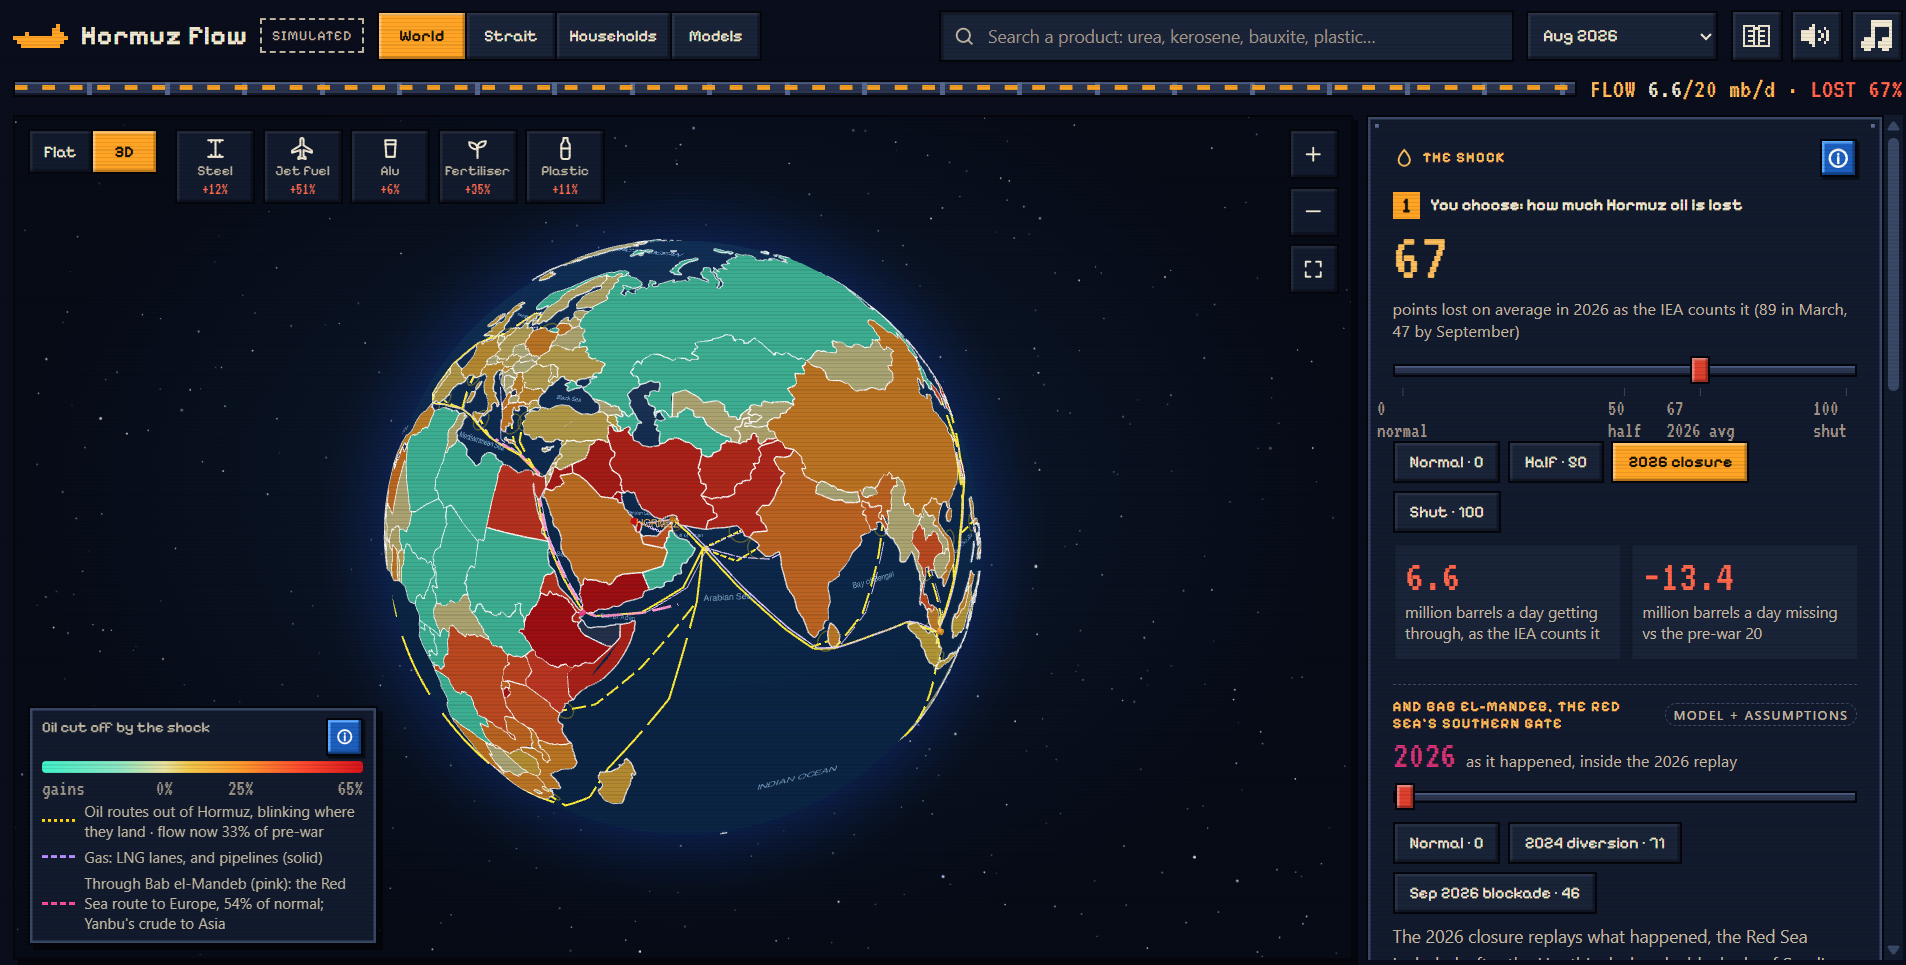
Globe view
-
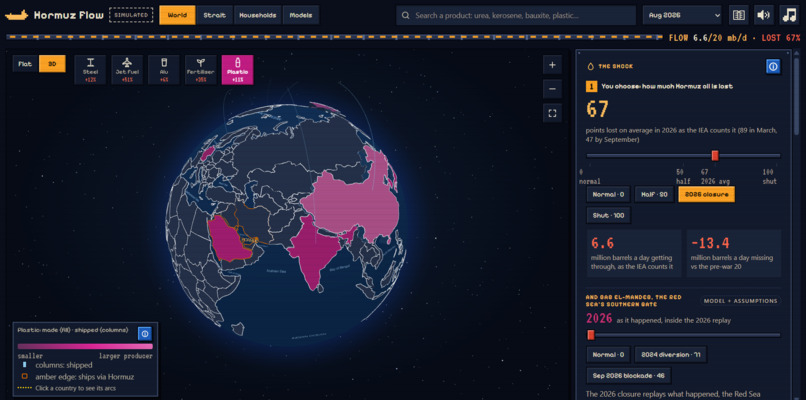
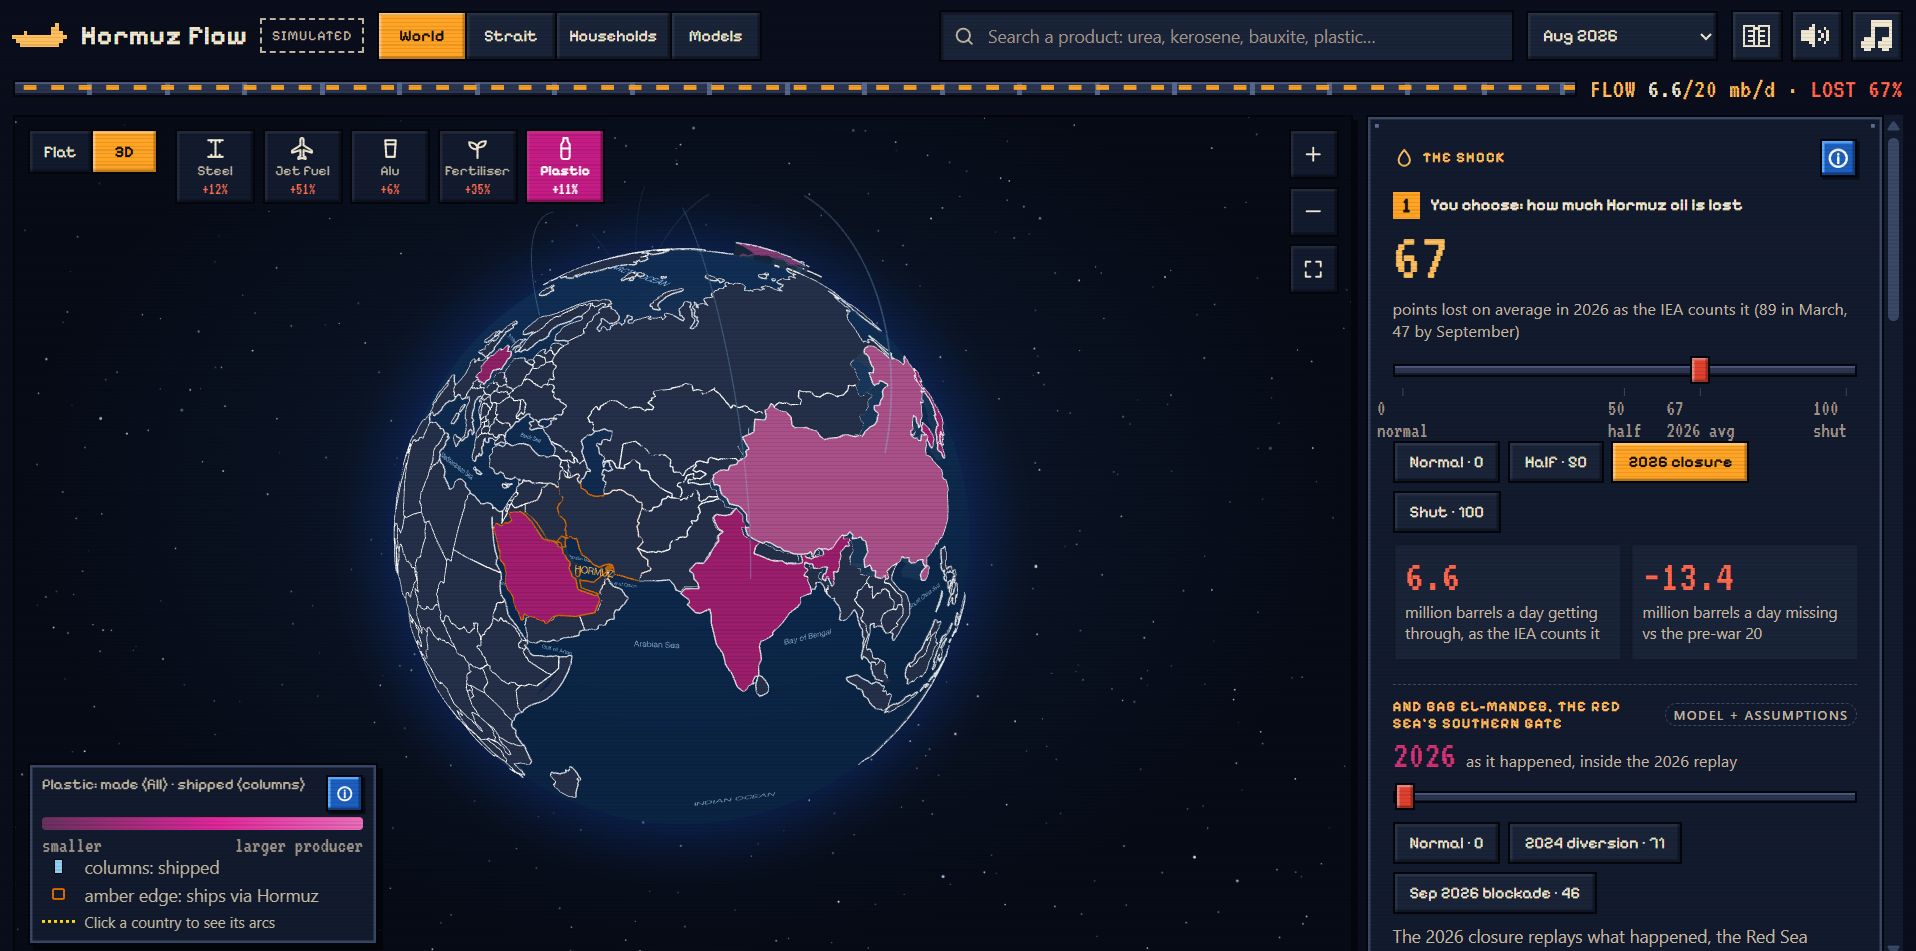
Globe view with plastic selected
-
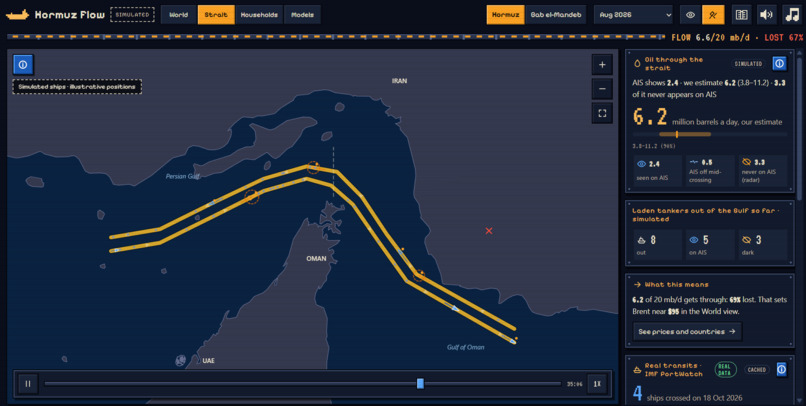
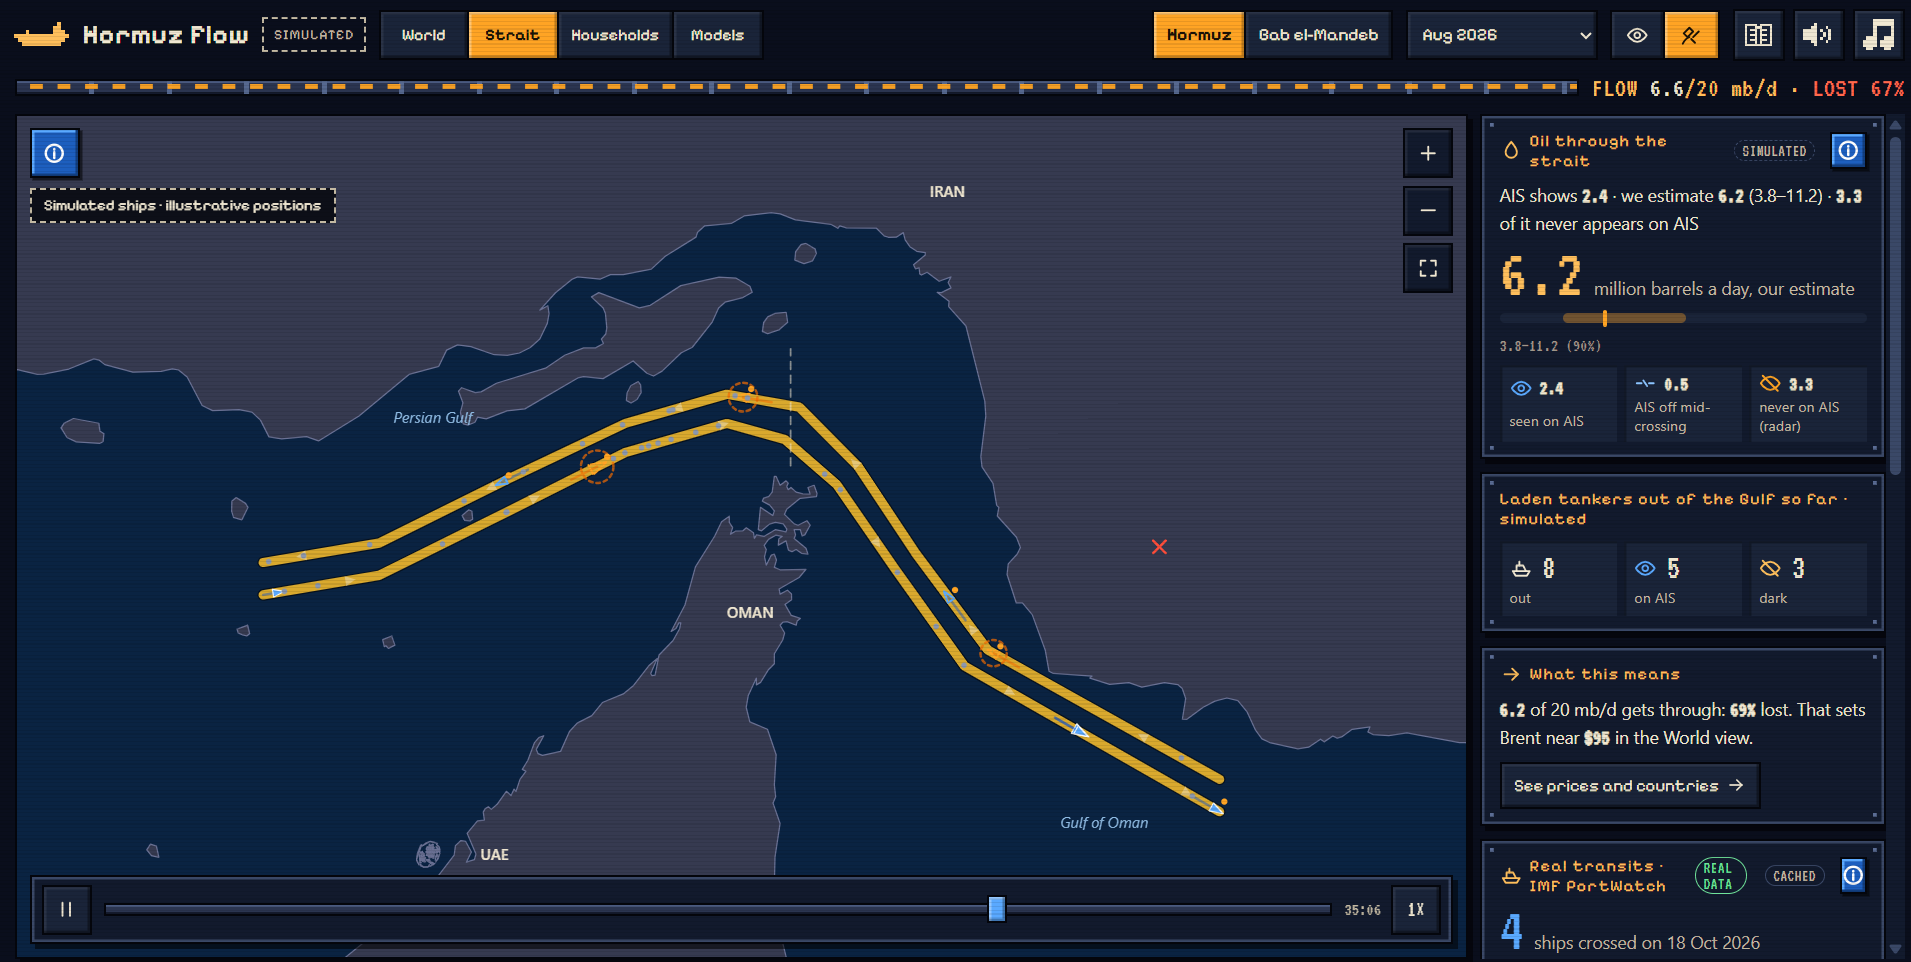
Hormuz strait
-
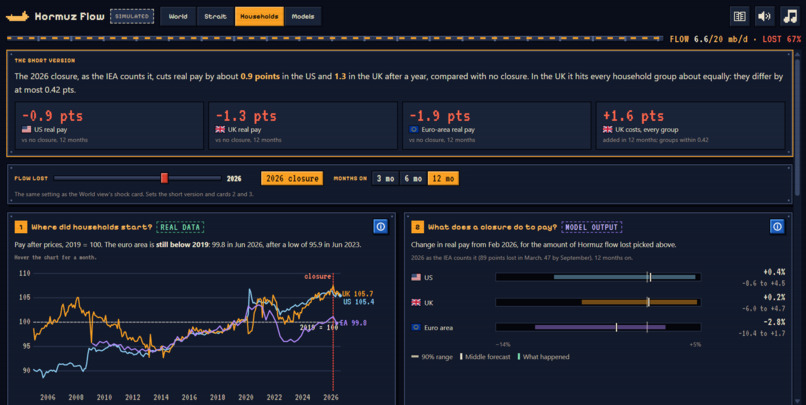
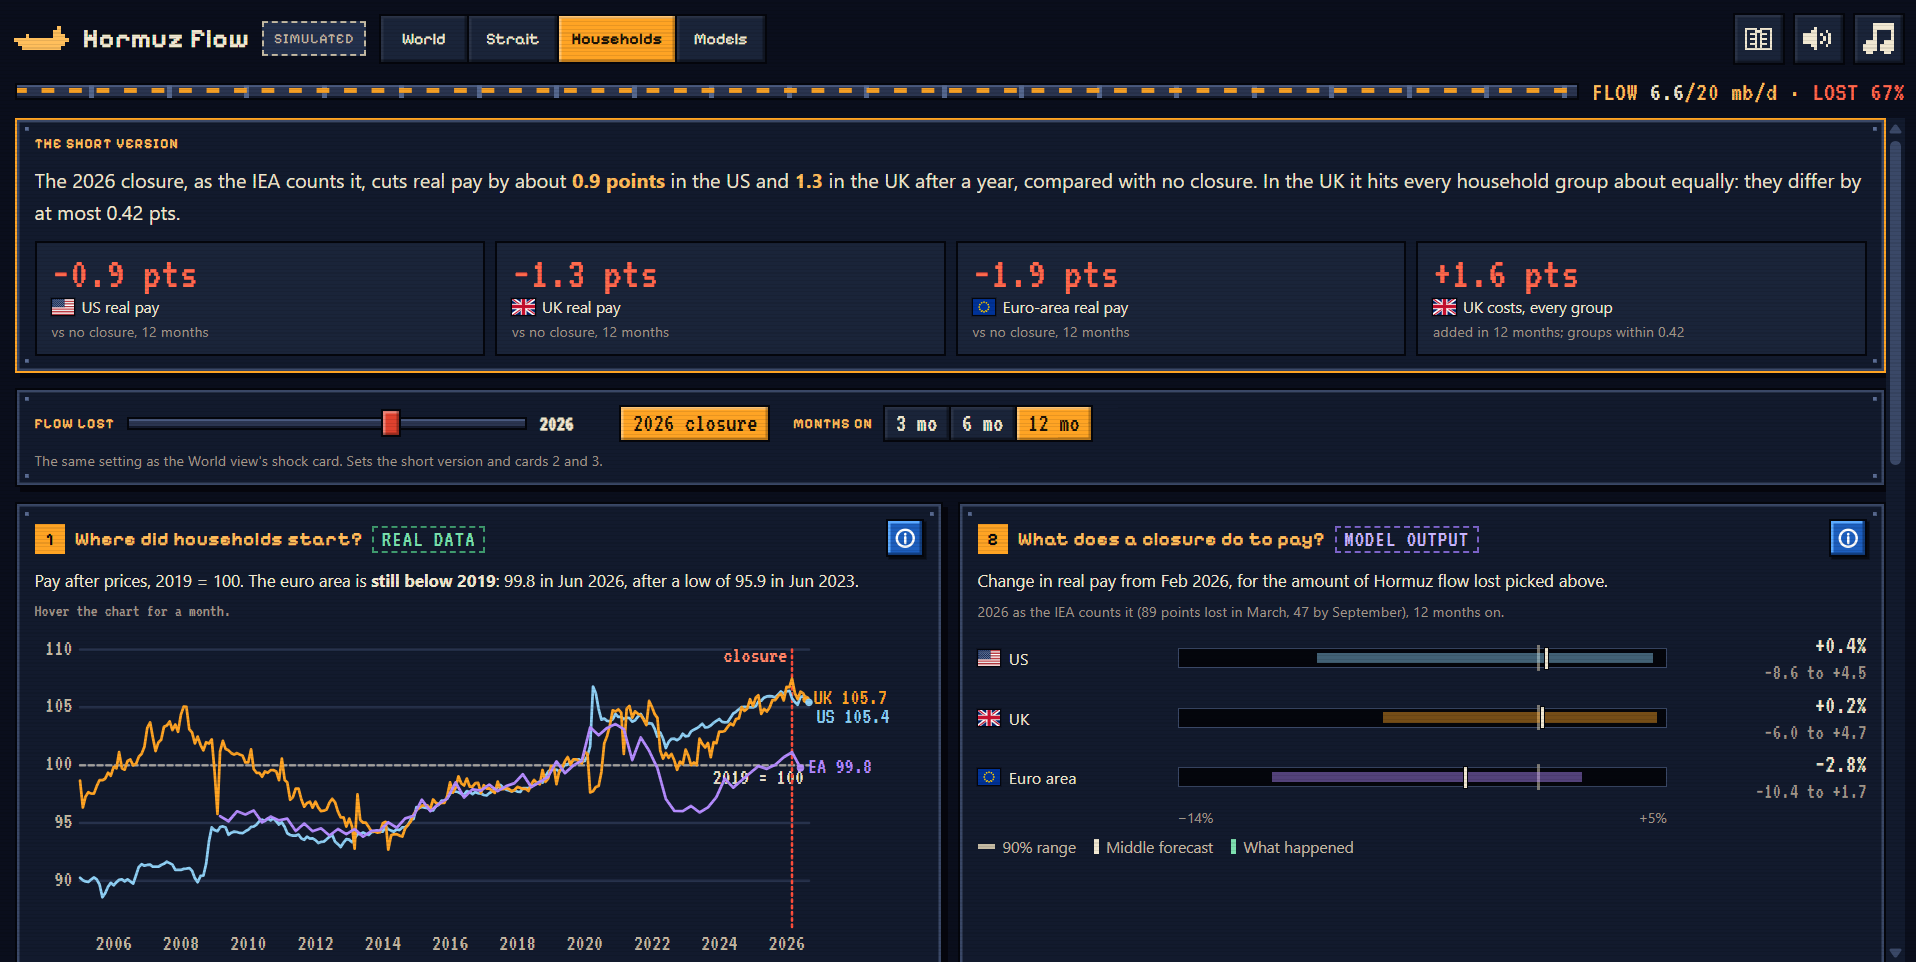
Household Stats
-
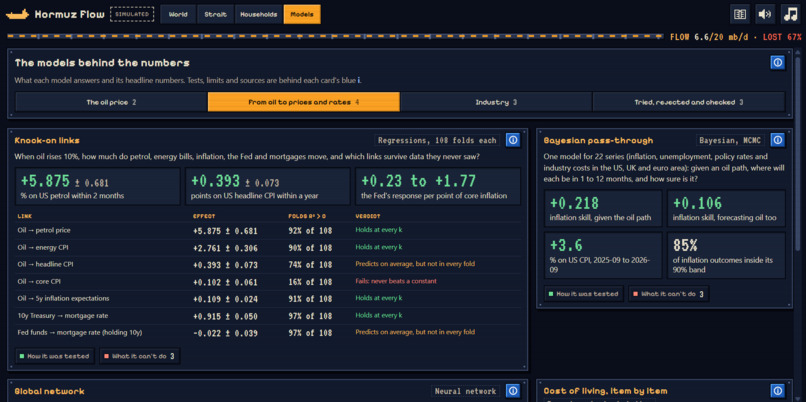
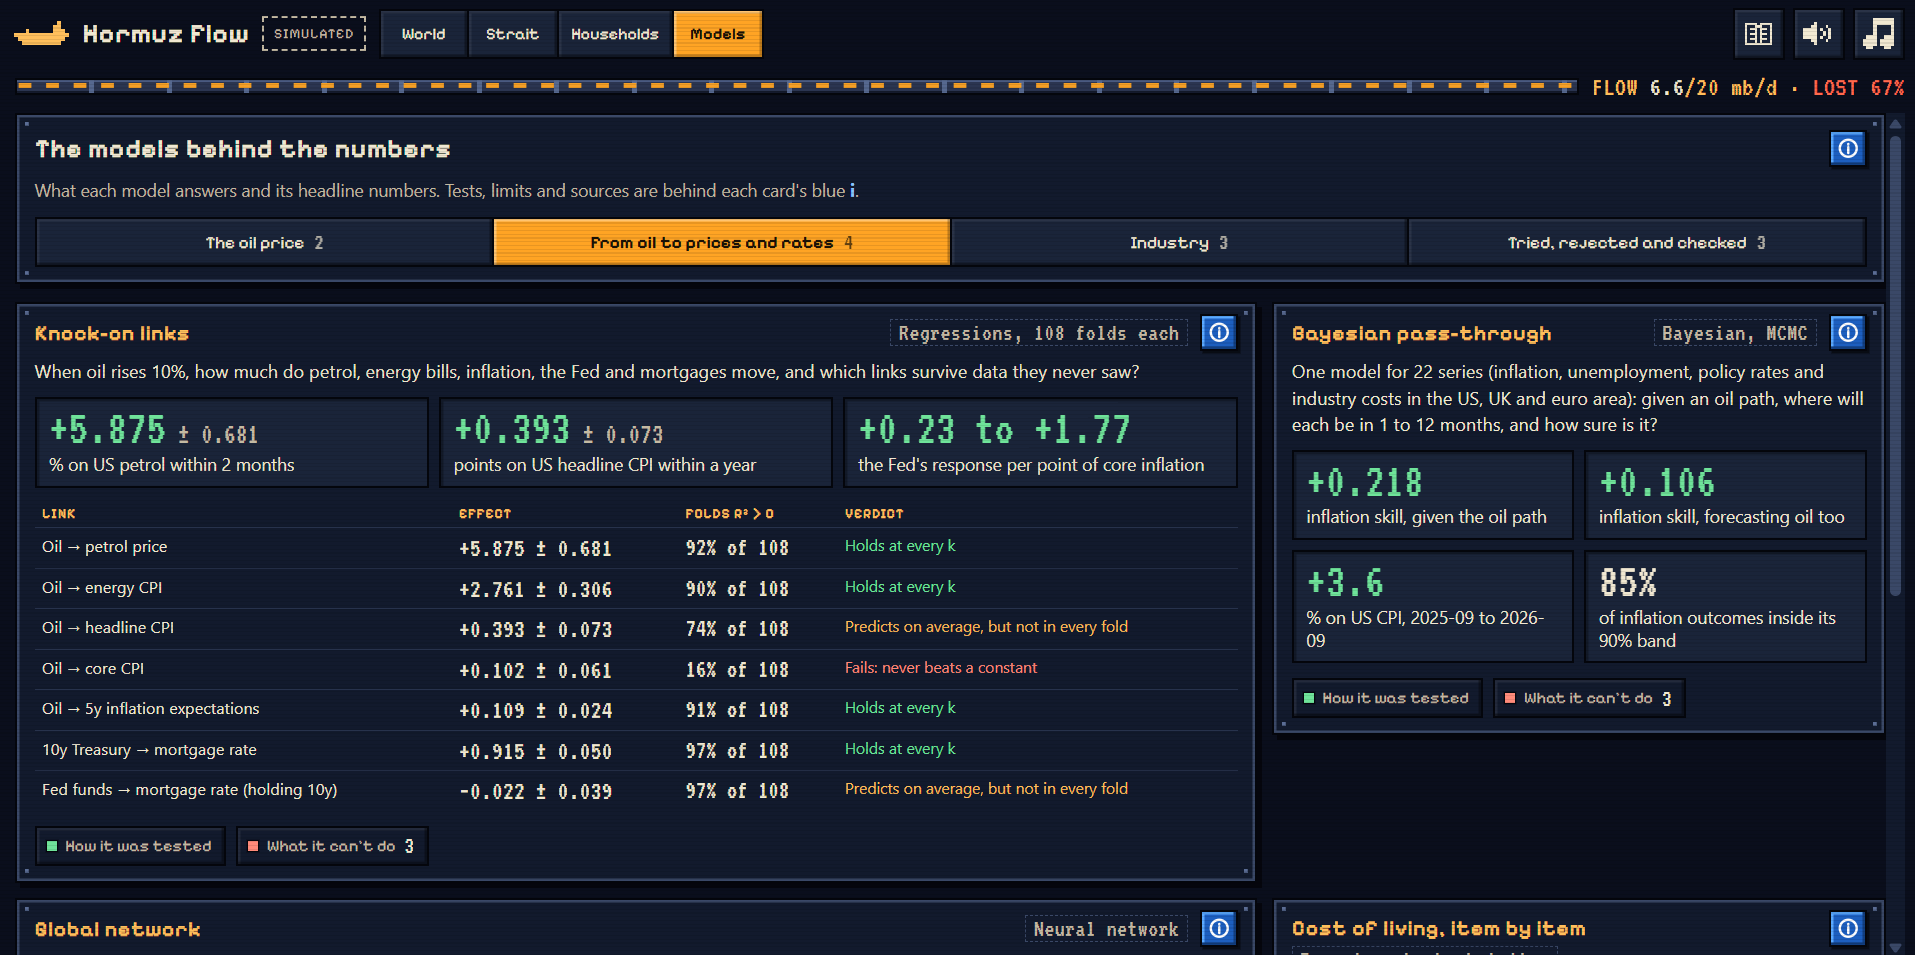
Model Stats
-
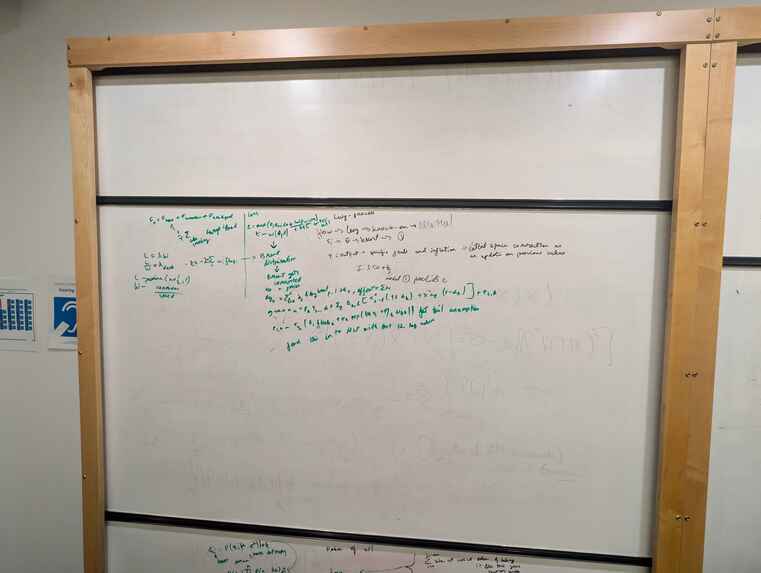
End-to-end architecture
-
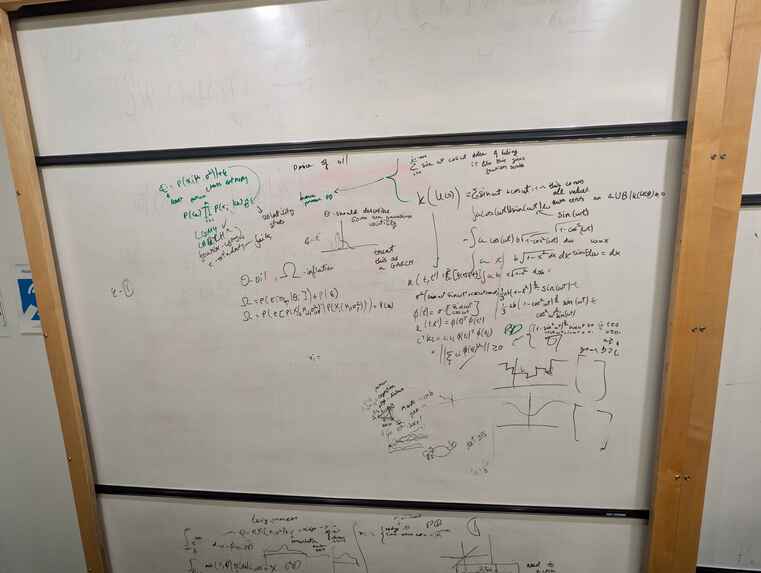
Levy Process
-
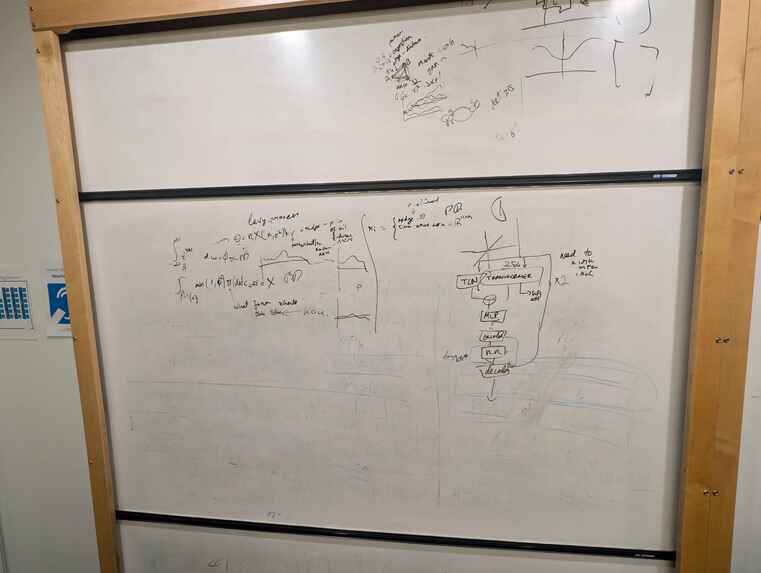
Architecture
Hormuz Flow was built through the power of little sleep, Claude, and good vibes!
What did we do?
In March 2026, the Strait of Hormuz closed. About a fifth of the world's oil normally goes through it, and within a month the price of Brent crude went from $71 to almost $120. Fuel, food and everyday prices followed, in countries a long way from the Gulf.
We wanted to answer two questions:
- How much oil is actually getting through?
- And what does that mean for the prices people pay?
Hormuz Flow tries to answer both, in four views:
- World: you choose how much of the strait's oil is lost, or replay 2026 as it happened, and it works out the oil price, then fuel, food and inflation, and how exposed each country is.
- Strait: a simulation of the tankers crossing the strait, including the ones that switch their trackers off.
- Households: pay against prices since 2019, and which UK households are hit hardest.
- Models: a card for each model behind the numbers, with the question it answers, its headline results, how we tested it and what it can't do. Every number on those cards is read from our notes when the app is built, with the date the note was written.
Inspiration
Published estimates of how much oil was getting through the strait differed by a factor of three. The data needed to work out what that means for prices is all public, but it is spread across a dozen sources and nobody had put it together in one place.
How we built it
We used all of the following:
- Python for the models
- A single HTML page with D3 and globe.gl for the app
- A Lévy-process model (GARCH-CGMY) for day-to-day oil price movements
- A curve linking lost oil flow to the oil price, fitted to the 2026 closure
- A Bayesian model and two neural networks for the knock-on effects on fuel, food and inflation, tested on forecasts from 2008 to 2025
- Monte Carlo simulation for the range of possible outcomes
- Data from the IEA, IMF PortWatch, FRED, the ONS and Eurostat
- The University of Southampton's Iridis cluster for the heavier model fits
- One Claude Code session each, handing work to each other through Linear
Challenges we ran into
- There is no free live ship-tracking feed for Hormuz, so the strait view uses simulated ships and says so on screen
- Two sources counted the strait very differently. IMF PortWatch only sees ships with their trackers on, while the IEA counts the hidden ones too. Switching to the IEA's figures meant redoing the price curve and the app
- Our inflation forecast seemed to beat the professional forecasters, until we found it had been given a month of data they didn't have yet. With that fixed, it is level with them
- Putting a source and a date on every number in the app
Accomplishments that we're proud of
We fitted the models only on data from before the closure, then gave them the oil prices that actually happened. The cost-of-living model got 53 of 54 price changes inside its predicted range.
What we learned
A lot of oil moves where tracking can't see it. By August, PortWatch had the strait almost empty, while the IEA had it carrying 7 to 11 million barrels a day.
We also found that in a supply shock, fuel prices react about one and a half times as strongly as they normally do.
Also, Claude is REALLY good at UI.
What's next for Hormuz Flow
Real ship data, and more chokepoints, starting with Malacca and Suez.


Log in or sign up for Devpost to join the conversation.