-
-
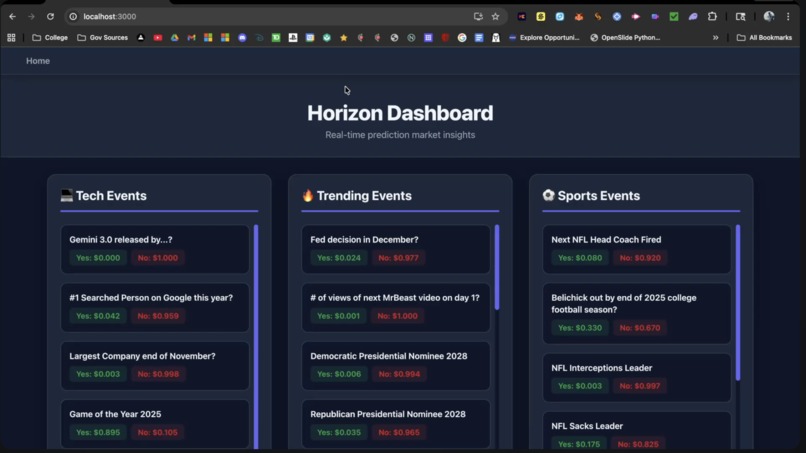
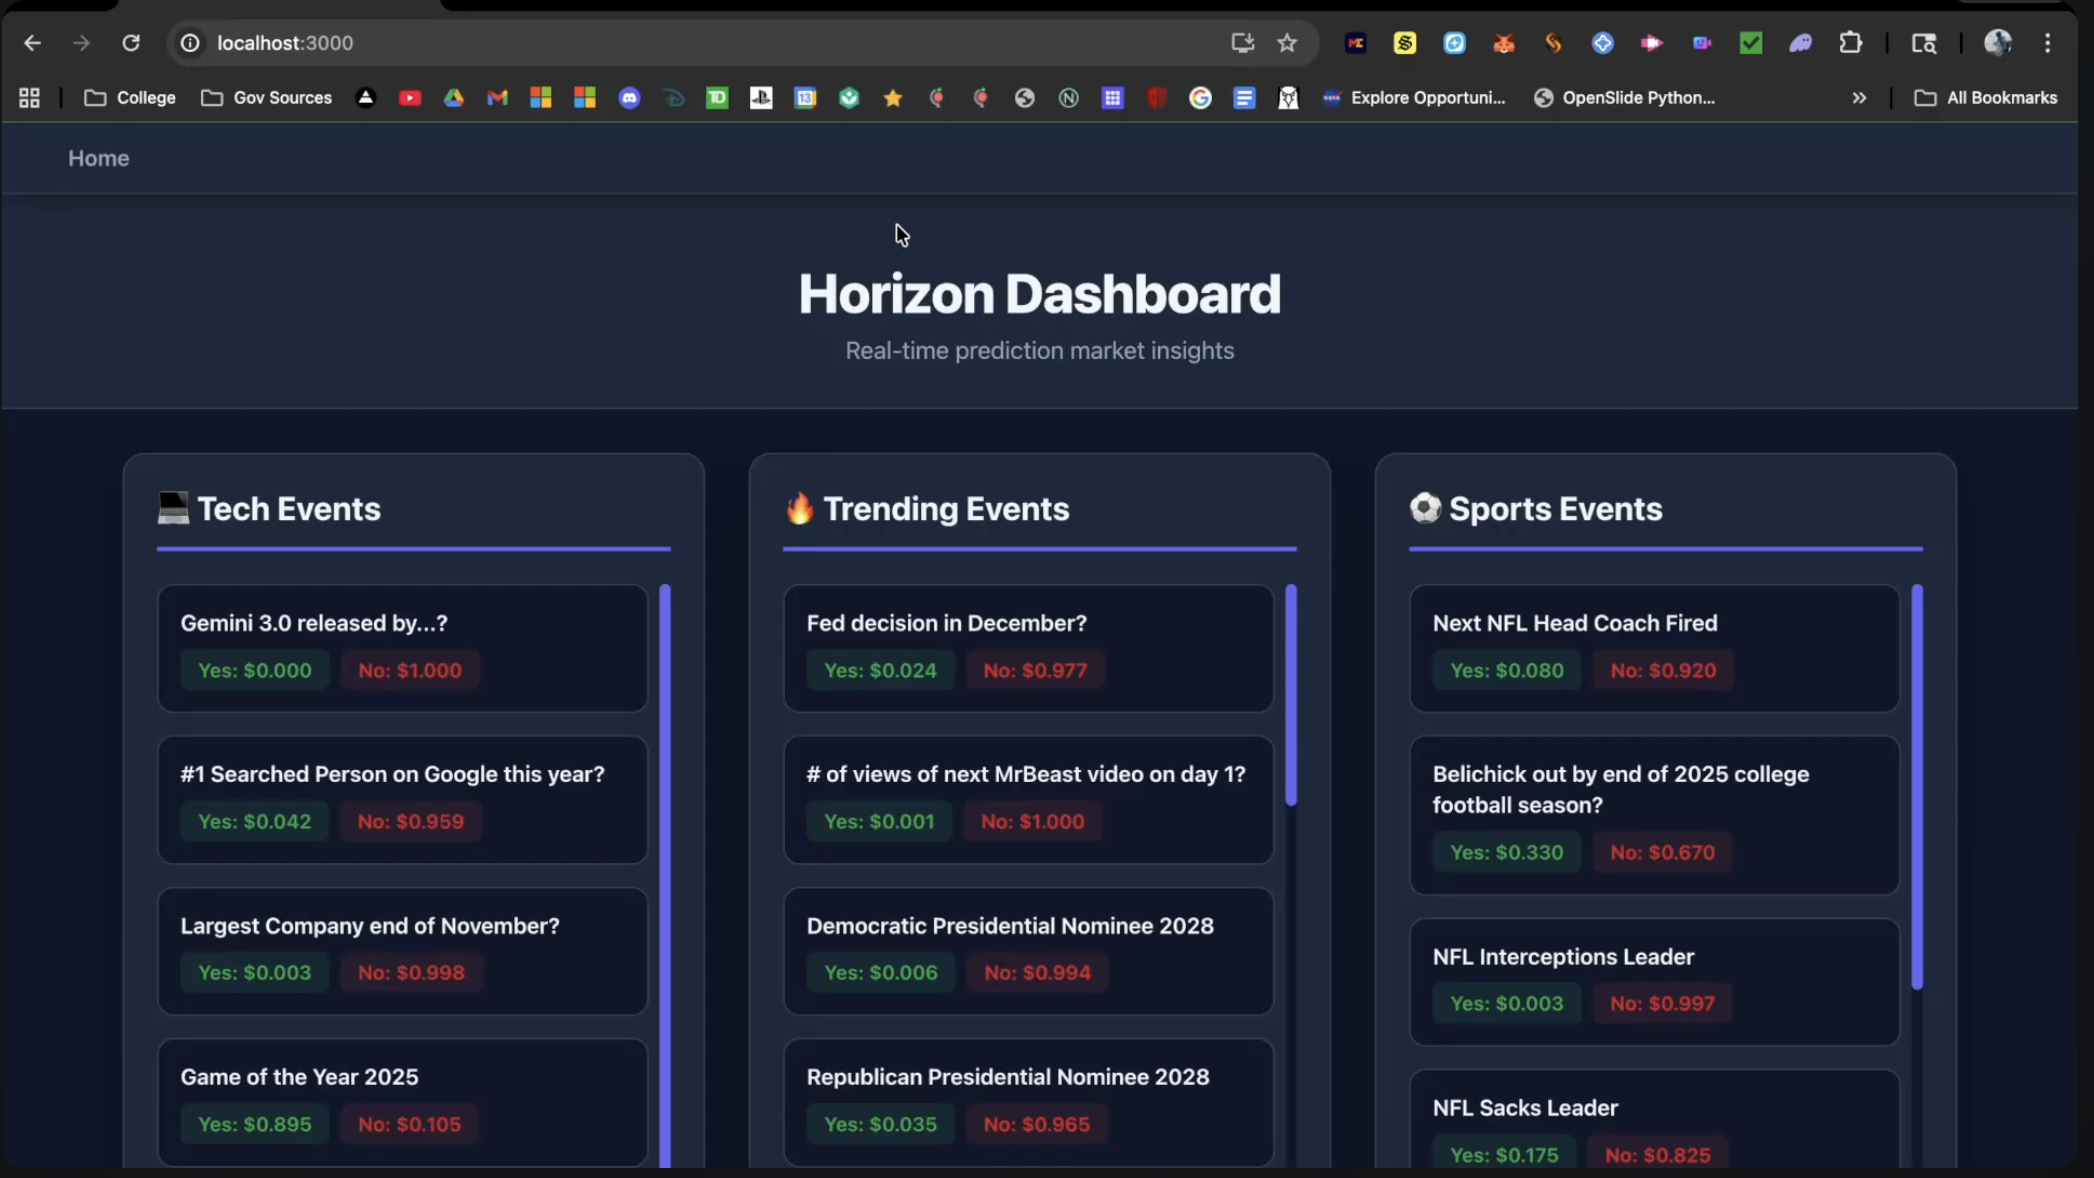
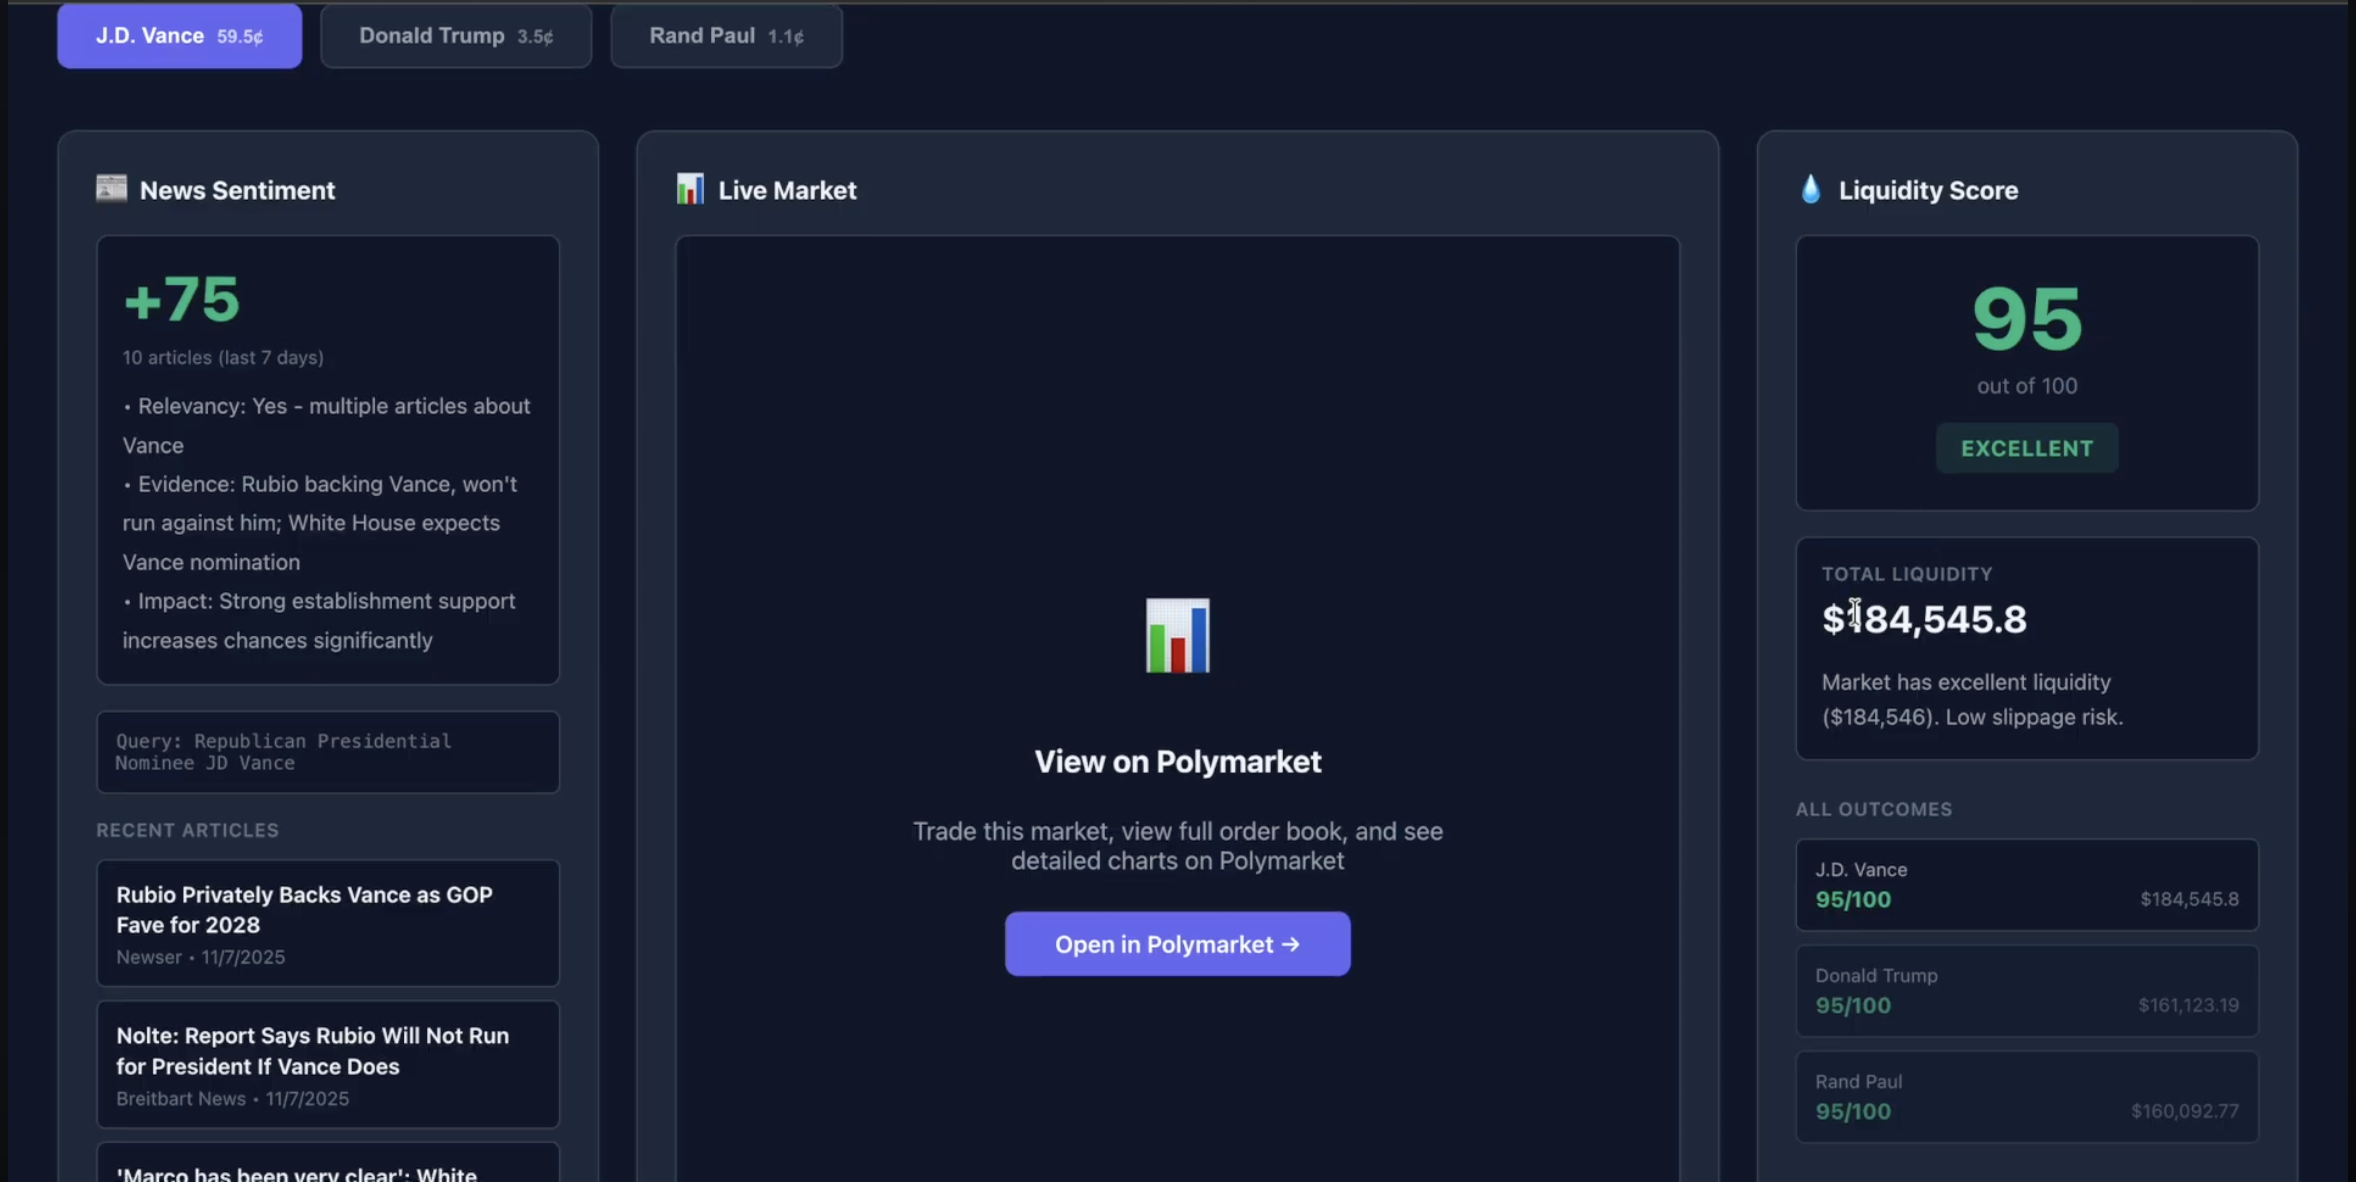
Dashboard
-
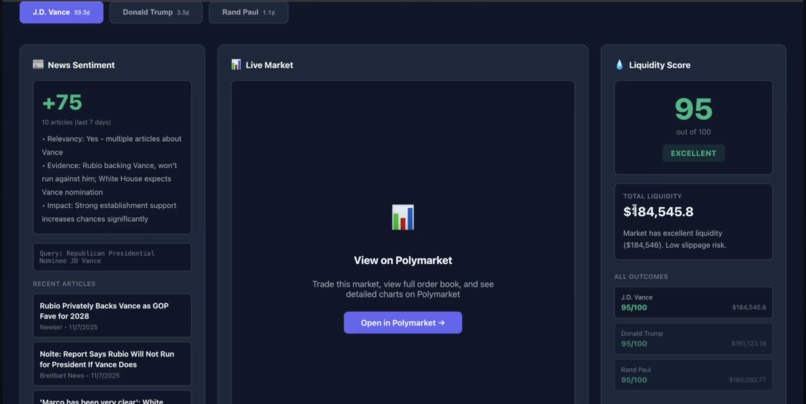
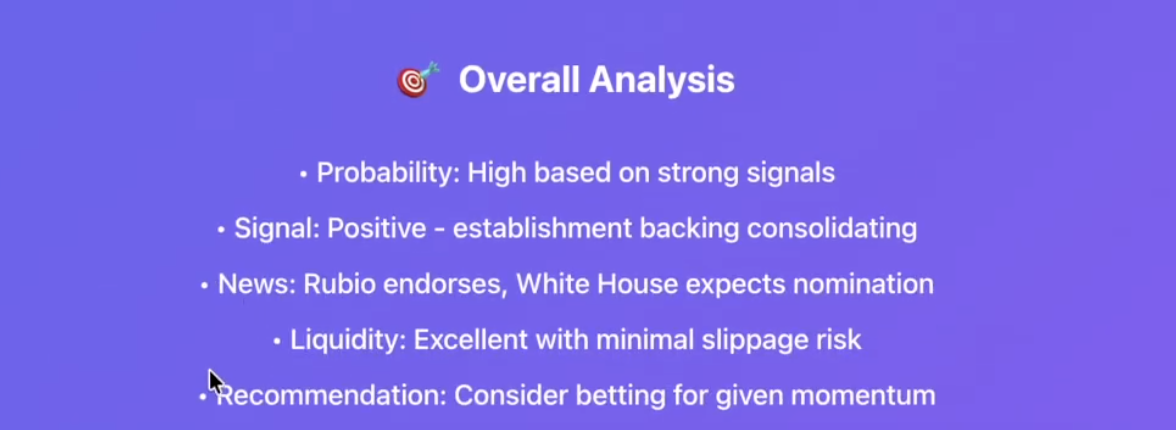
Analysis Page
-
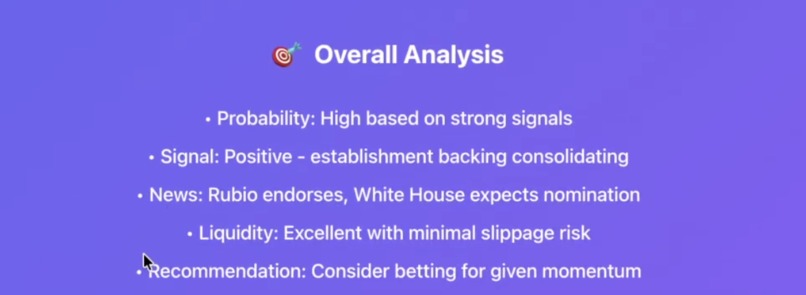
Final Summary
Inspiration
We were inspired by the "Polymarket x Claude" challenge. We've always been fascinated by prediction markets, but we found a core problem: a market's price tells you what traders think, but never why. Is a 12¢ price based on a credible rumor, a major news event, or just zero liquidity?
We wanted to build a tool that could answer that "why" at a glance. Our idea was to use Claude not as a magic 8-ball to predict the future, but as a tireless AI analyst that could synthesize real-world data (like news and market depth) into a simple, human-readable insight.
What it does
Horizon is an AI-powered analysis dashboard that provides a qualitative "story" behind any Polymarket event.
Instead of just showing a price, our platform performs a multi-step analysis for each potential outcome:
- Calculates a Factual Liquidity Score: It first runs a Python-based calculation to score the market's liquidity from 0-100, labeling it from "Zero" to "Excellent." This tells a user the risk and stability of the price.
- Generates AI-Powered Search Queries: It uses a "pre-search" Claude prompt to generate intelligent Google News queries related to the market.
- Fetches & Analyzes News: It uses those queries to fetch recent, relevant articles from the NewsAPI. It then feeds these articles back to Claude to generate a News Sentiment Score (from -100 to +100).
- Writes a Final Summary: Most importantly, it takes all these factual data points (Liquidity Score + News Sentiment) and gives them to Claude one last time to write a final, 2-3 sentence "Overall Summary" that explains the context of the market in plain English.
How we built it
We built Horizon on a modern, decoupled architecture: a FastAPI (Python) backend and a React frontend.
The backend is the "brain" of the operation. We built it with a service-oriented structure:
main.pyis the FastAPI router that orchestrates all the services.polymarket_fetcher.pyhandles pulling homepage events from Polymarket.market_depth_service.pyis a non-AI service that performs our factual 0-100 liquidity calculations.news_service.pyintegrates with NewsAPI and is responsible for fetching time-bound (last 7 days) articles.claude_service.pyis our AI hub. It contains all the prompts for our multi-step analysis chain: first to generate search queries, then to analyze news sentiment, and finally to summarize all the data.
The frontend is a responsive React app that displays this data. It uses React Router to manage a main HomePage (the dashboard) and a dynamic AnalysisPage that fetches and displays the analysis for any market a user clicks on.
Challenges we ran into
Our biggest challenge, by far, was the "Garbage In, Garbage Out" (GIGO) problem.
Our first, naive attempt was to ask Claude for a single "Overall Score" for any market. This failed spectacularly. Our dashboard lit up with useless, deeply negative scores: -50, -75, -100. We were frustrated until we read the AI's reasoning: "The news articles do not directly mention..." and "...market depth shows zero liquidity."
The AI wasn't broken; it was correctly telling us there was zero signal. Our logic was simply (and incorrectly) translating "No Signal" into a "Negative Score."
This led to our biggest pivot. We had to abandon our initial "Smart Wallet" analysis feature. It was a great idea, but it was not feasible because 99% of markets have zero trade history to analyze. We made the tough call to cut it and focus on what we could reliably get: News and Liquidity.
Accomplishments that we're proud of
We are incredibly proud of the final AI pipeline we engineered. Instead of one "magic" prompt, we created a two-step AI chain:
- AI as Researcher: Using Claude to generate better search queries for NewsAPI.
- AI as Analyst: Using Claude to analyze the results of that search.
This solved our "no relevant news" problem and felt like a true human-machine collaboration.
We're also proud of our pivot. Recognizing that our initial "prediction" goal was flawed and refactoring the entire project to focus on a qualitative "summary" was a huge challenge, but it's what made the project successful and genuinely useful.
What we learned
The single biggest lesson we learned is this: A qualitative summary is infinitely more valuable than a flawed quantitative score.
For 99% of niche markets, "no signal" is the signal. Our final dashboard successfully reports this. Instead of a misleading "-75," it now shows:
- News Sentiment: 0 (Neutral)
- Liquidity Score: 10 (Very Thin)
- Summary: "There is no signal for this outcome. Our analysis found no relevant news. This, combined with zero liquidity, suggests the
Built With
- claude
- fastapi
- html
- javascript
- newsapi
- polymarketapi
- python
- restapi

Log in or sign up for Devpost to join the conversation.