-

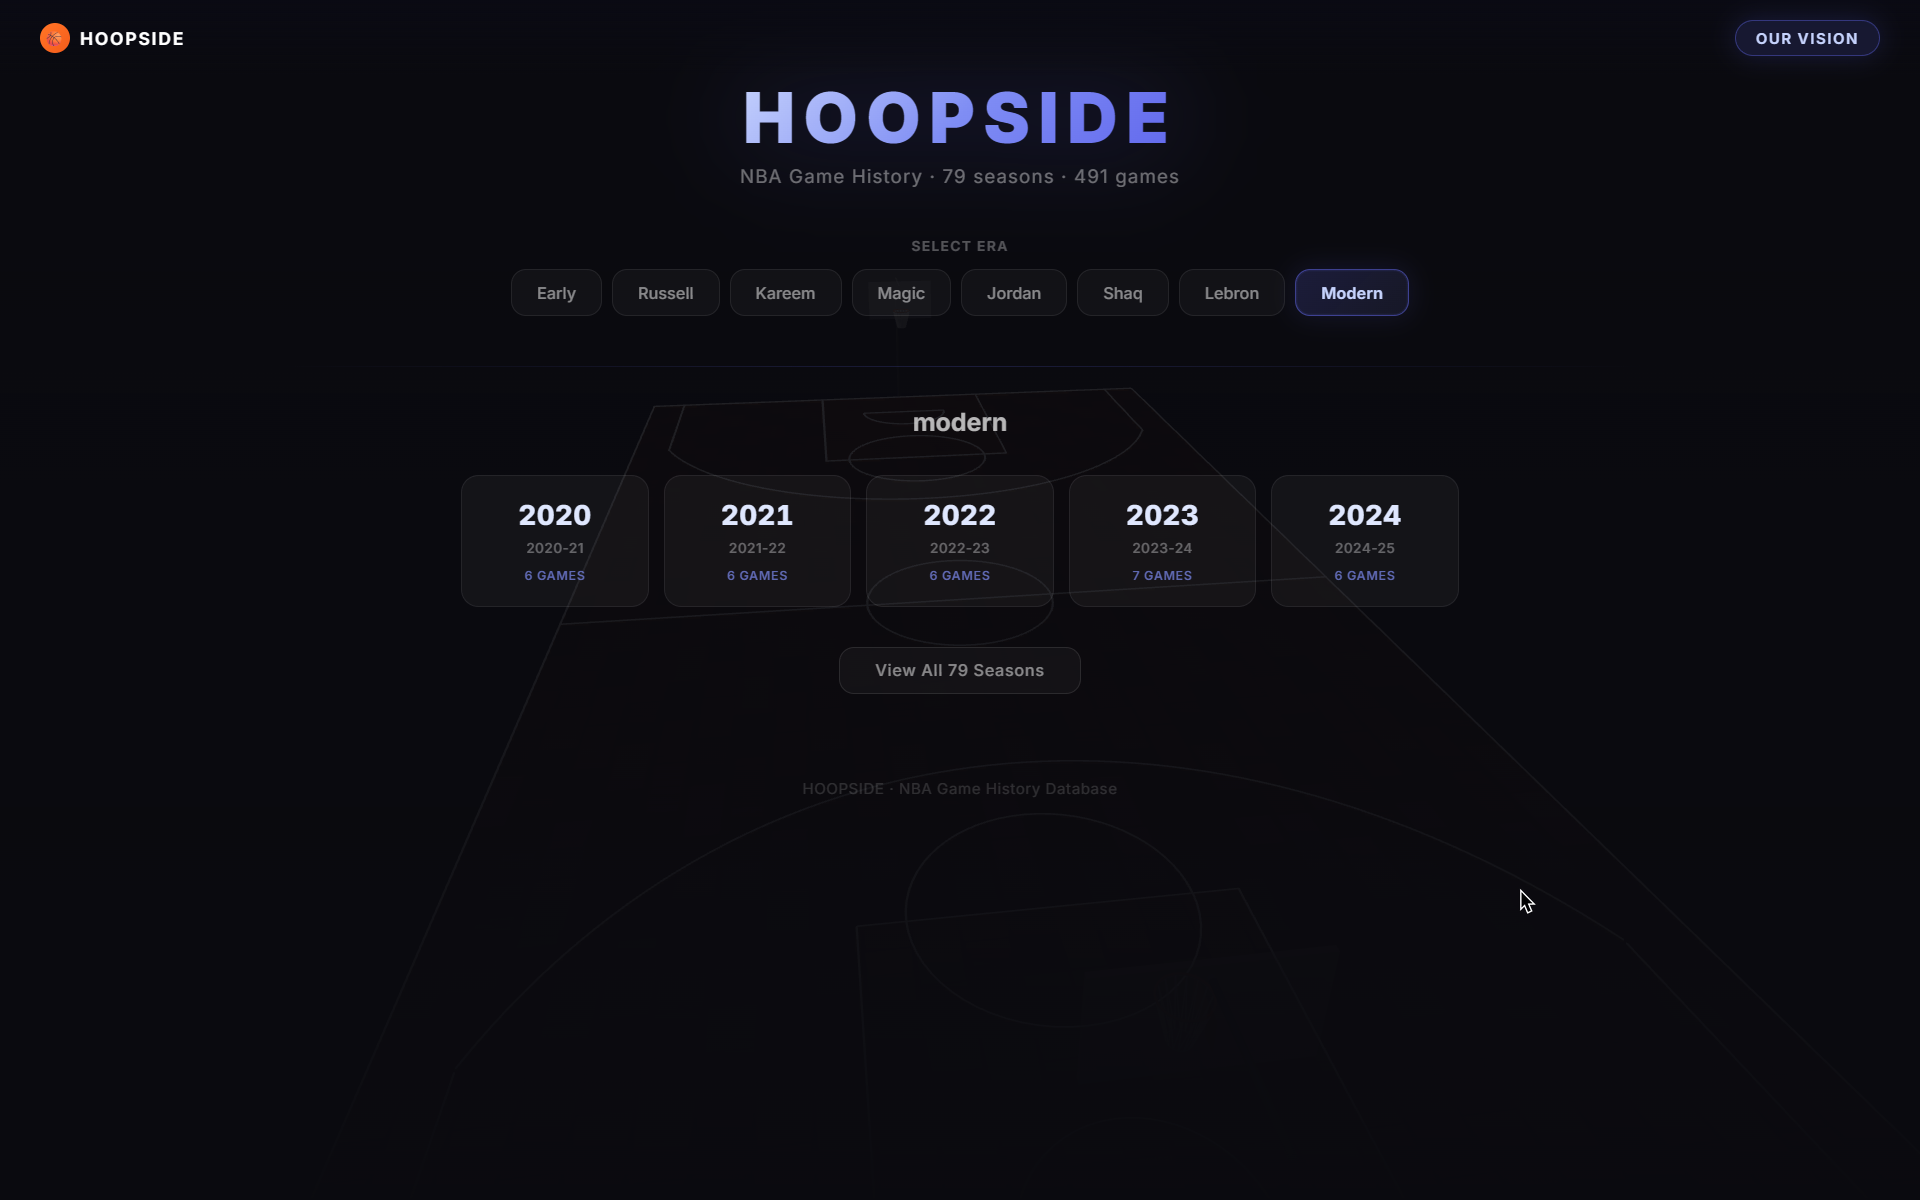
Home Page — The landing page introduces Hoopside and its vision for interactive basketball history
-
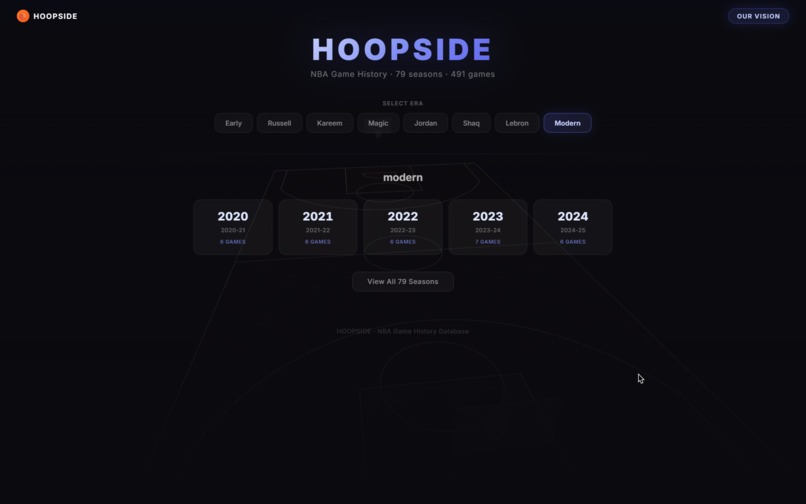
Era selectionEra Selection — Explore basketball eras and discover historical games through tracking data.
-
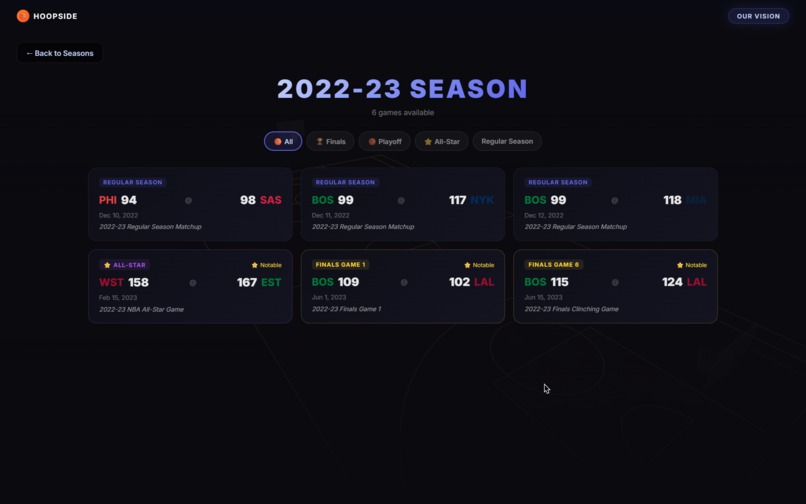
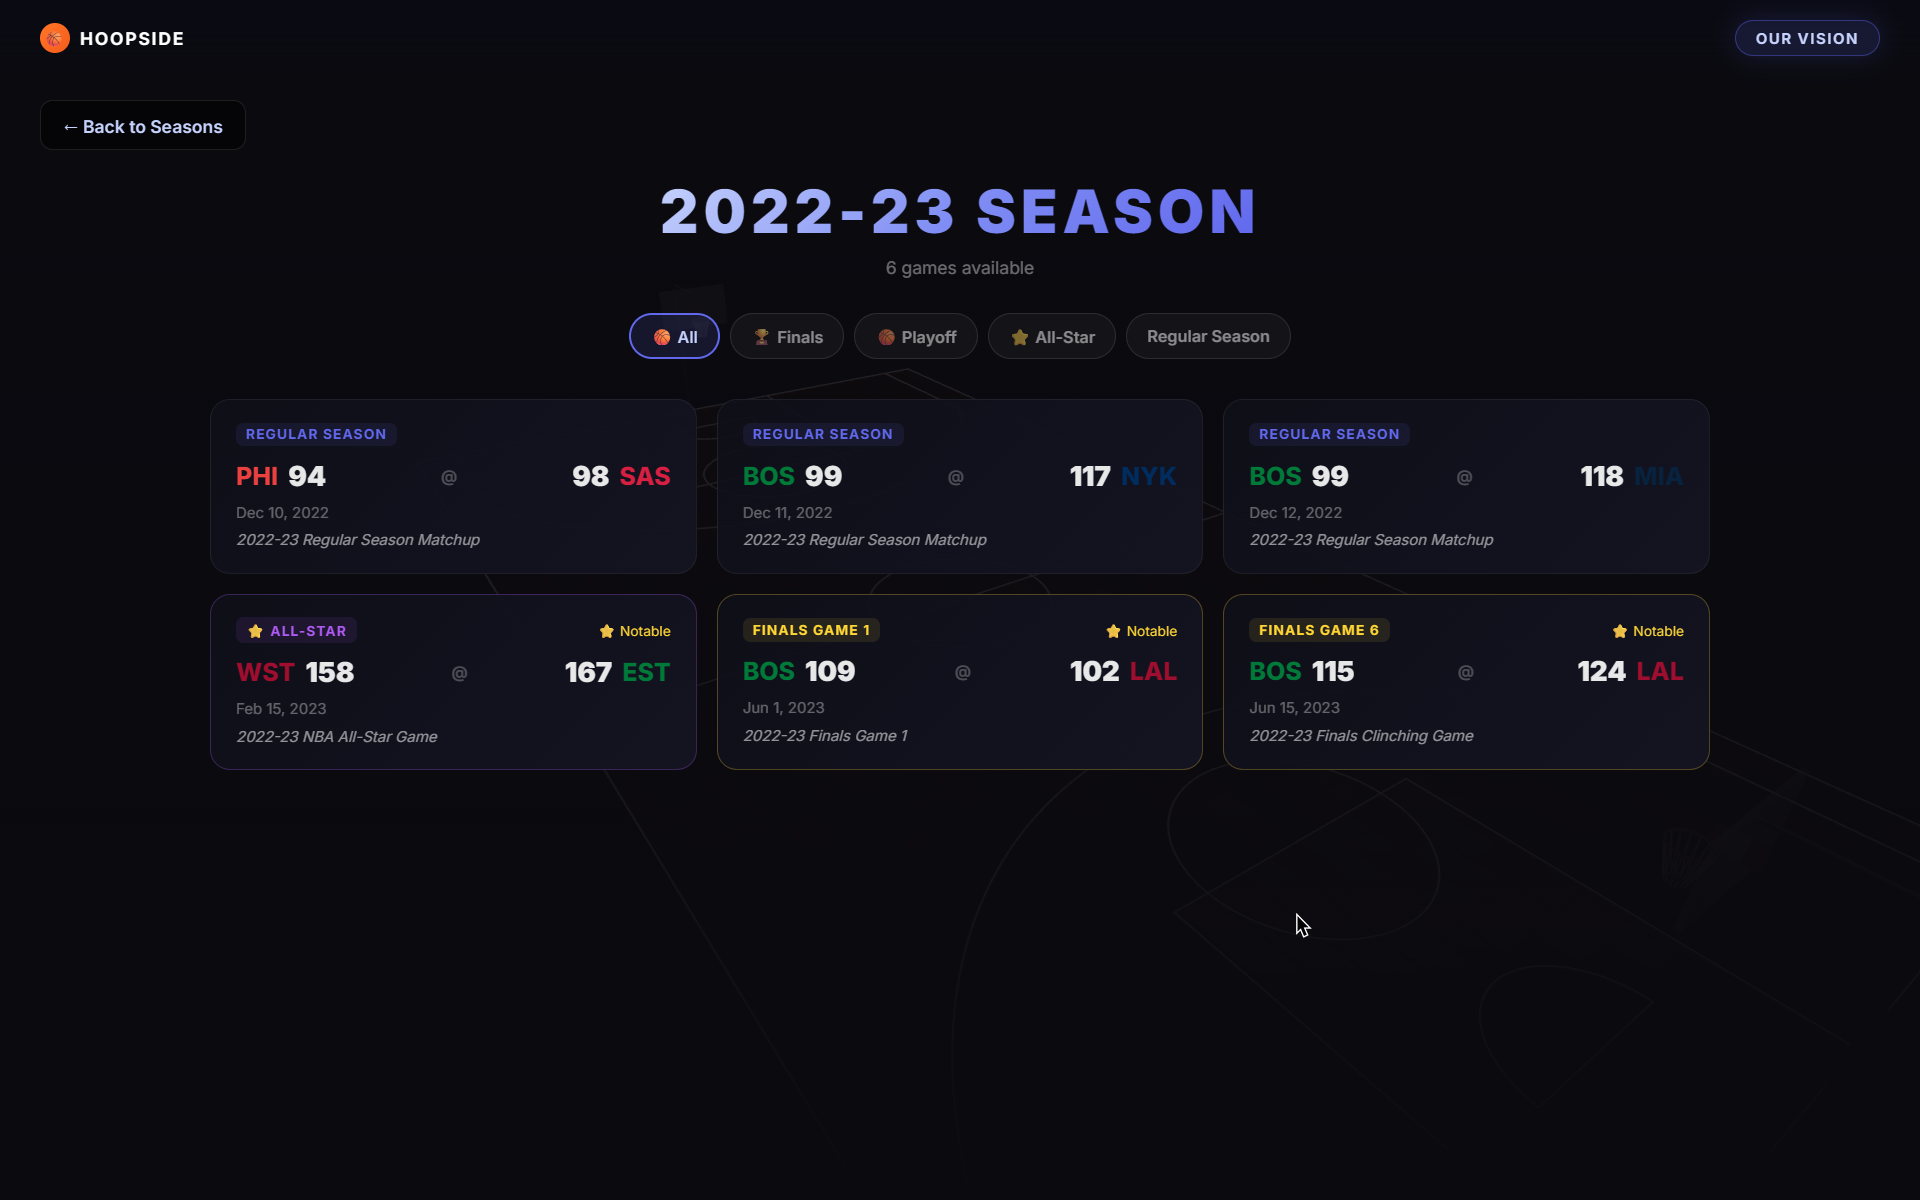
Game Selection — Browse historical games and choose a matchup to explore in 3D
-
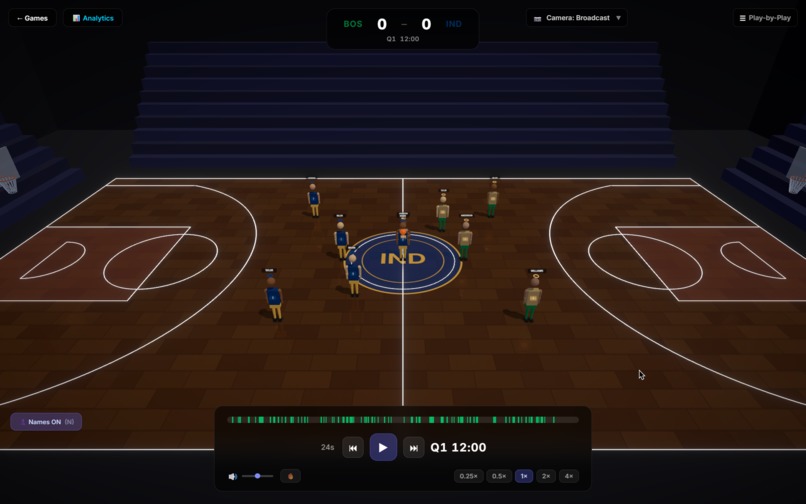
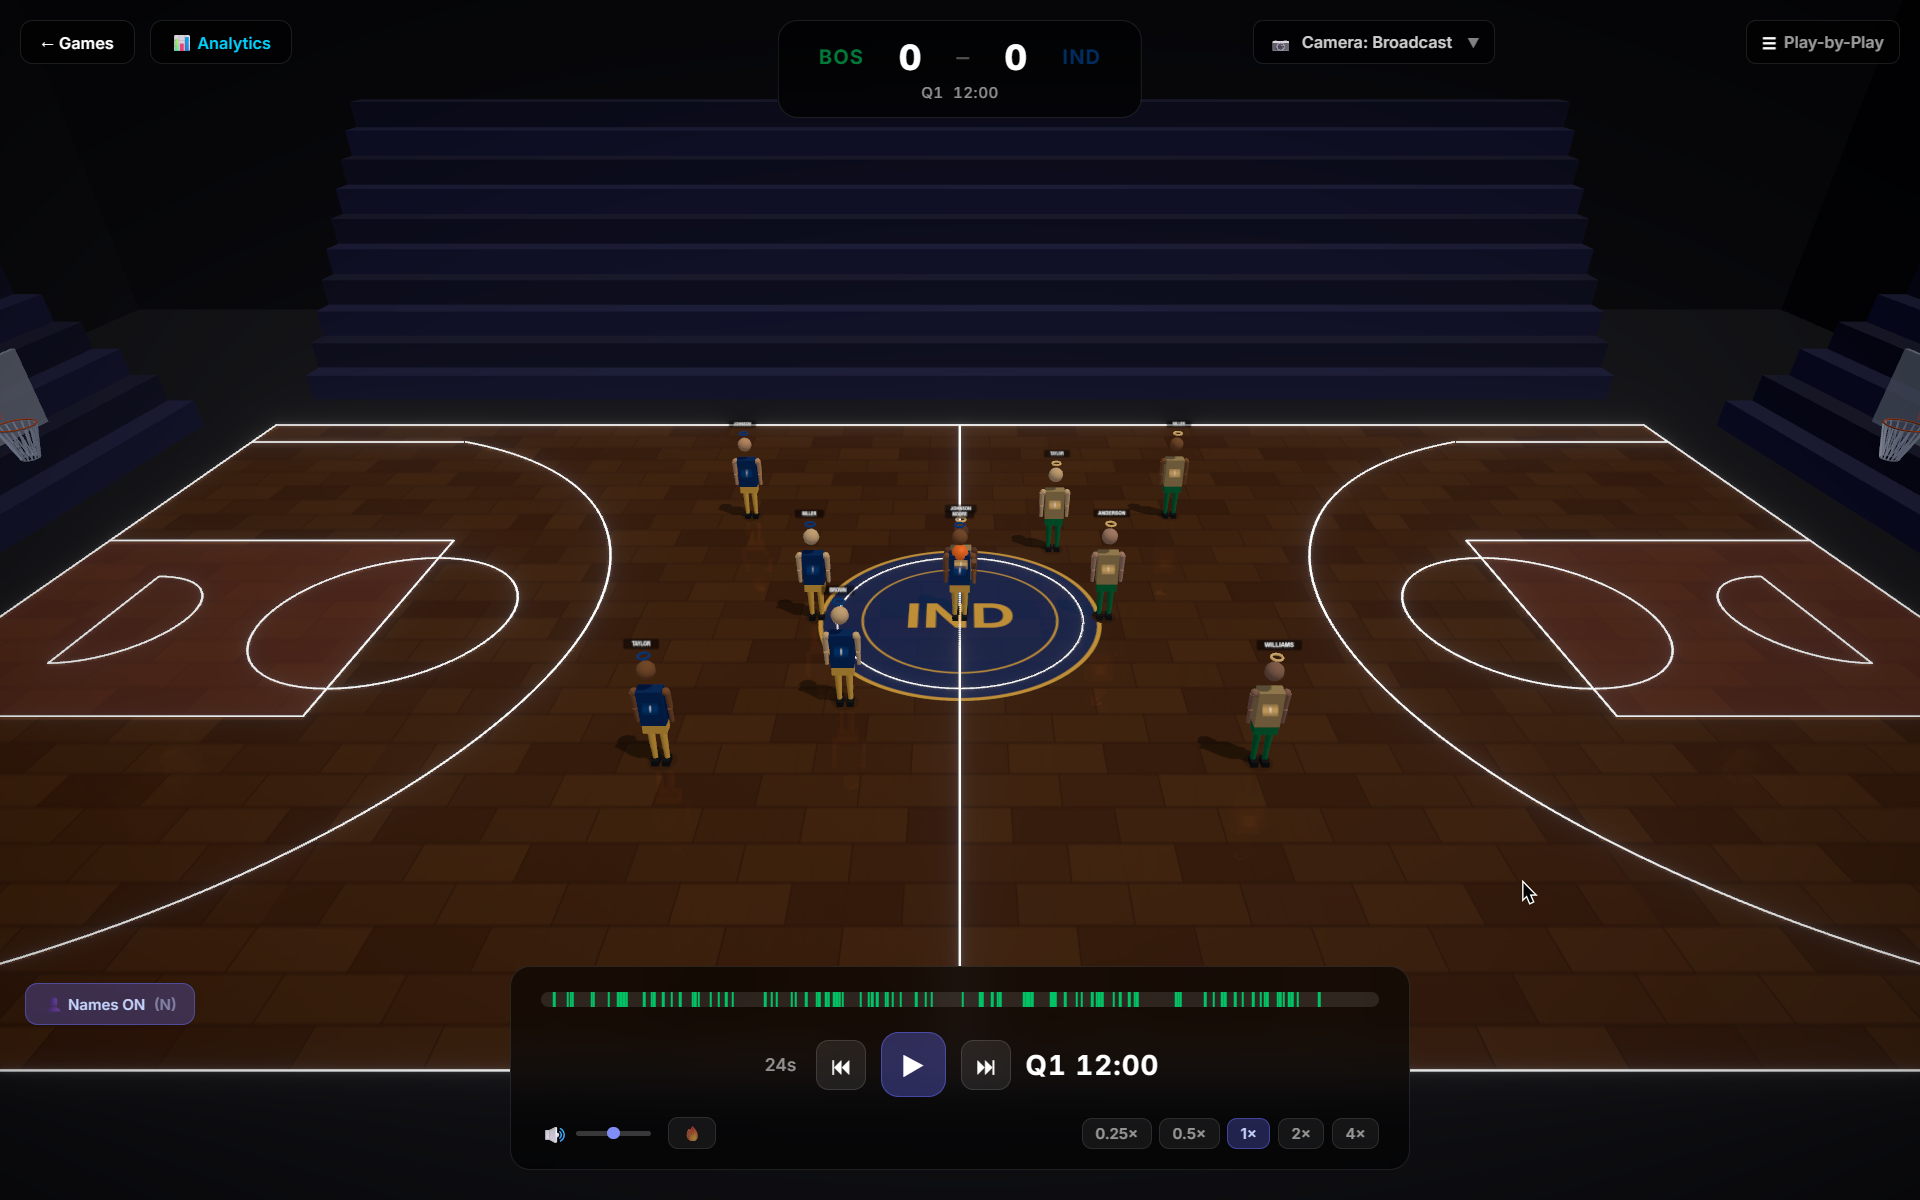
Visualizer — Replay real games in 3D using historical tracking data and player movement.
-
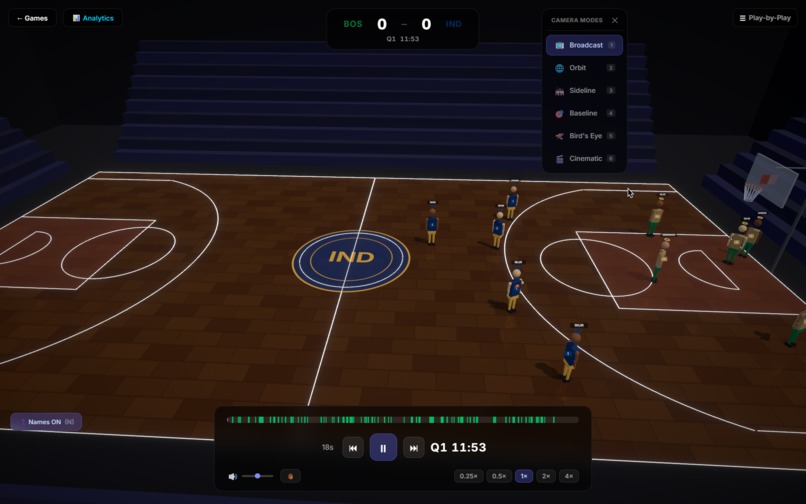
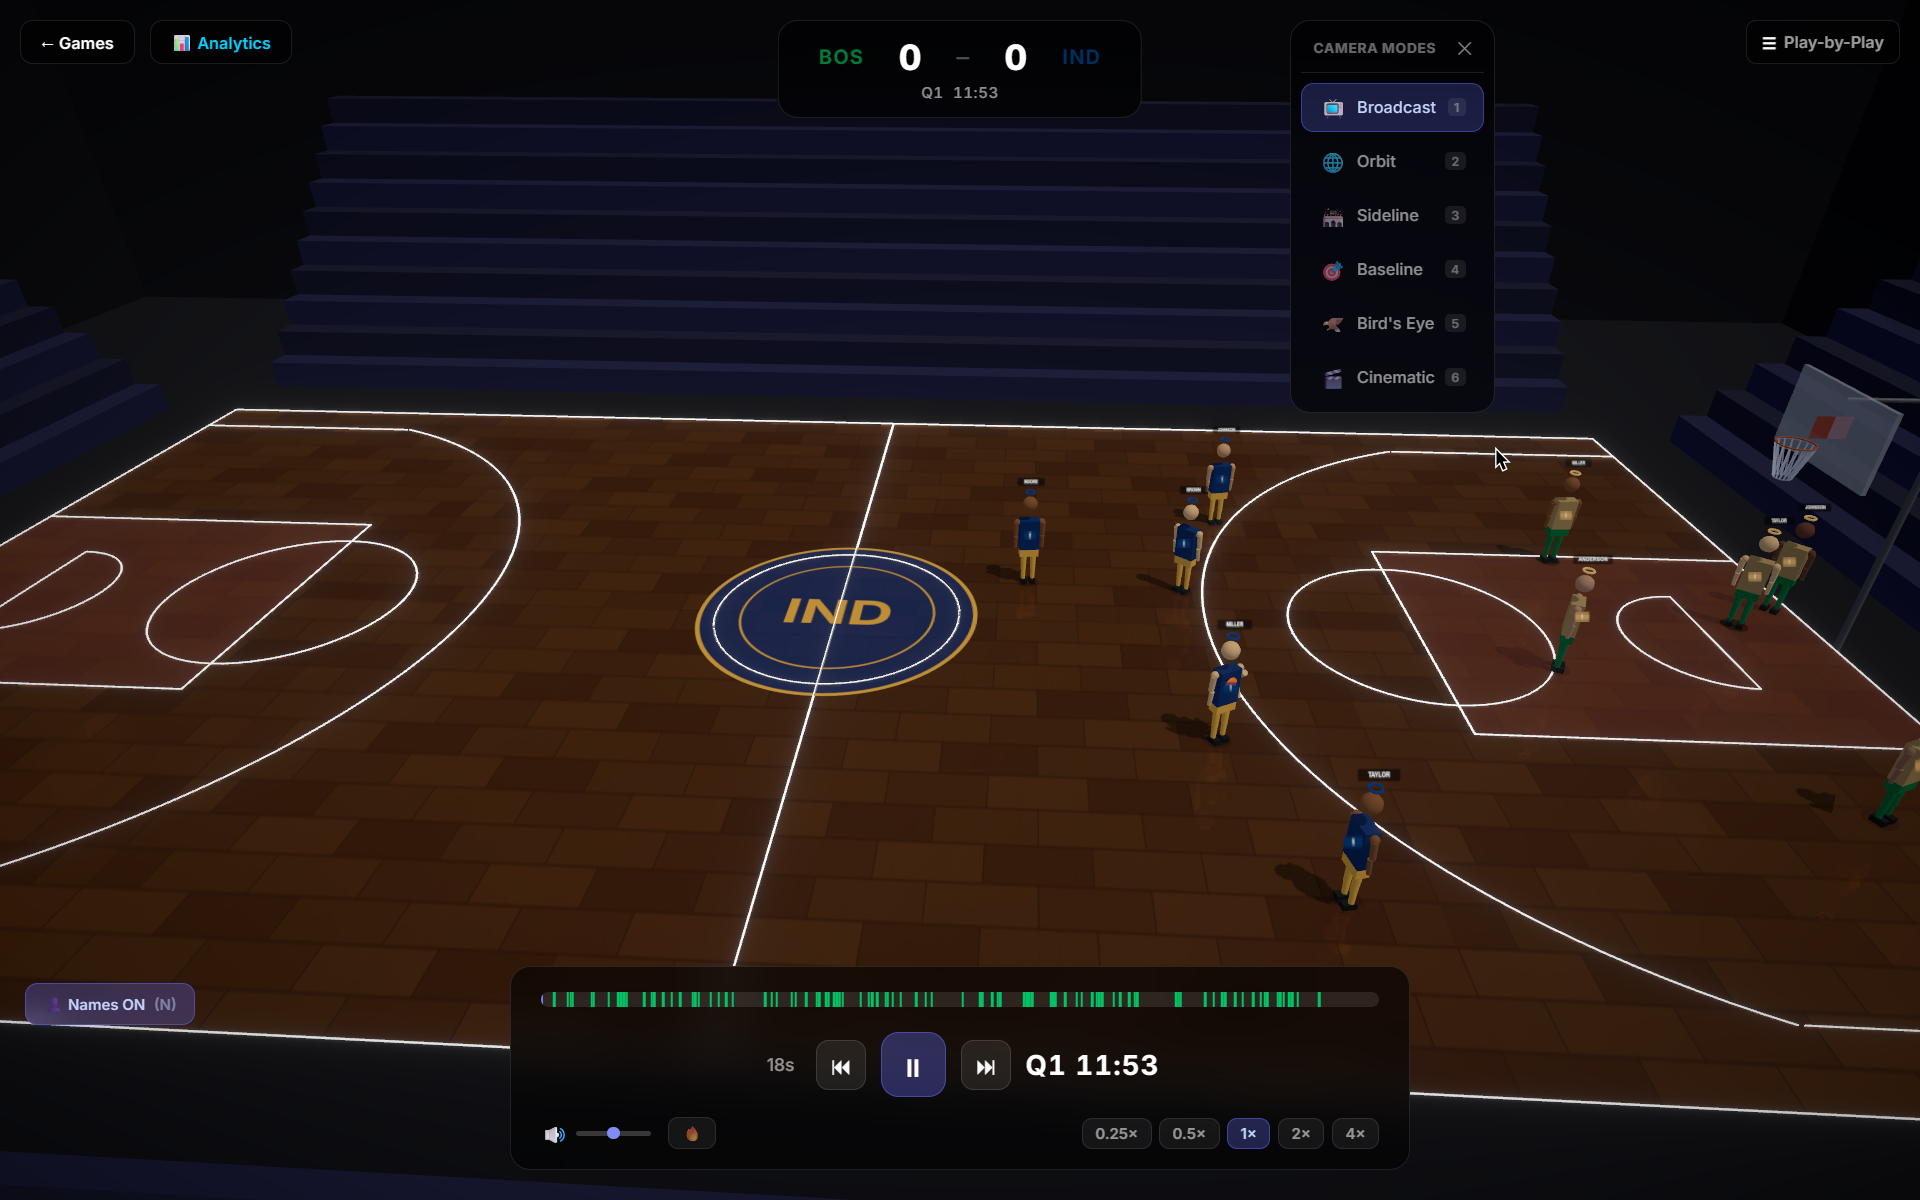
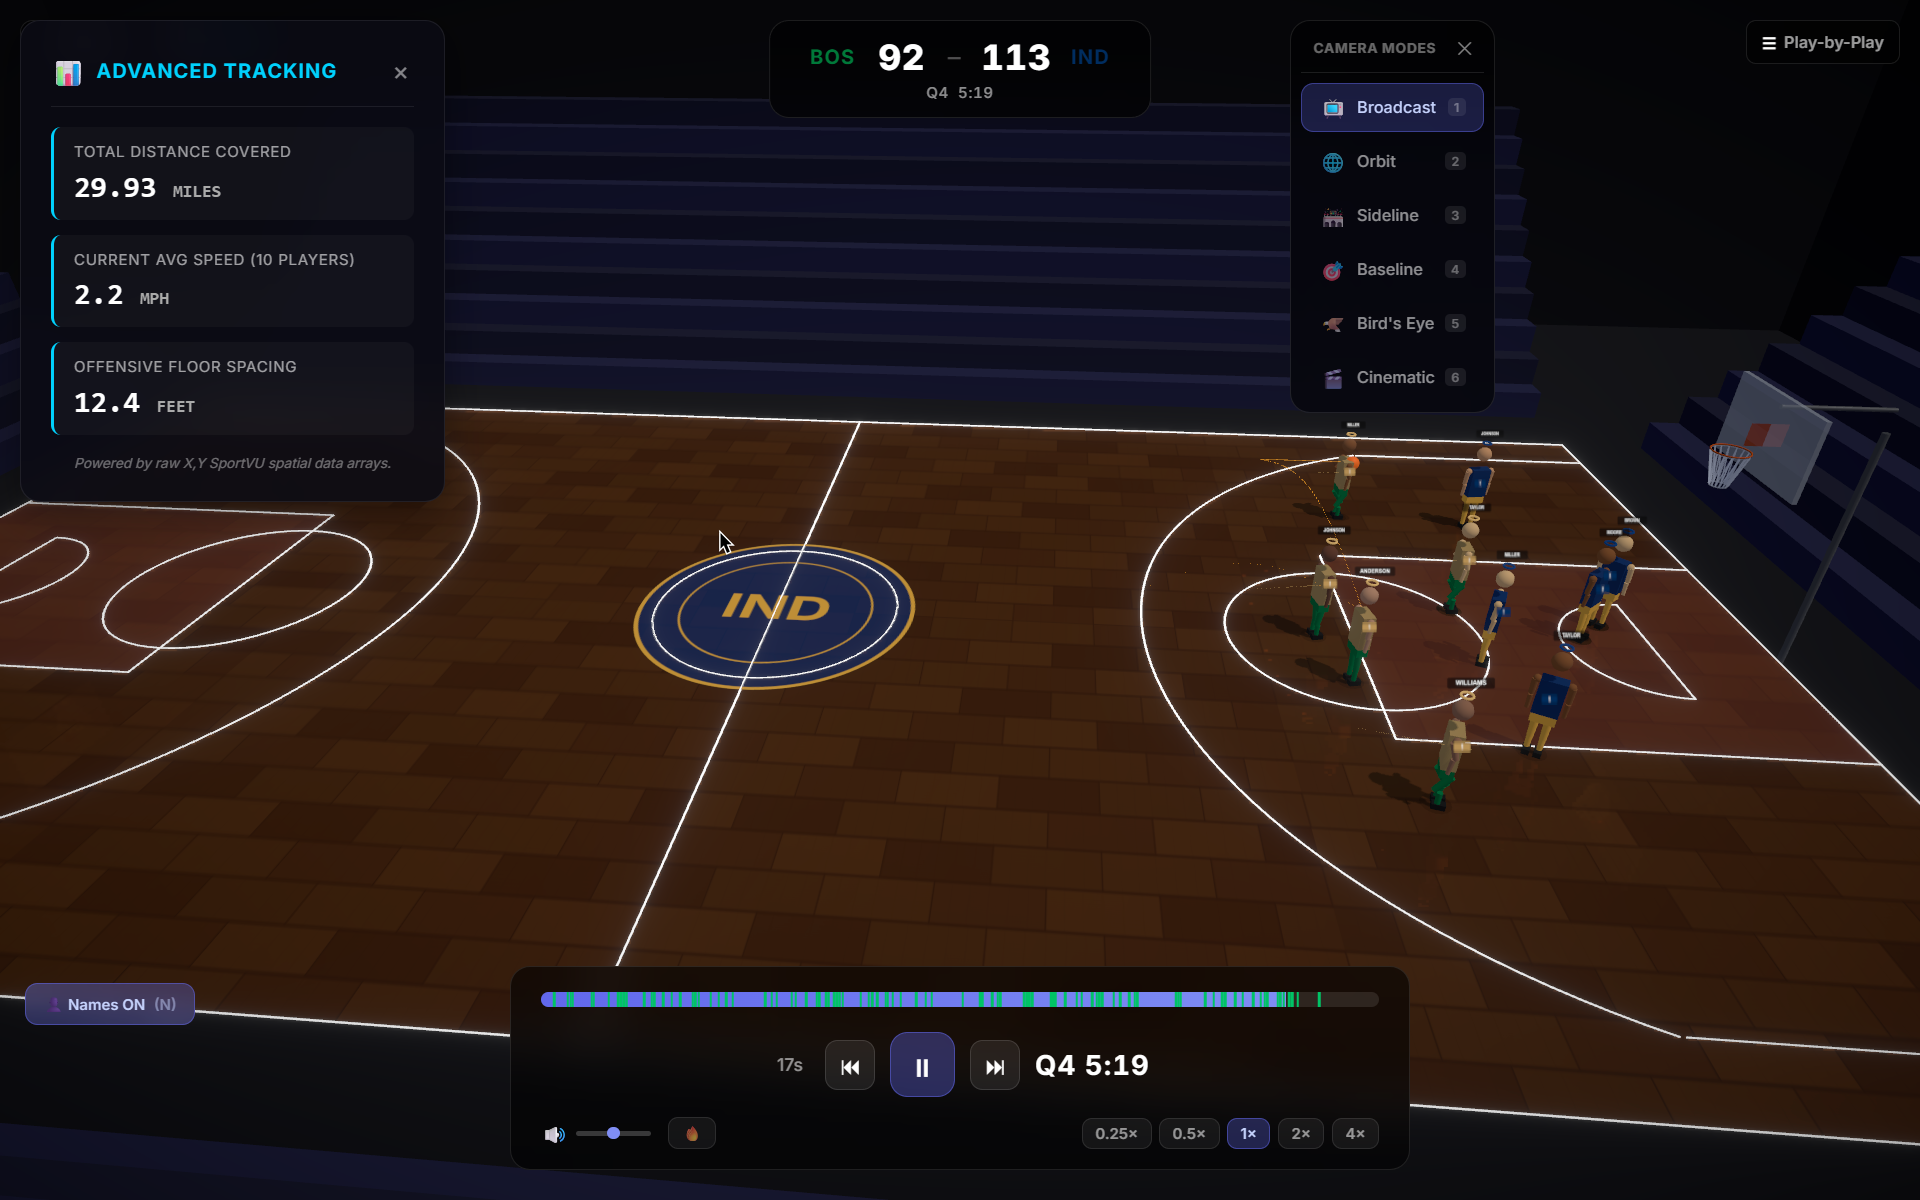
Camera Angles Available — Switch perspectives to study positioning, movement, spacing, and plays.
-
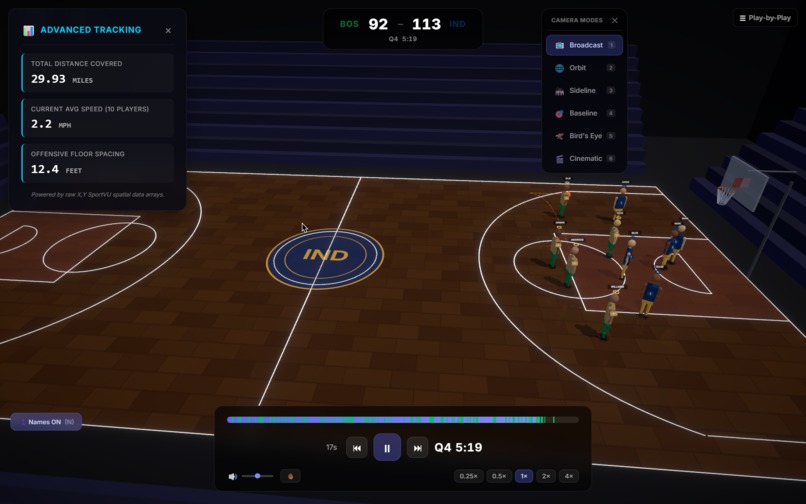
Analytics — Explore player movement, game events, and statistics to understand each possession
-
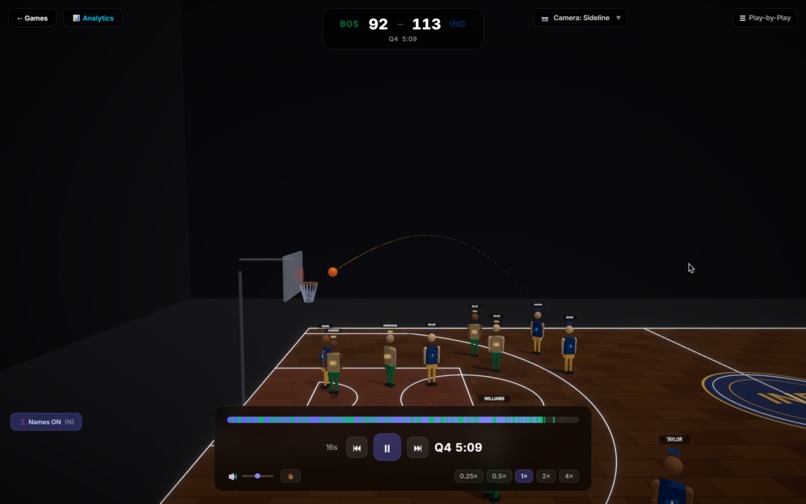
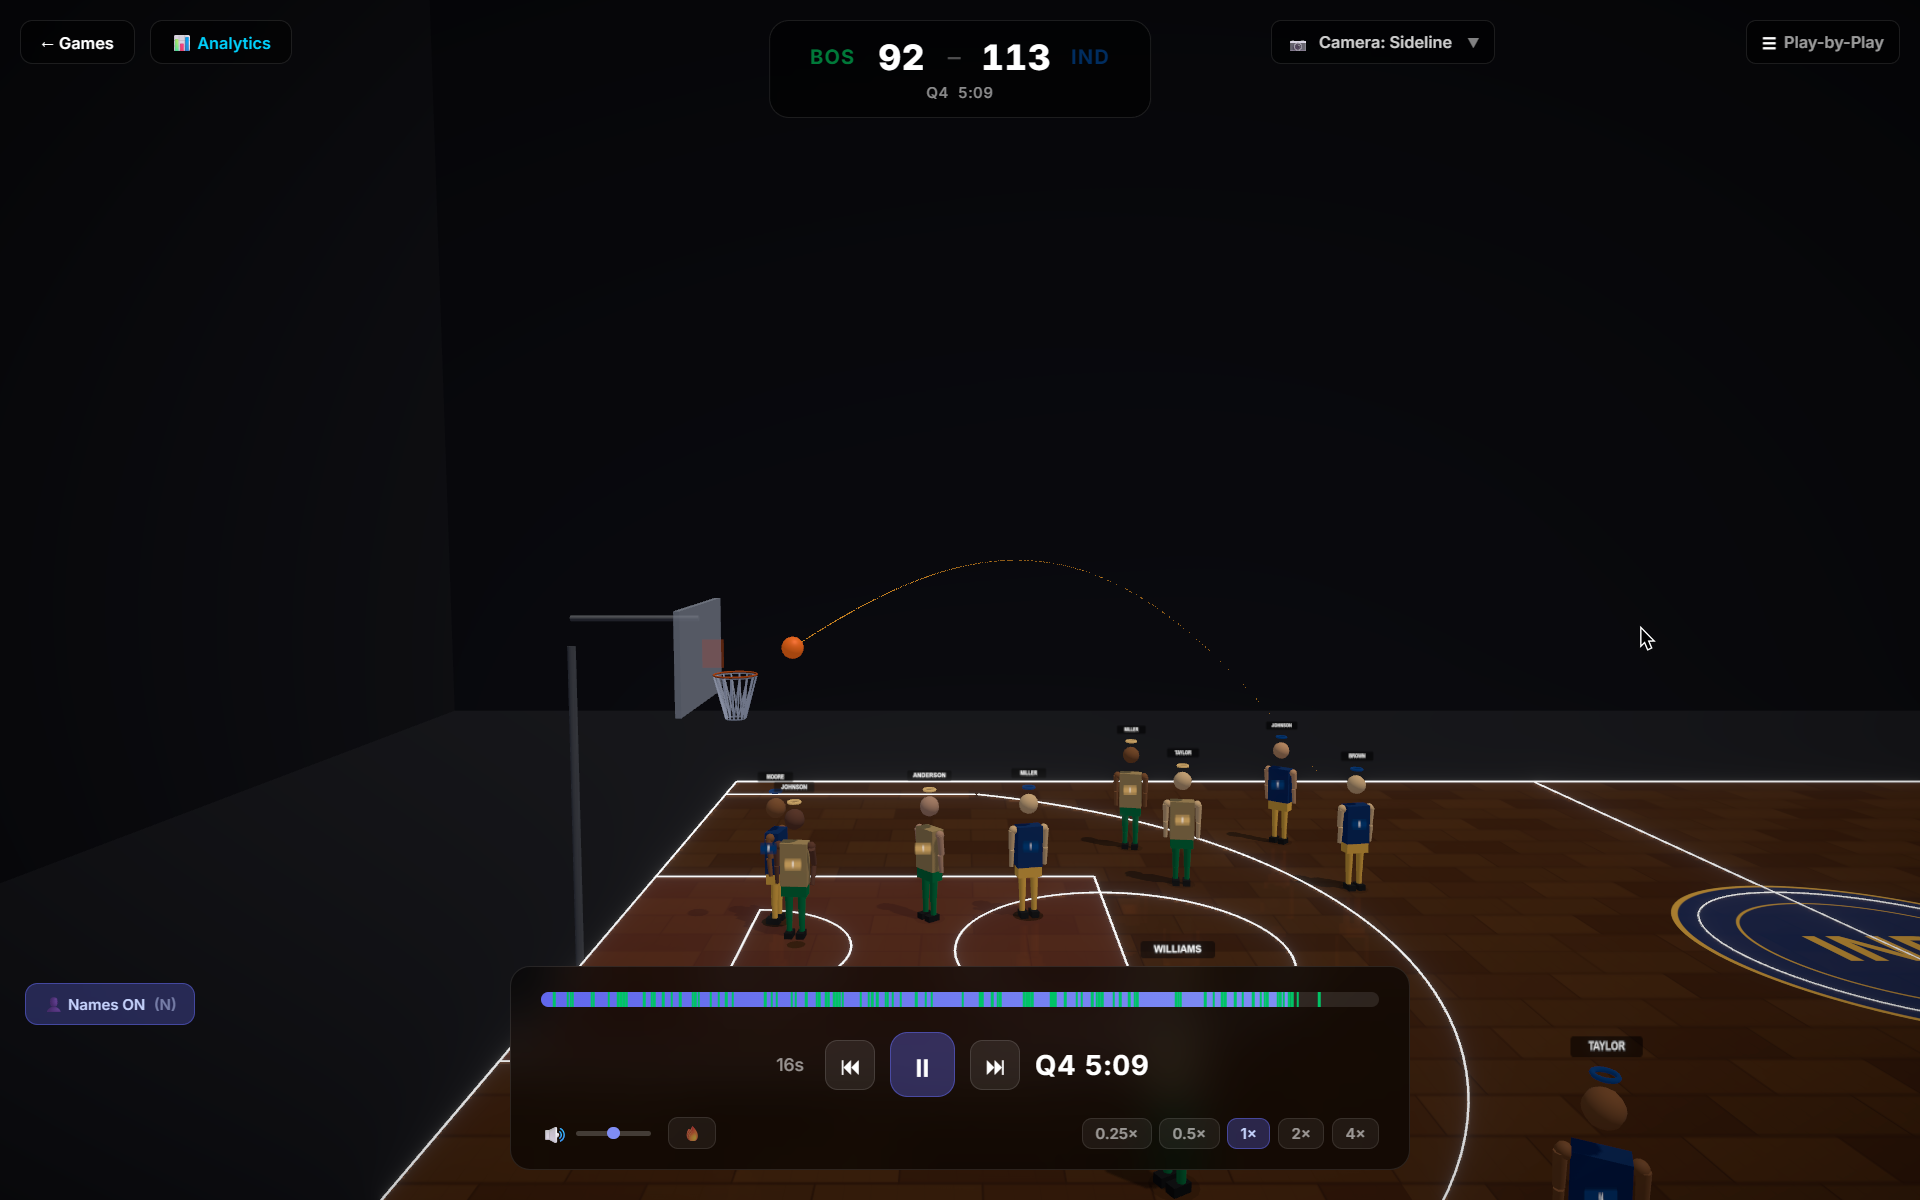
Sideline CameraView — Follow player movement from a sideline perspective in the interactive 3D court. 90
-
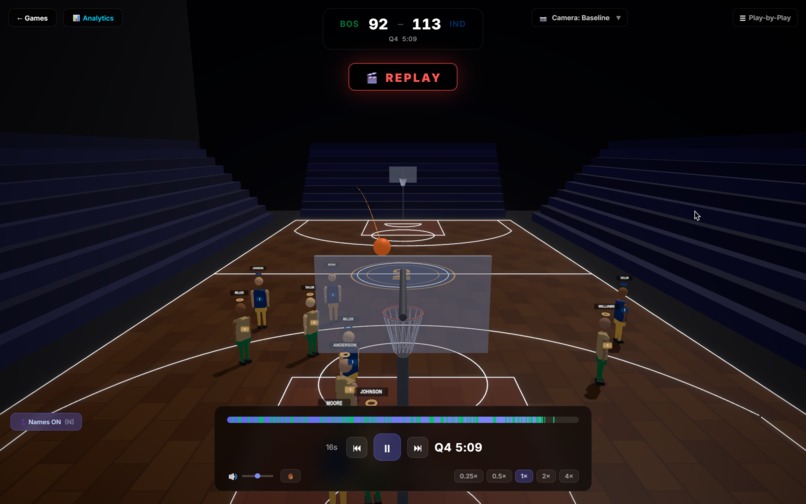
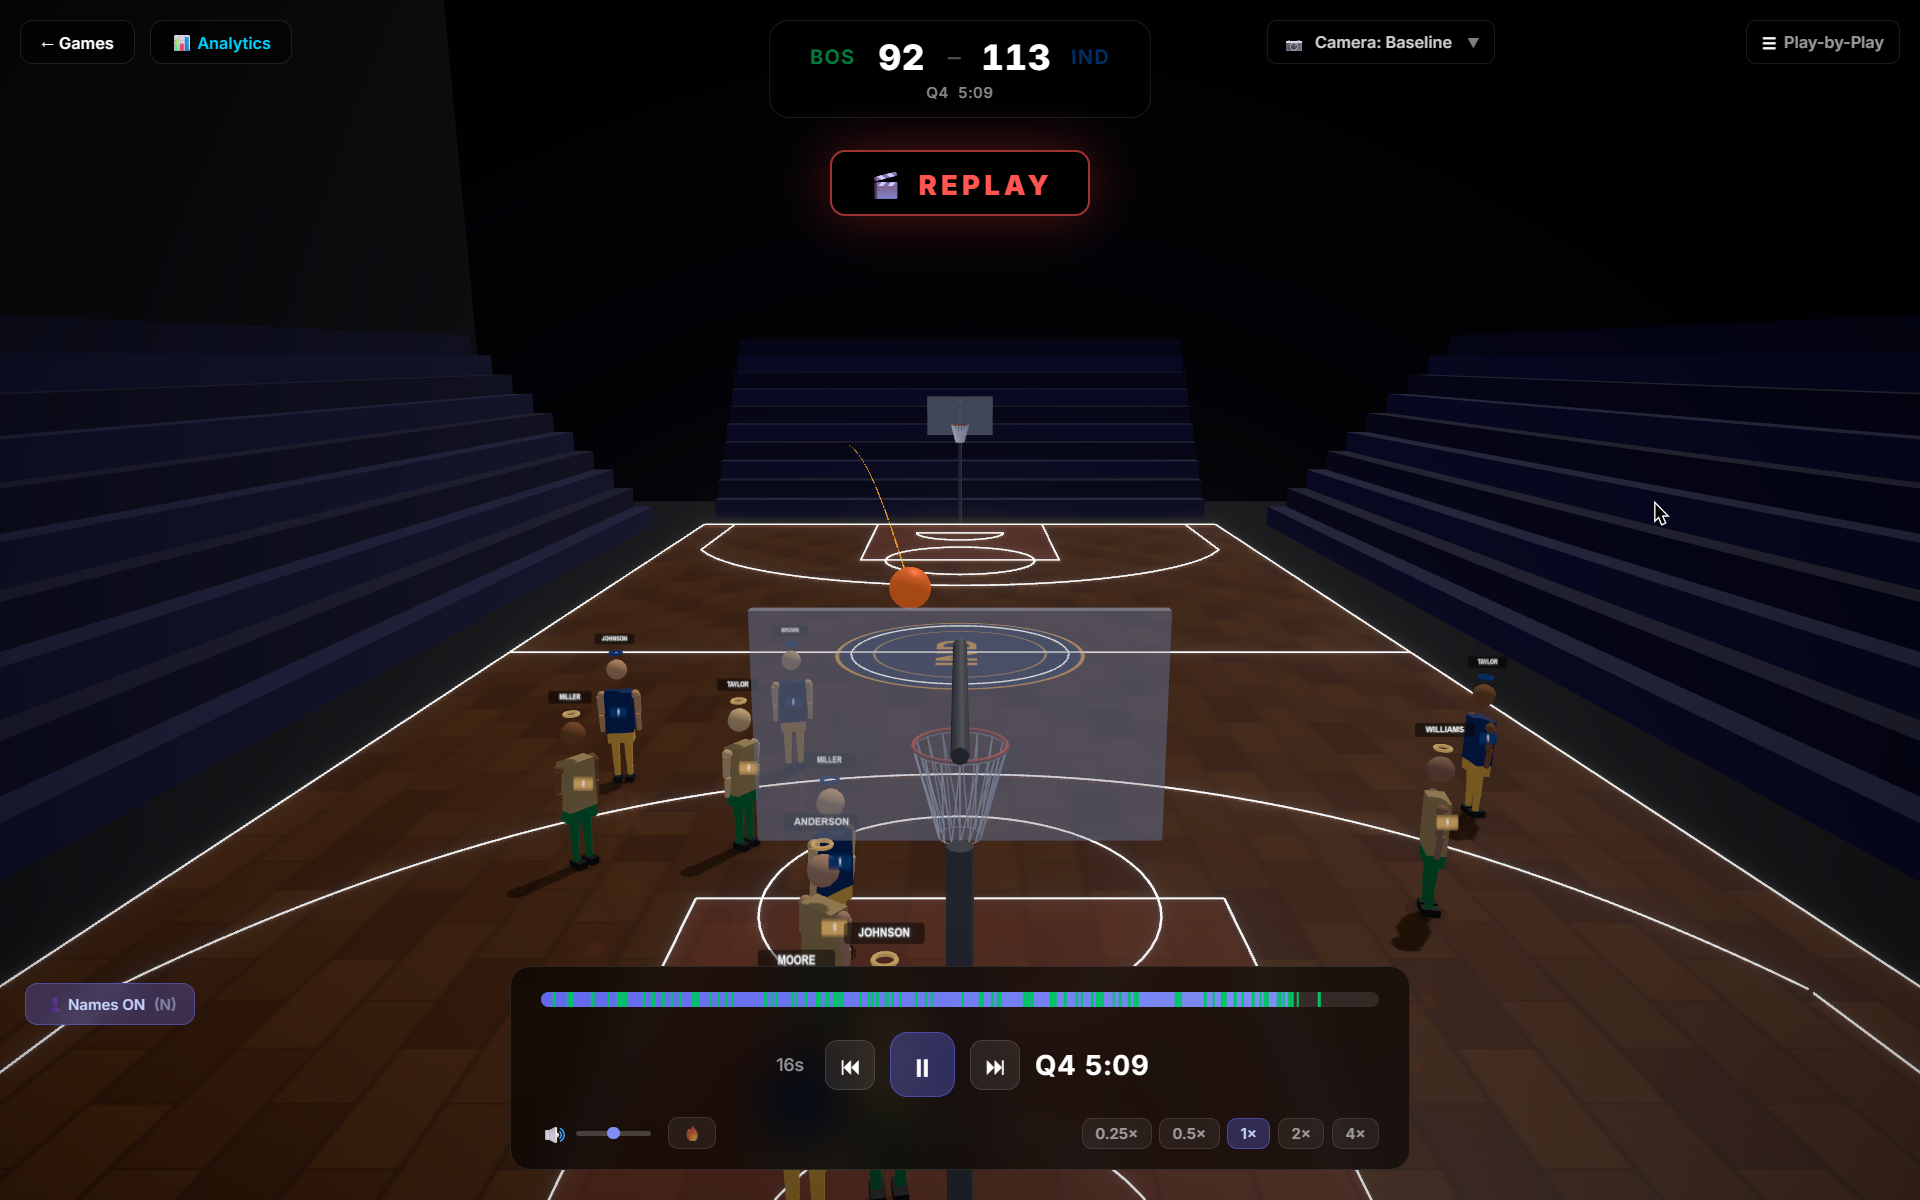
Baseline CameaView — Examine spacing, positioning, and movement from behind the basket
-
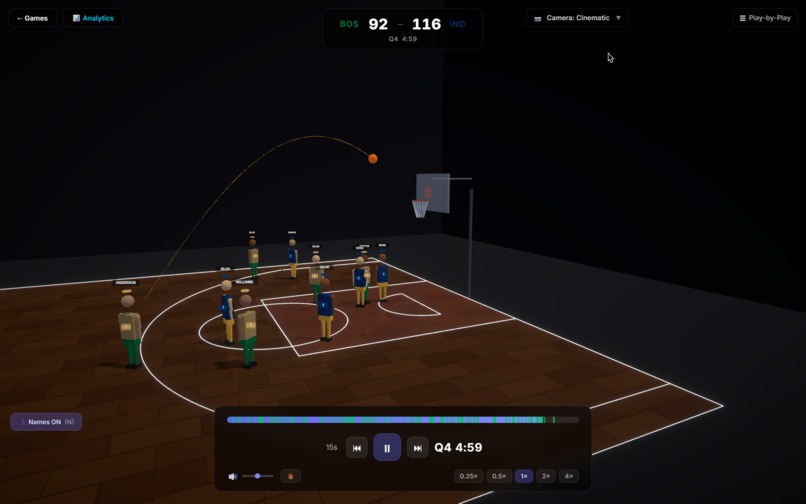
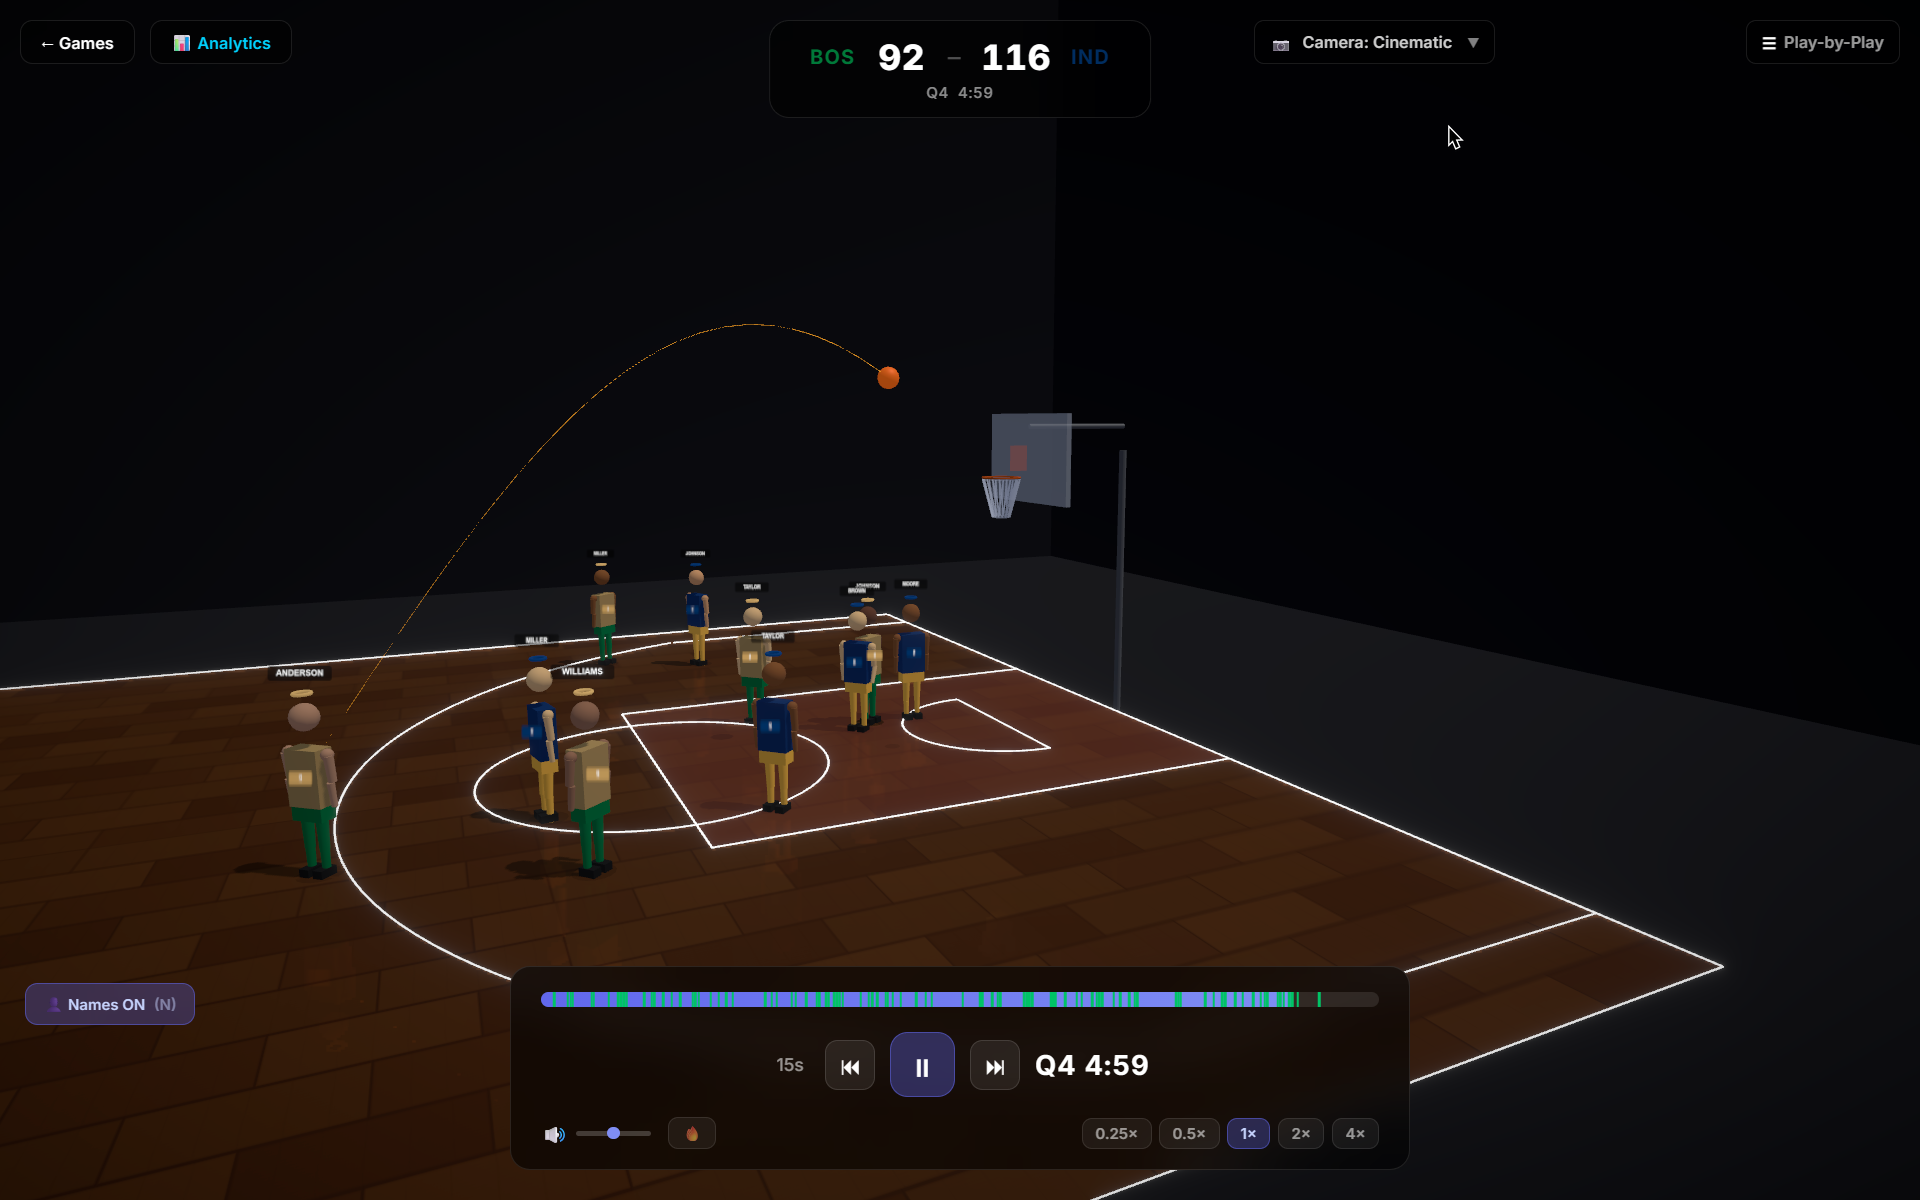
Cinematic CameraView — Experience historical plays through an immersive cinematic view.

About the Project
Inspiration
Basketball generates an enormous amount of data, but most of it is reduced to box scores, charts, and numbers. We wanted to make that data feel tangible. Hoopside was inspired by the idea of experiencing basketball history through the data that was recorded on the court—not just reading about what happened, but actually seeing it unfold.
What it does
Hoopside is an interactive 3D basketball visualization platform built around historical tracking data. Users can explore games, replay possessions frame-by-frame, visualize player movement and positioning, follow play-by-play events, and connect spatial tracking data with traditional statistics.
How we built it
We built Hoopside as a modern web application using Next.js, React, TypeScript, and Three.js. Historical basketball tracking data is processed and converted into spatial coordinates that can be rendered as player movement on a 3D basketball court. The application combines this visualization with game metadata, play-by-play information, box scores, and historical context to create an interactive experience.
Challenges we ran into
One of the biggest challenges was turning large amounts of raw tracking data into smooth, synchronized 3D animations. We also had to handle different game events, player states, coordinate transformations, and performance limitations while keeping the interface responsive and intuitive.
Accomplishments that we're proud of
We are proud of turning raw basketball tracking data into something visual and interactive. Instead of forcing users to interpret thousands of data points, Hoopside allows them to explore the data spatially and understand how players moved and interacted during real games.
What we learned
We learned that effective sports analytics is not only about collecting accurate data—it is also about how that data is presented. Visualization can reveal relationships and patterns that are difficult to understand from statistics alone. We also gained experience working with large datasets, 3D rendering, animation, and building performant interactive web applications.
What's Next for Hoopside
We want to expand Hoopside with deeper analytical tools, more historical games and datasets, advanced player and team comparisons, possession-level insights, and additional ways to discover patterns hidden within basketball tracking data.
Ultimately, we want Hoopside to become a platform where anyone can explore, visualize, and understand basketball through data.
Built With
- basketball
- css
- next.js
- react
- tailwind
- three.js
- tracking
- typescript
