-
-
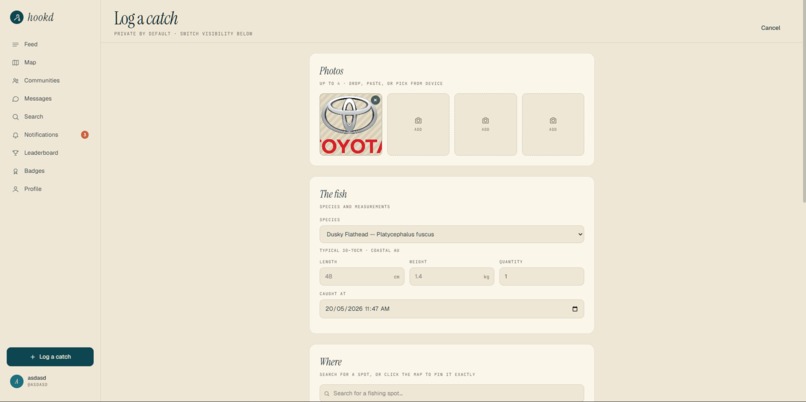
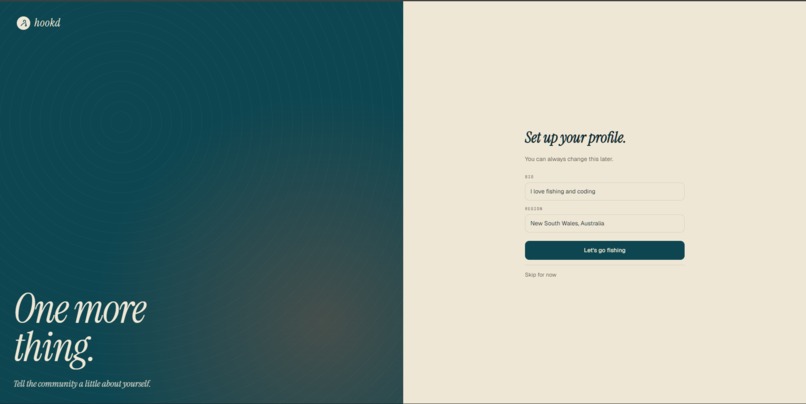
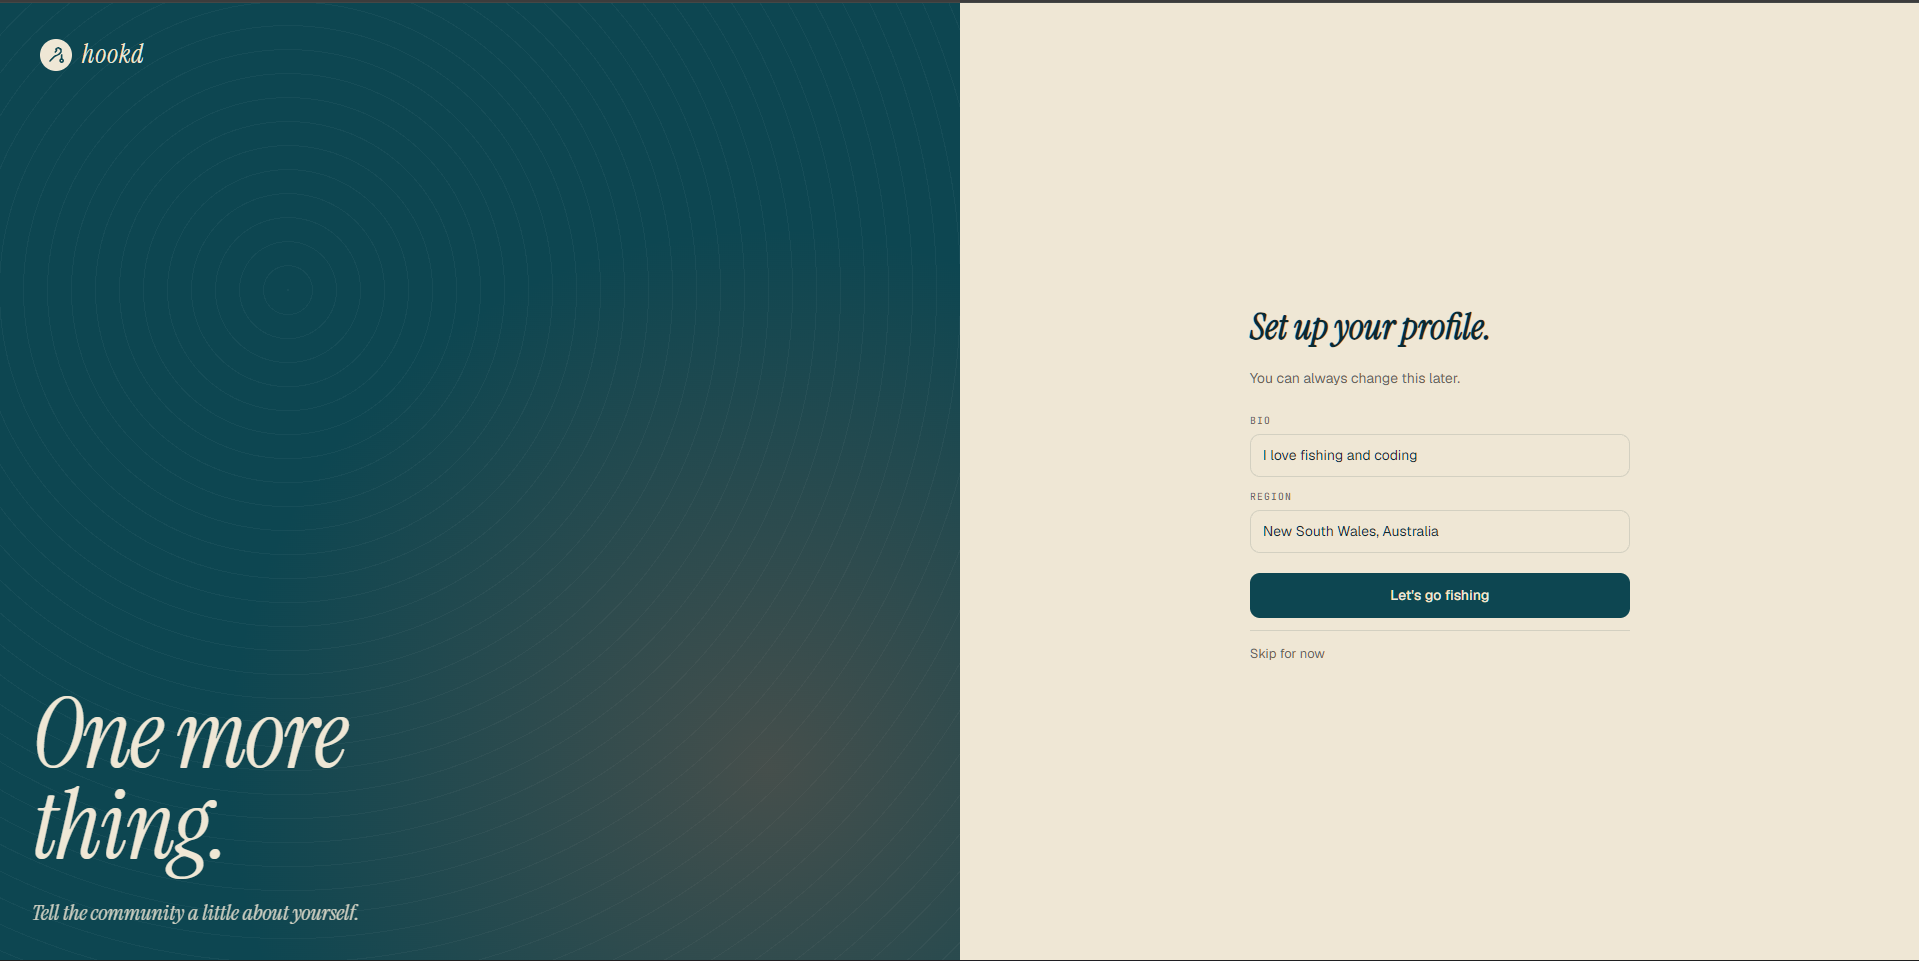
Logging a catch pt 1, setting image weight lenght etc
-
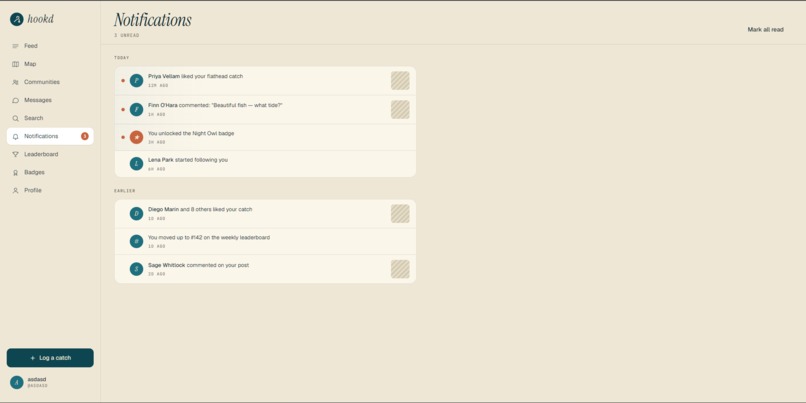
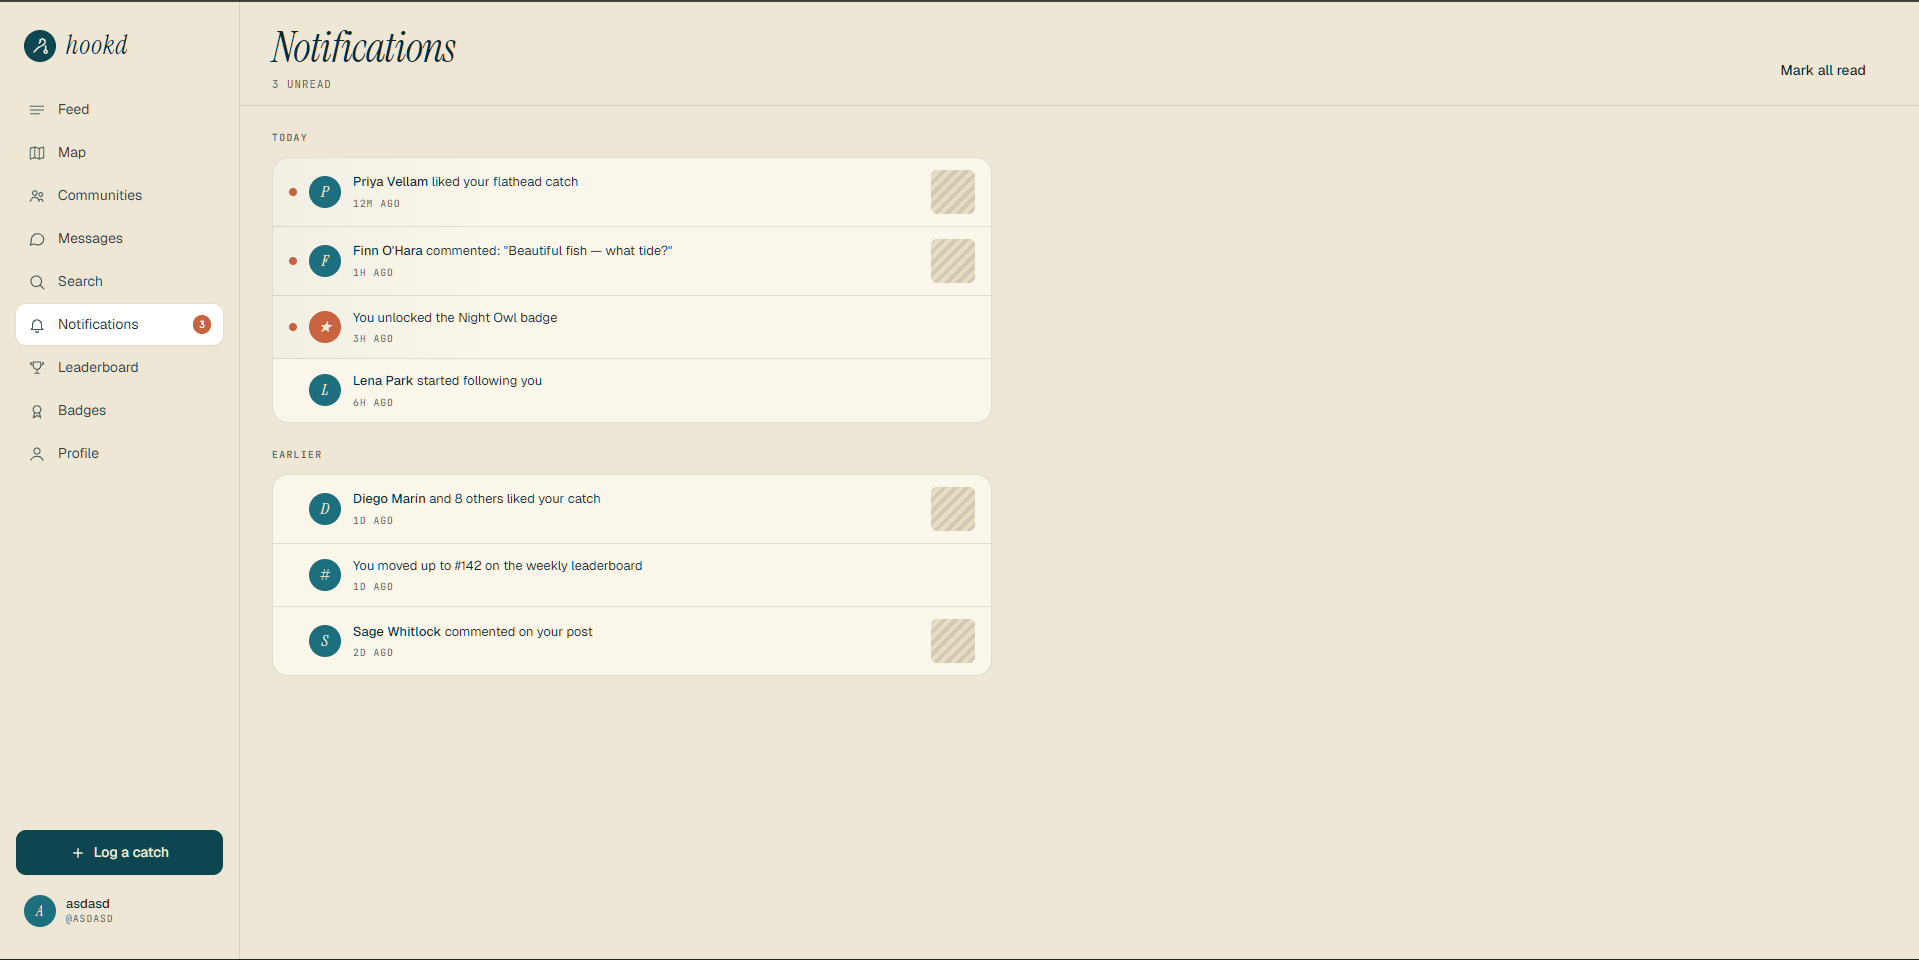
notification tab
-

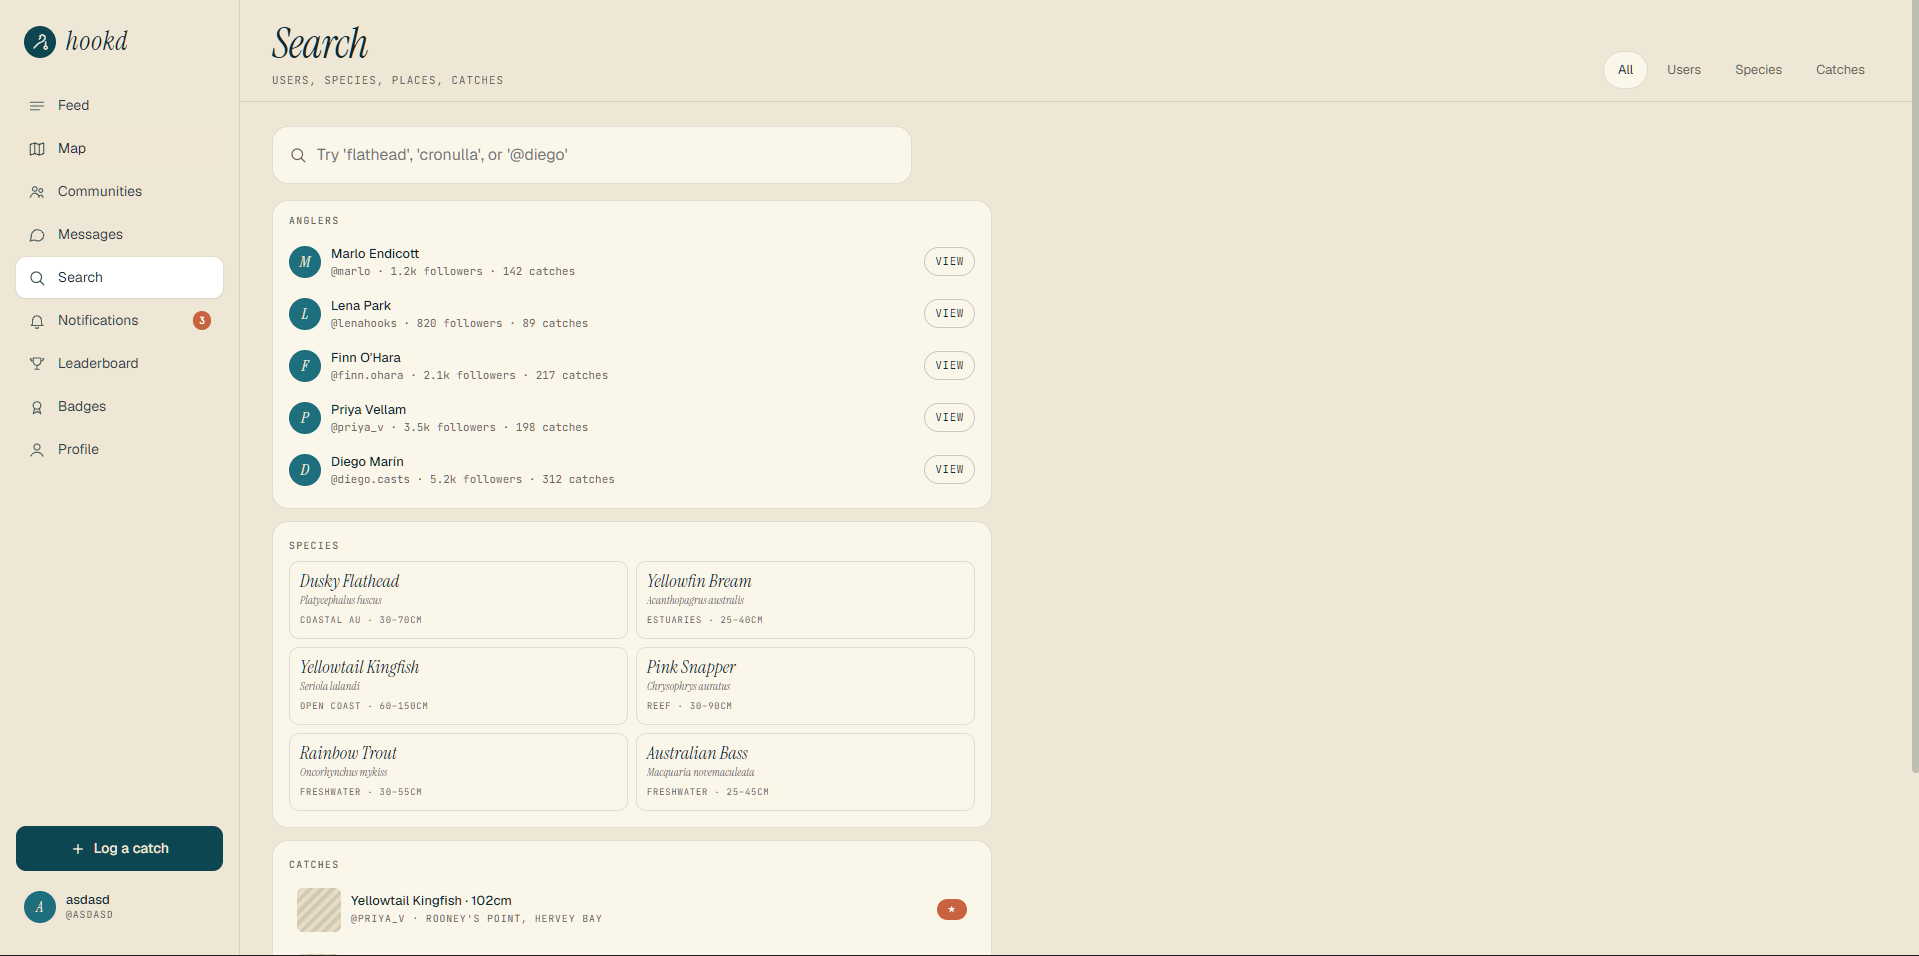
search for other users, common fish species and location
-
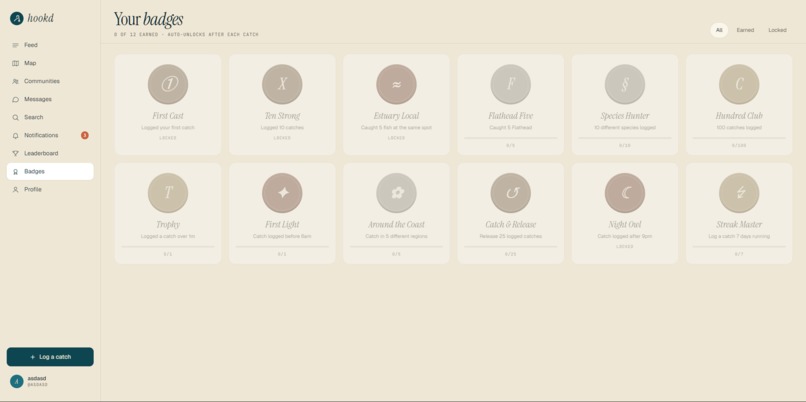
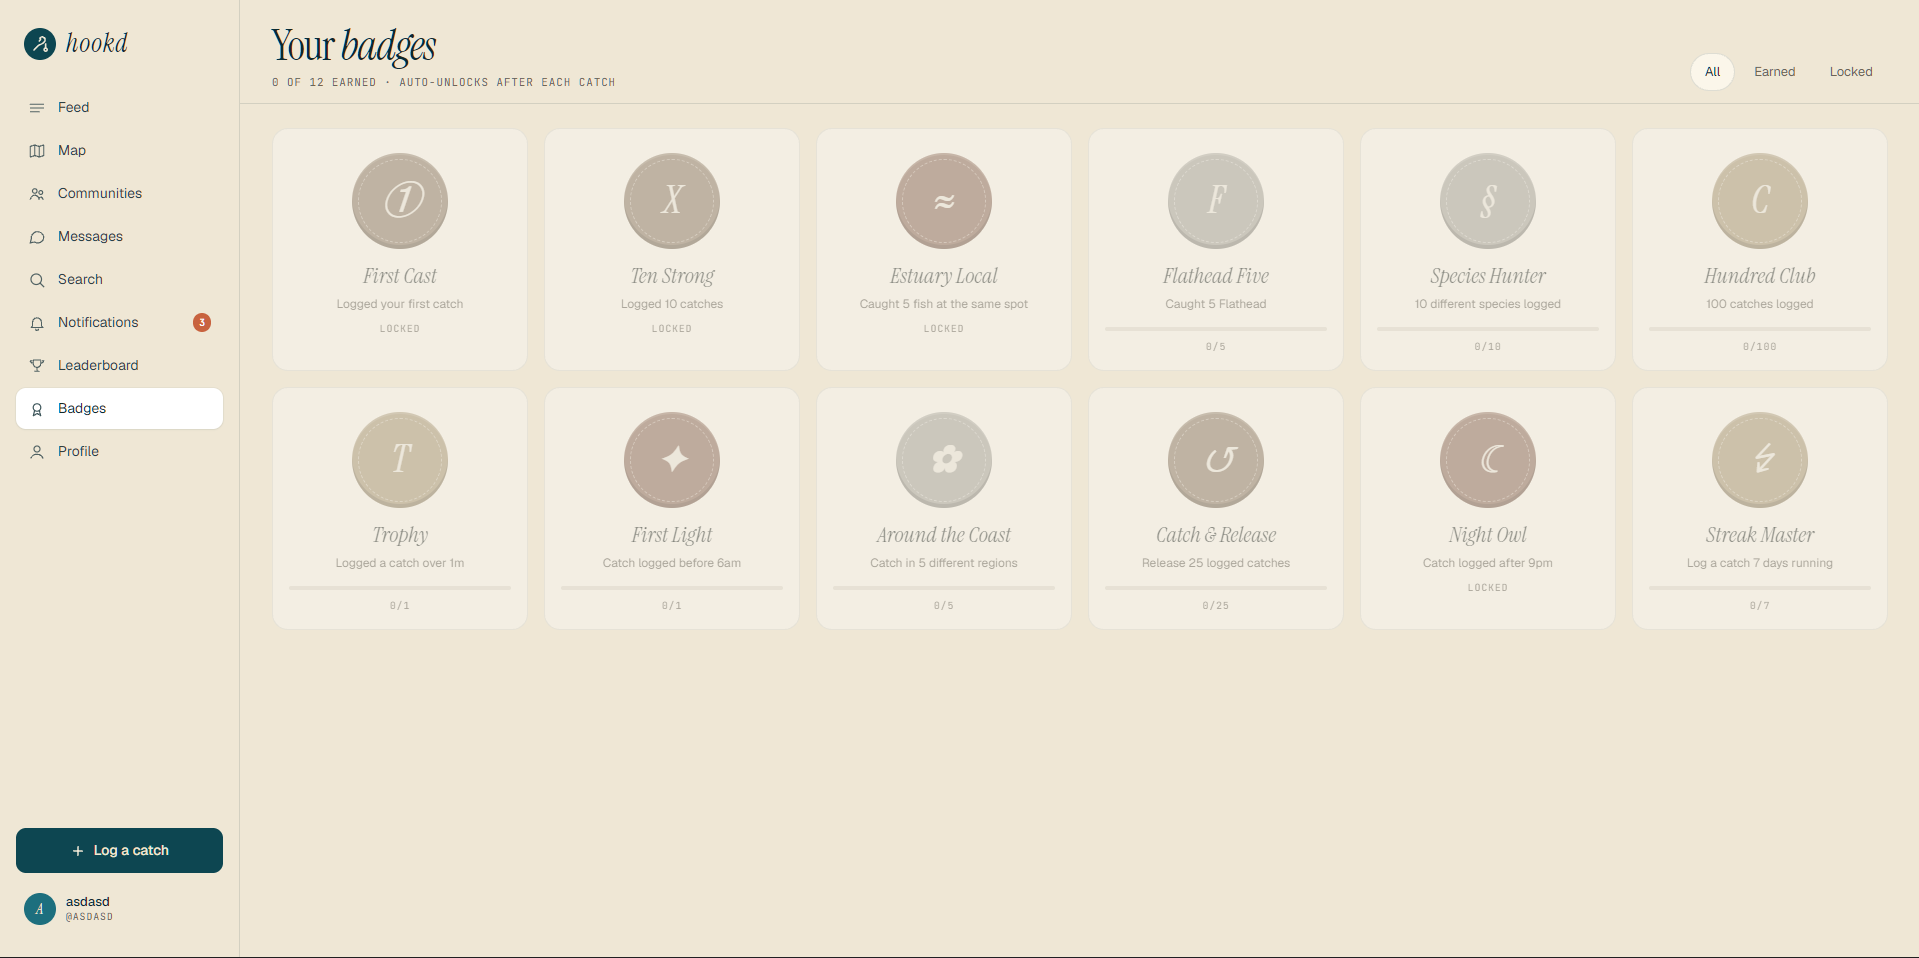
Badges for the waterway
-

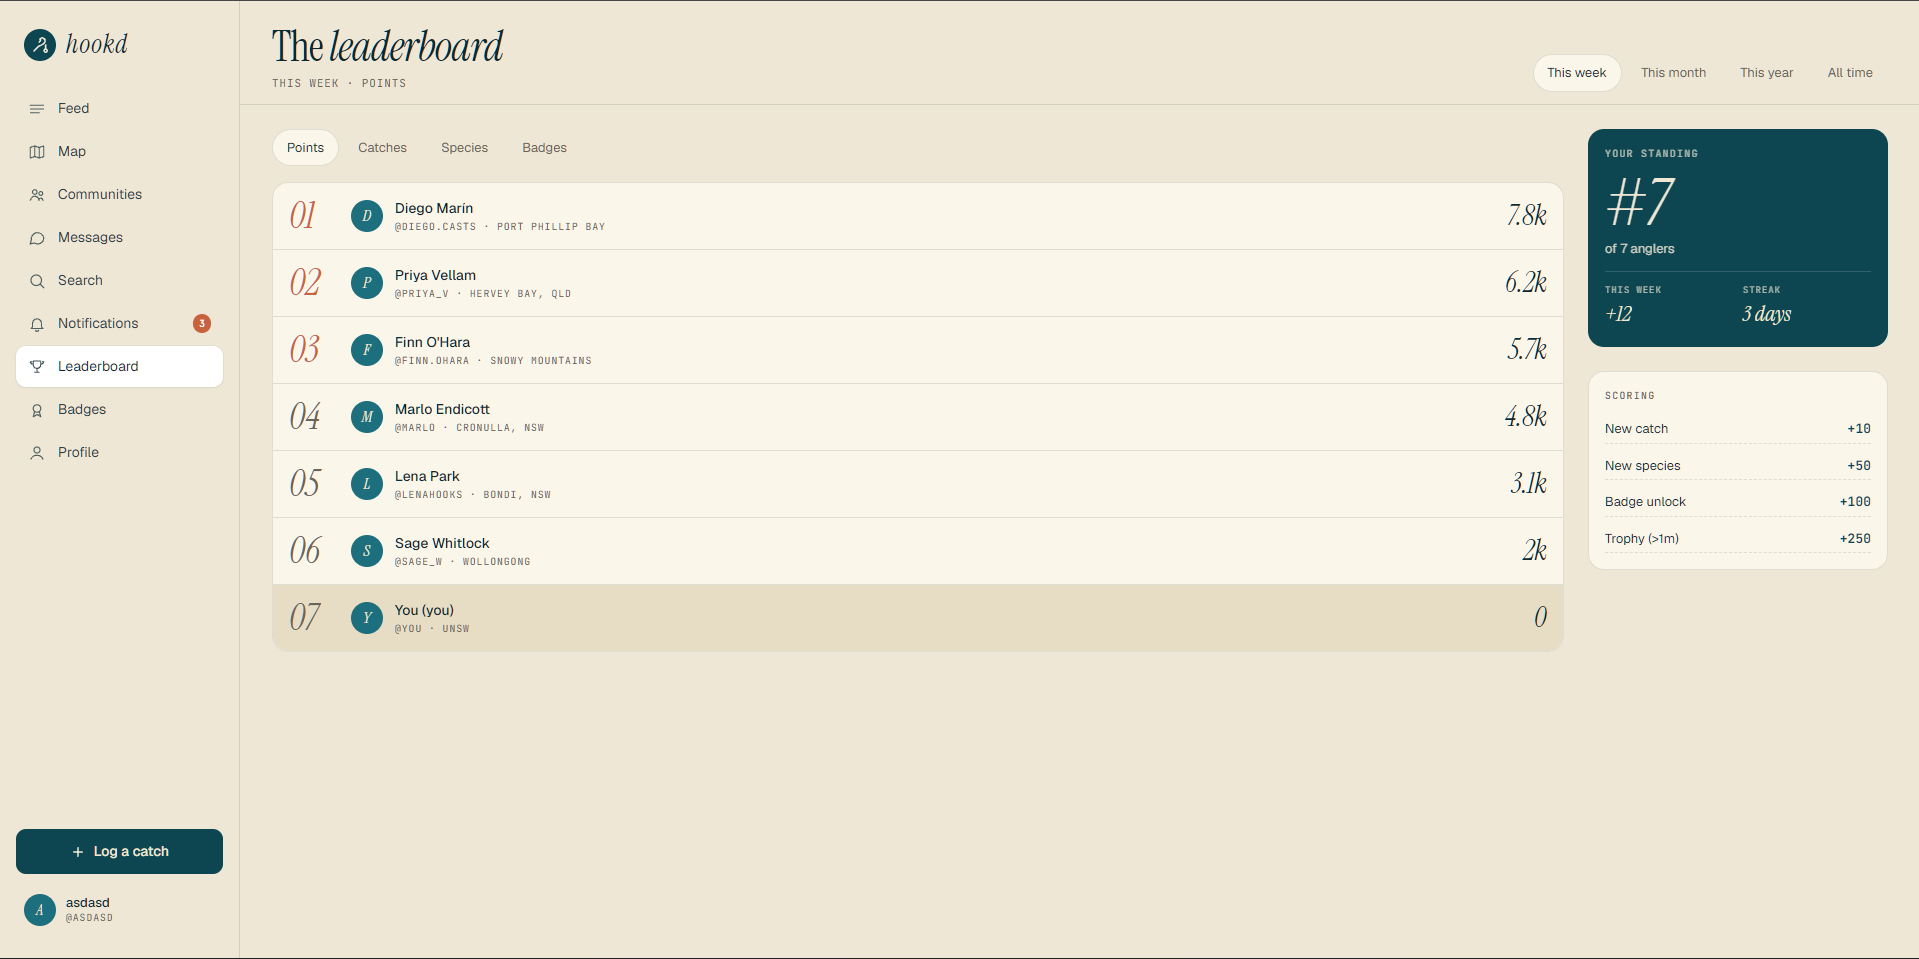
Leaderboard
-
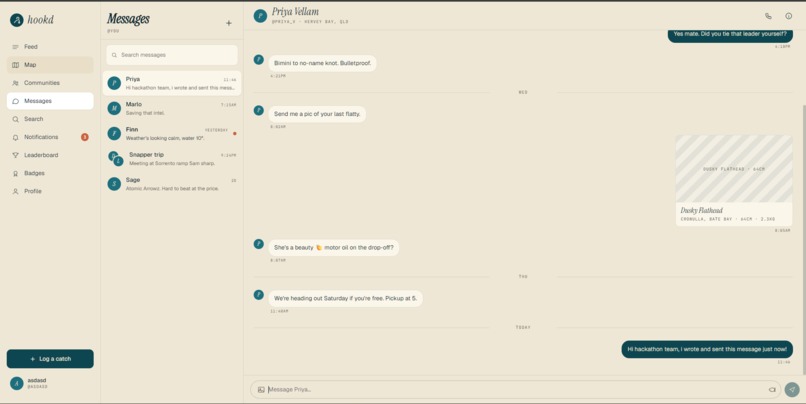
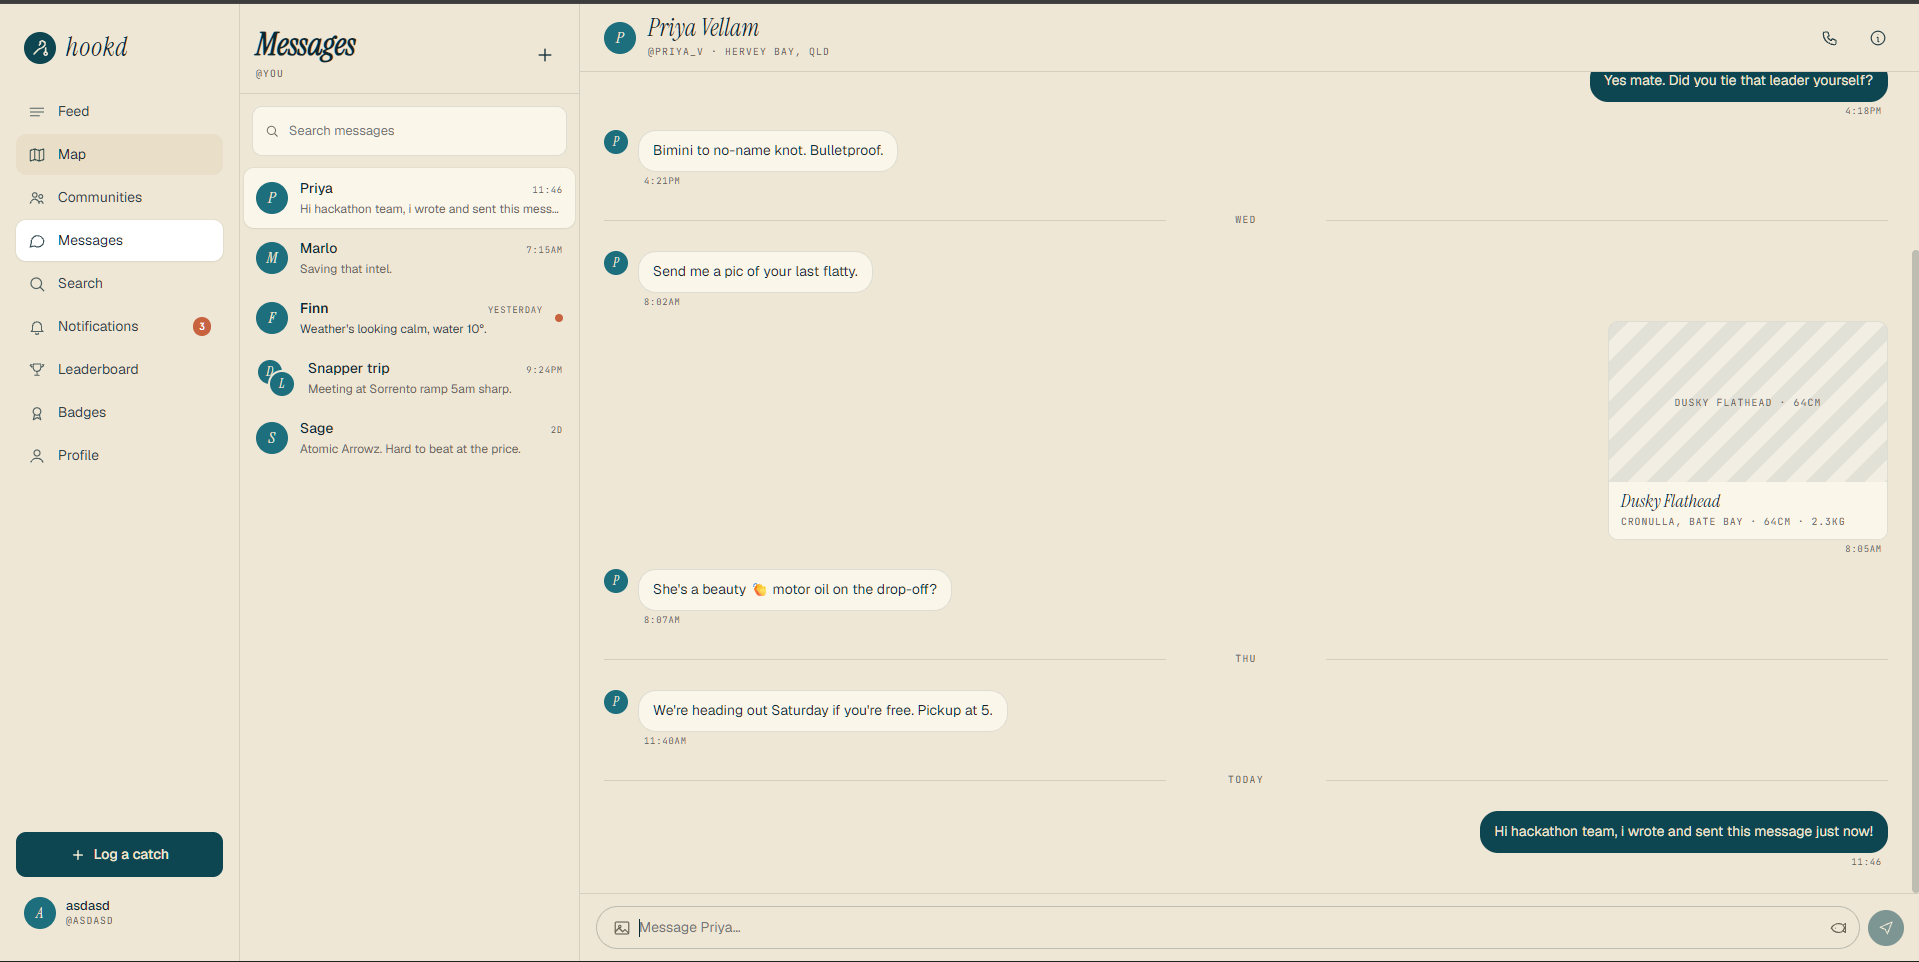
messages
-
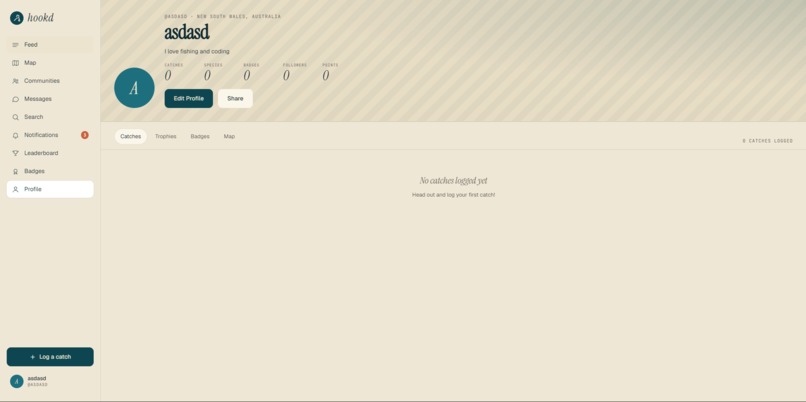
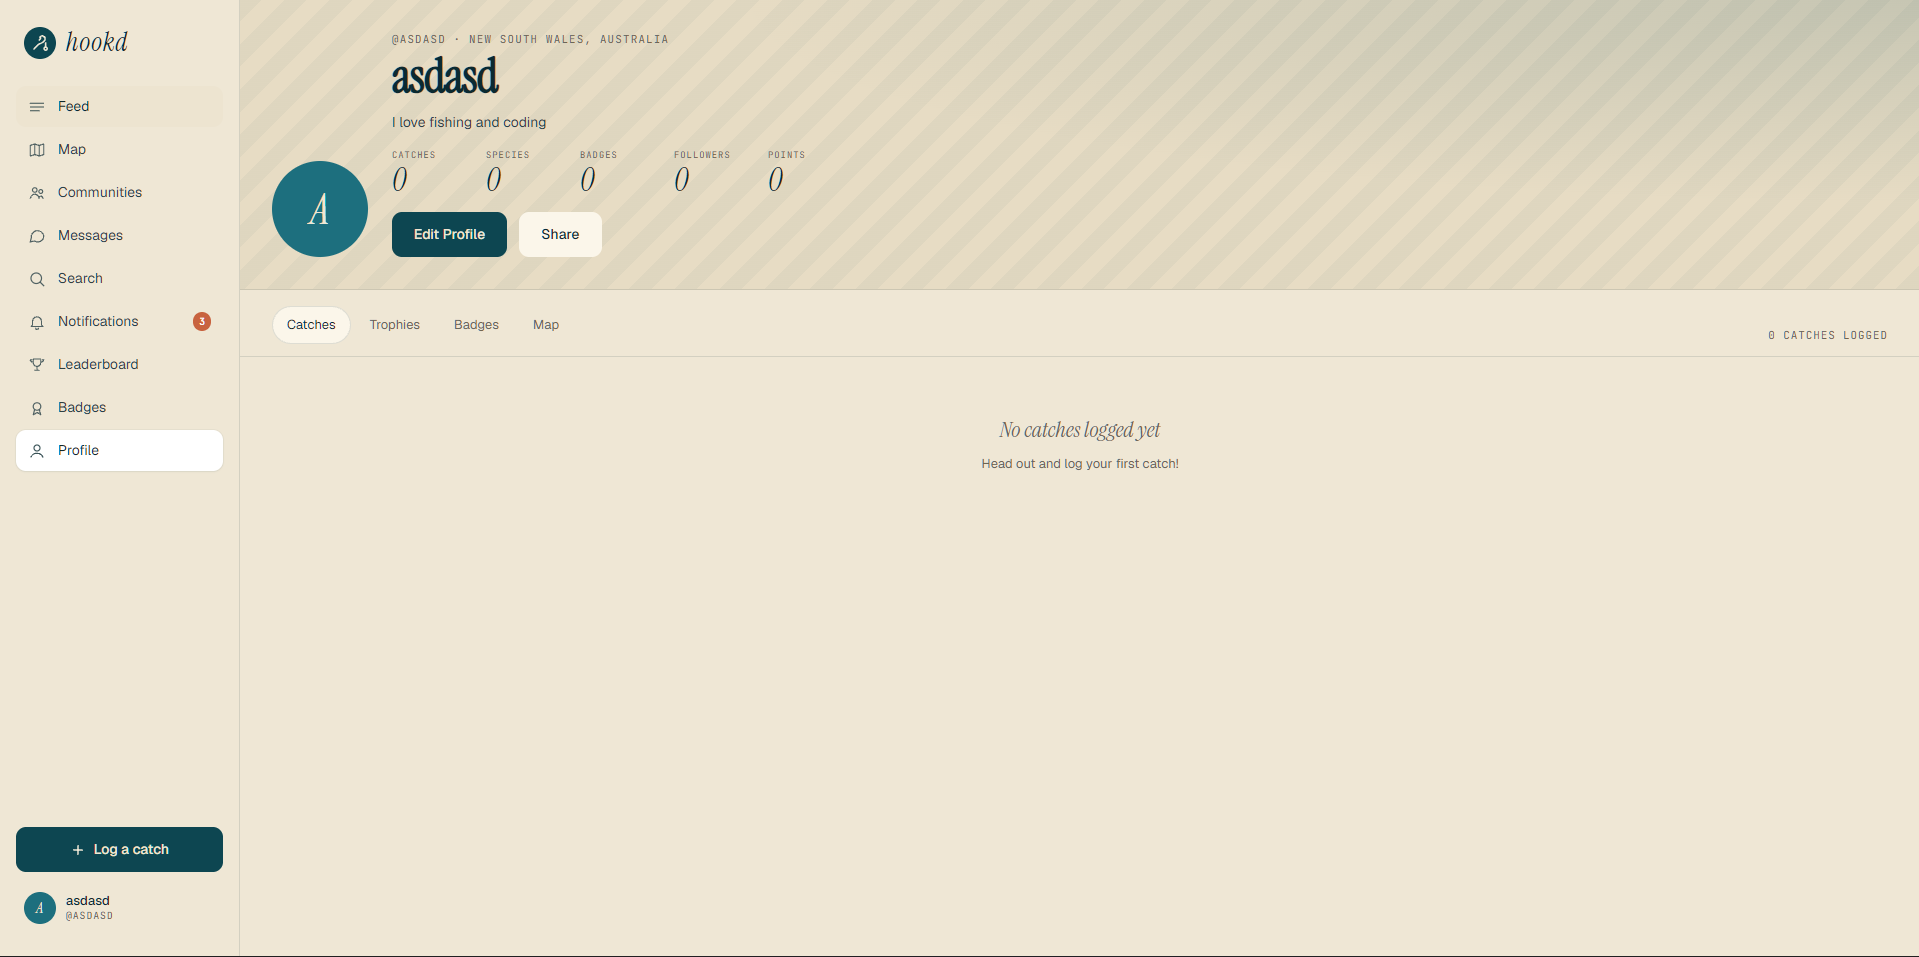
profile tab
-

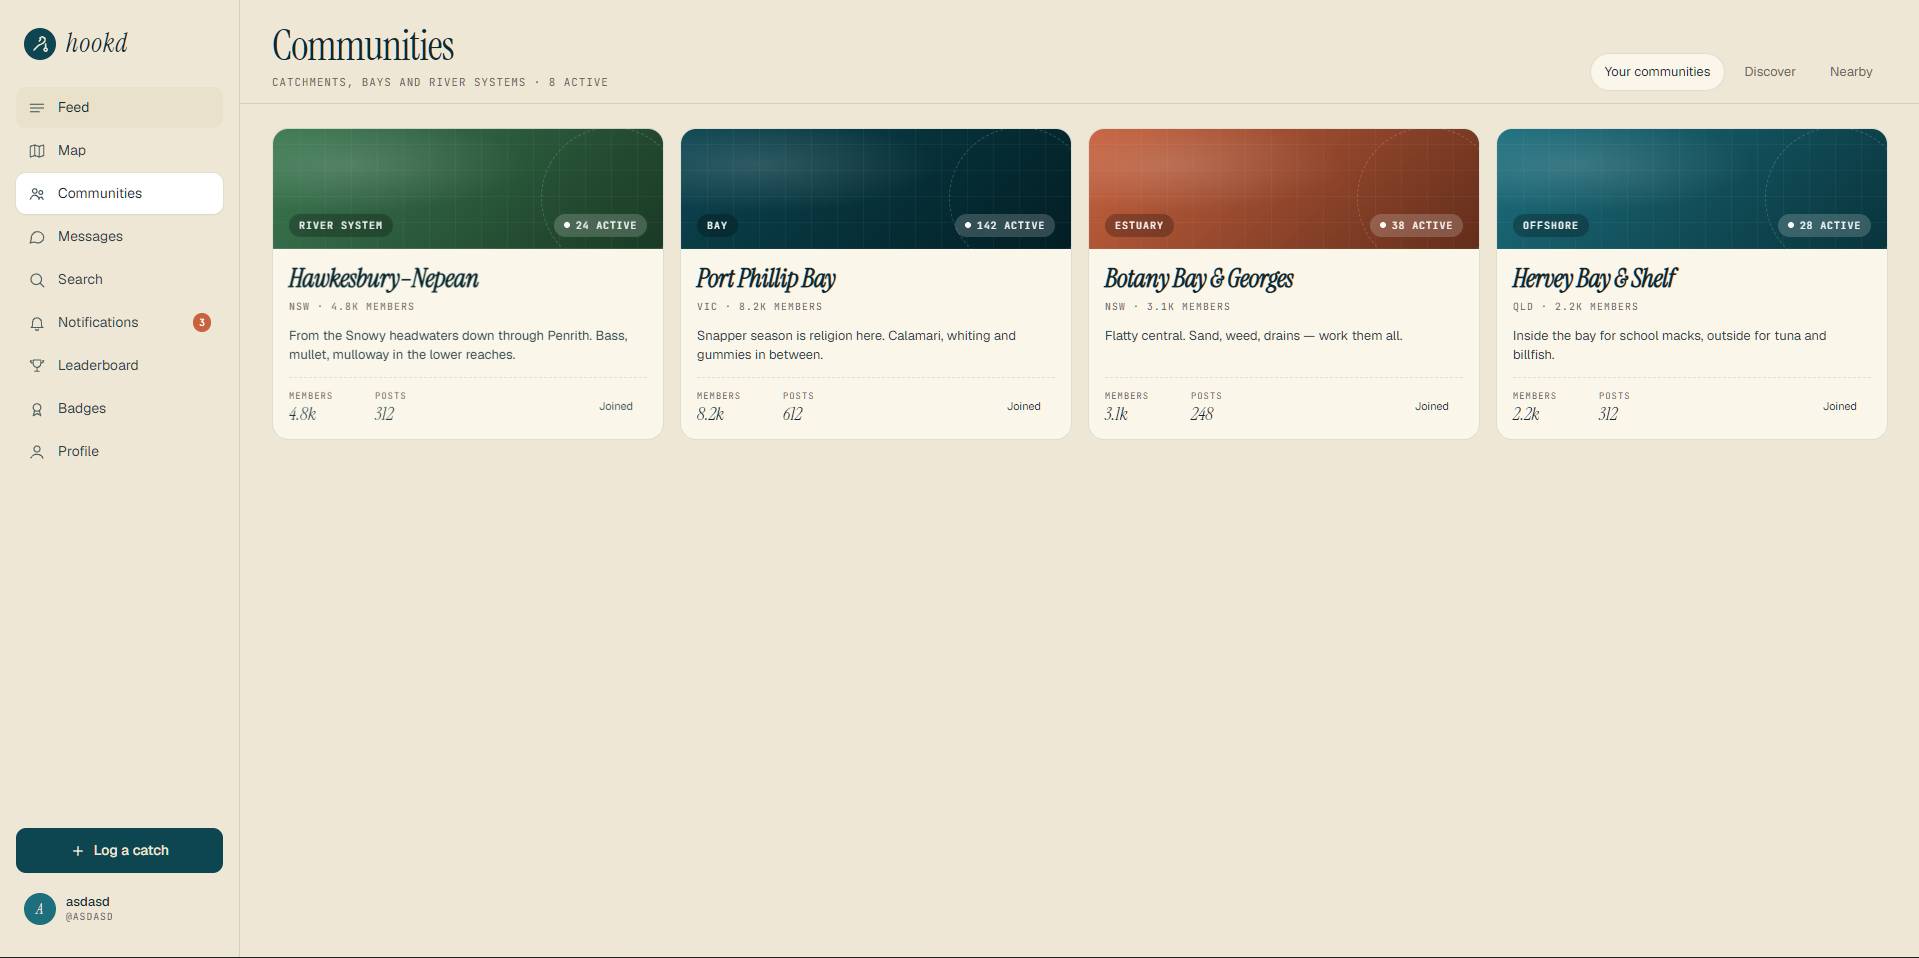
Community tab with the local catchment areas/waterways you follow/ are near
-

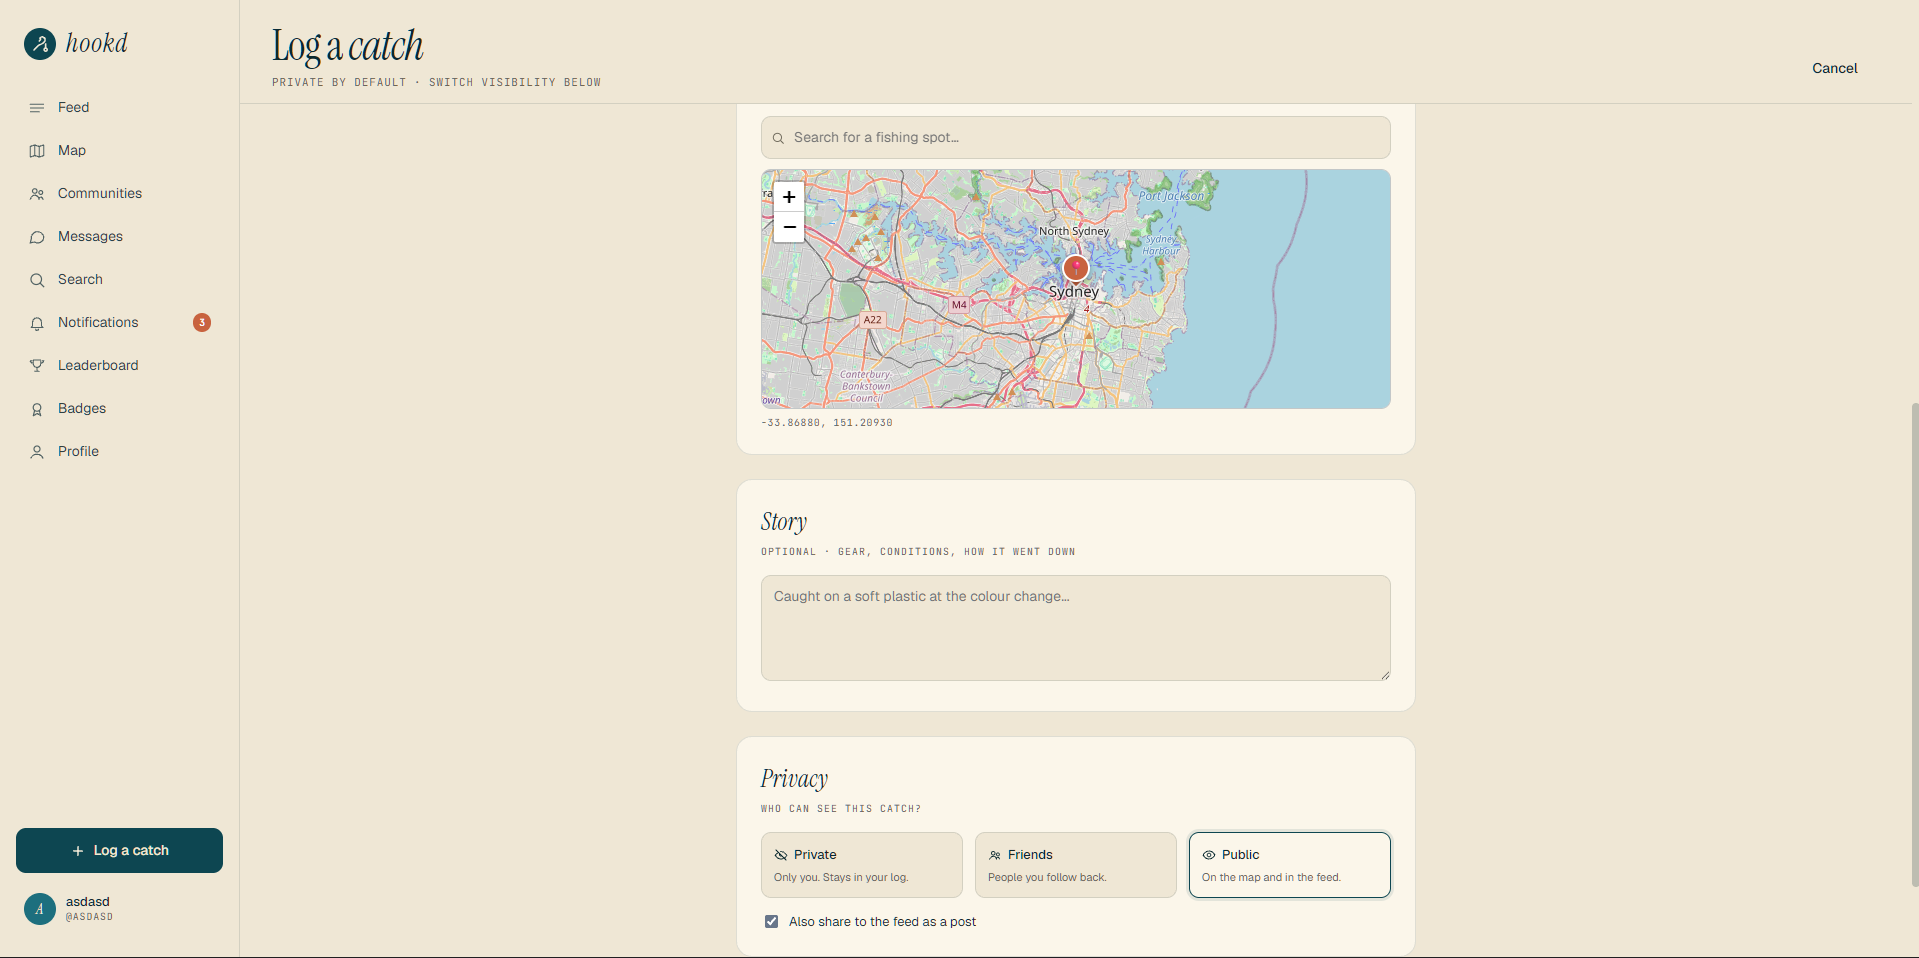
logging a catch pt 2 (scrolled down from part 1
-

posted catch
-
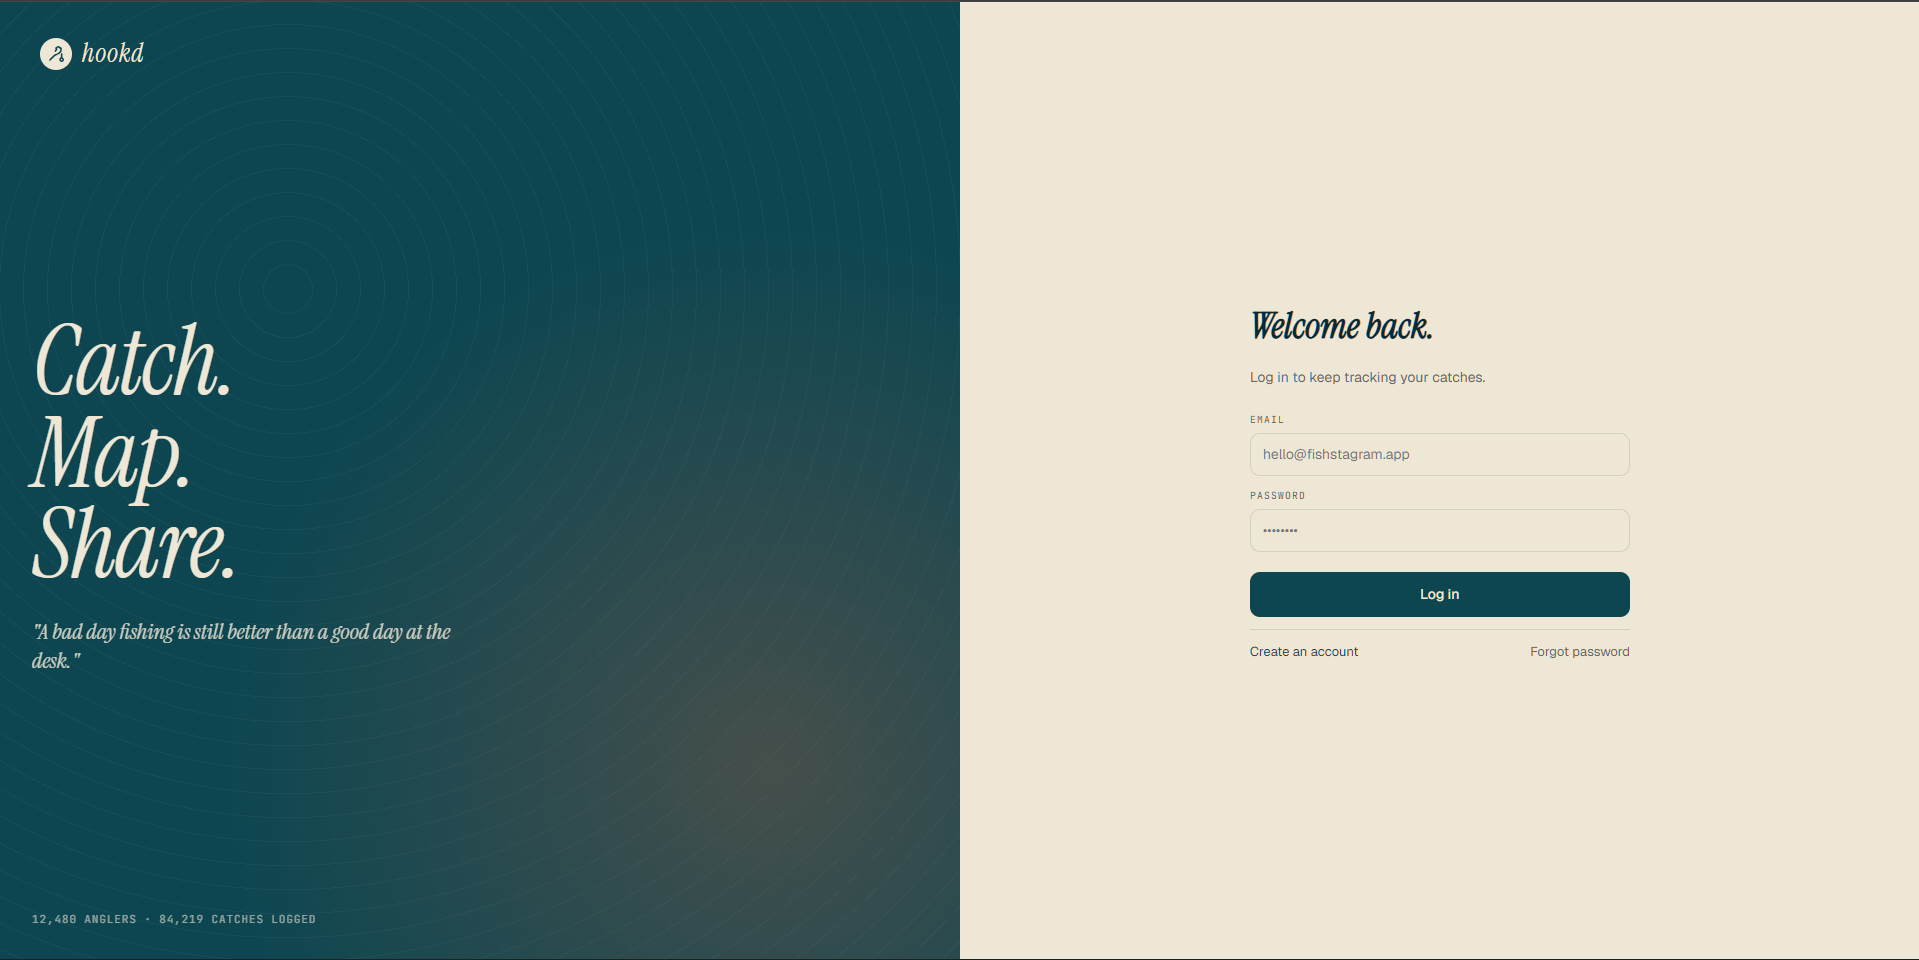
login page w/o dropdown
-
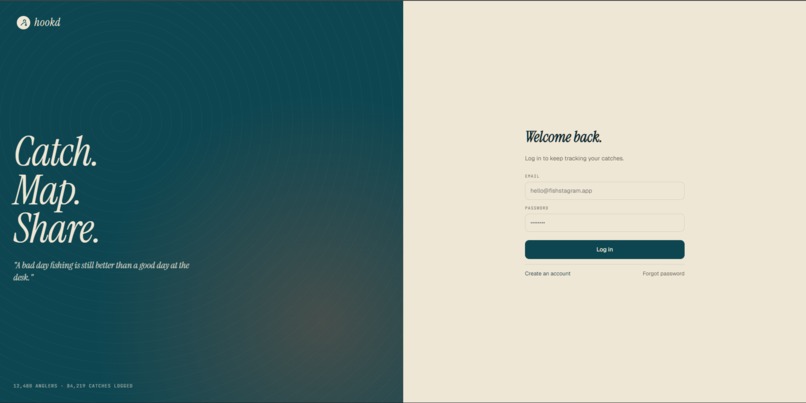
Login
-
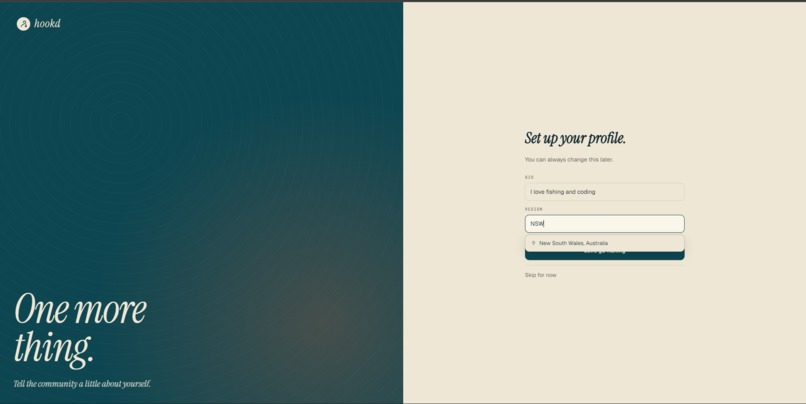
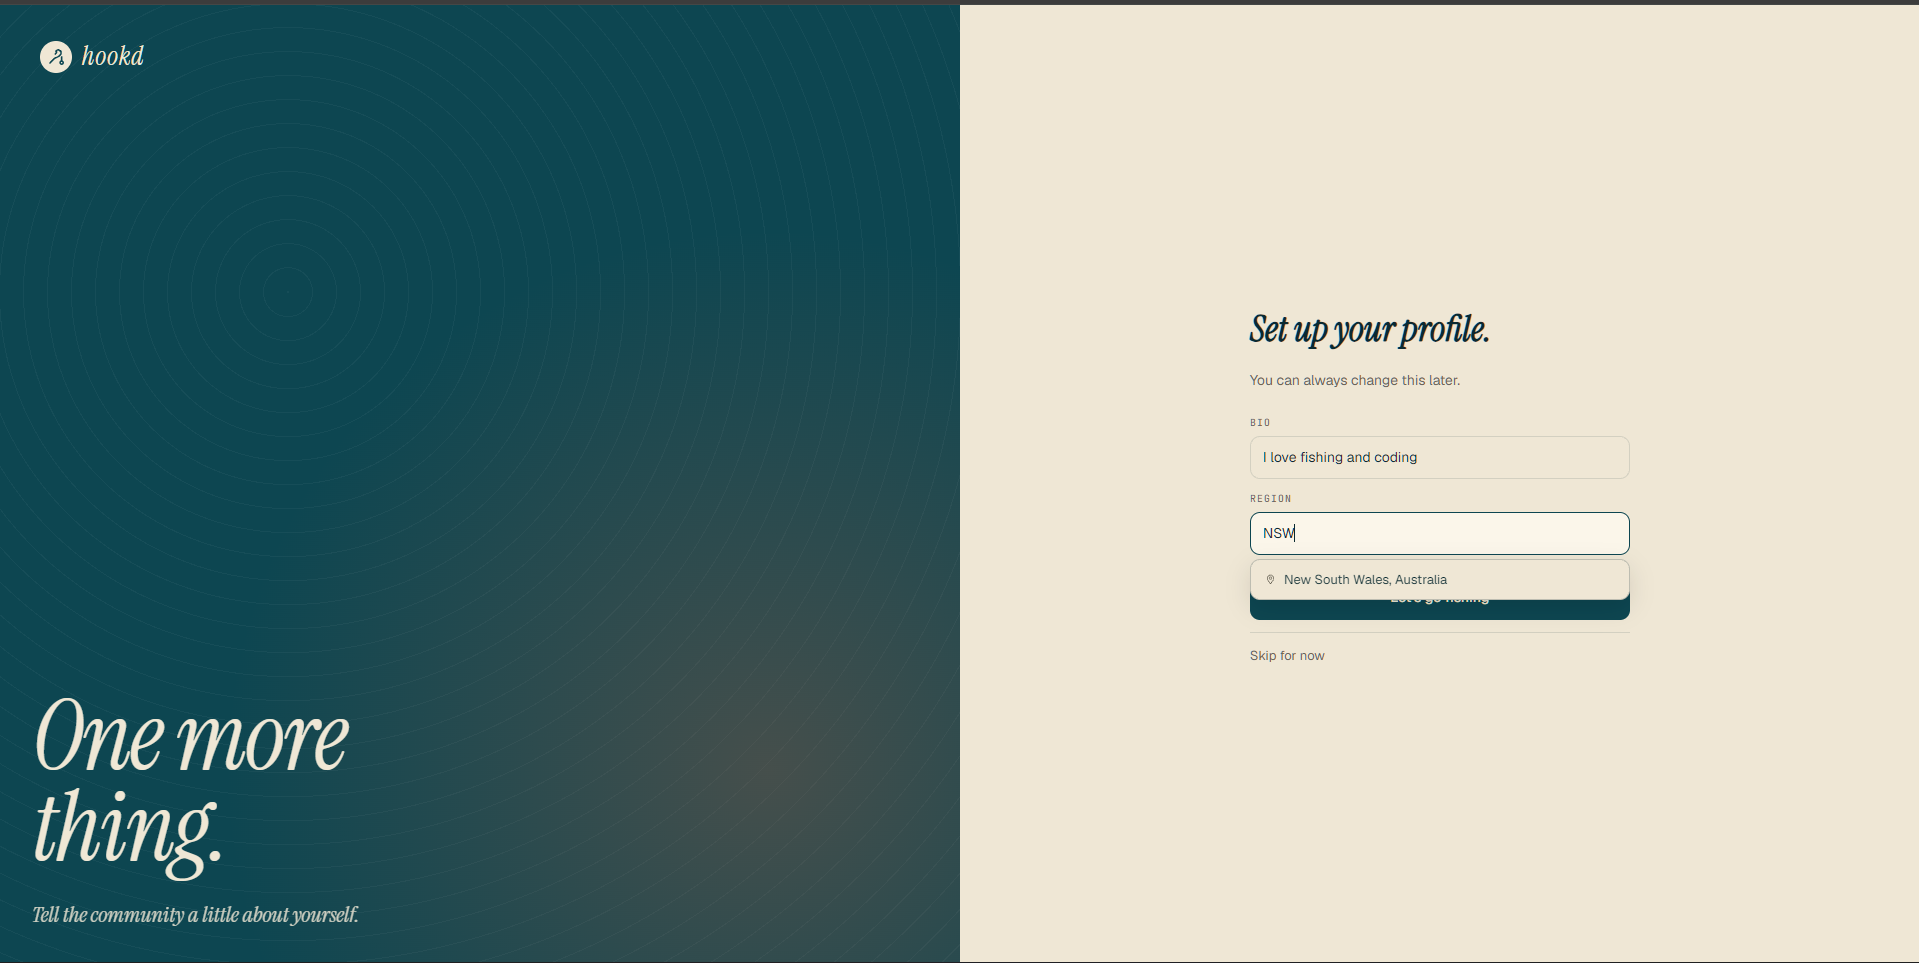
typing deets + drop down bar for auto completion/find of region
-
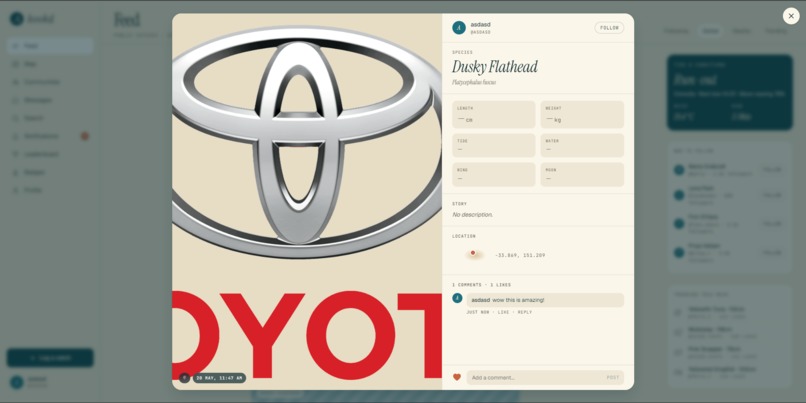
when you click into a post, commenting adn liking with persitence
-
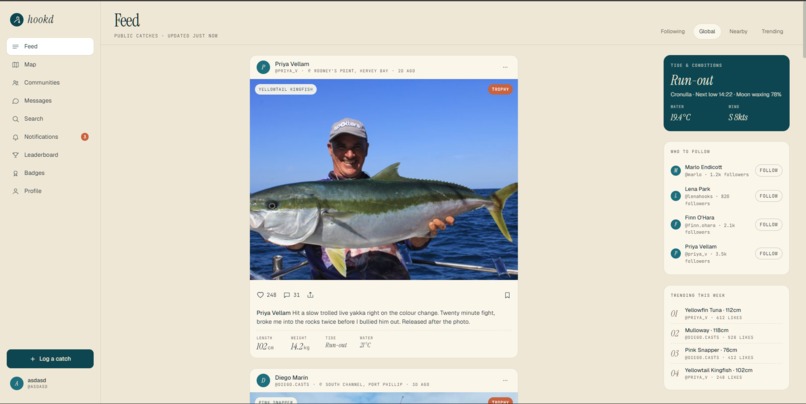
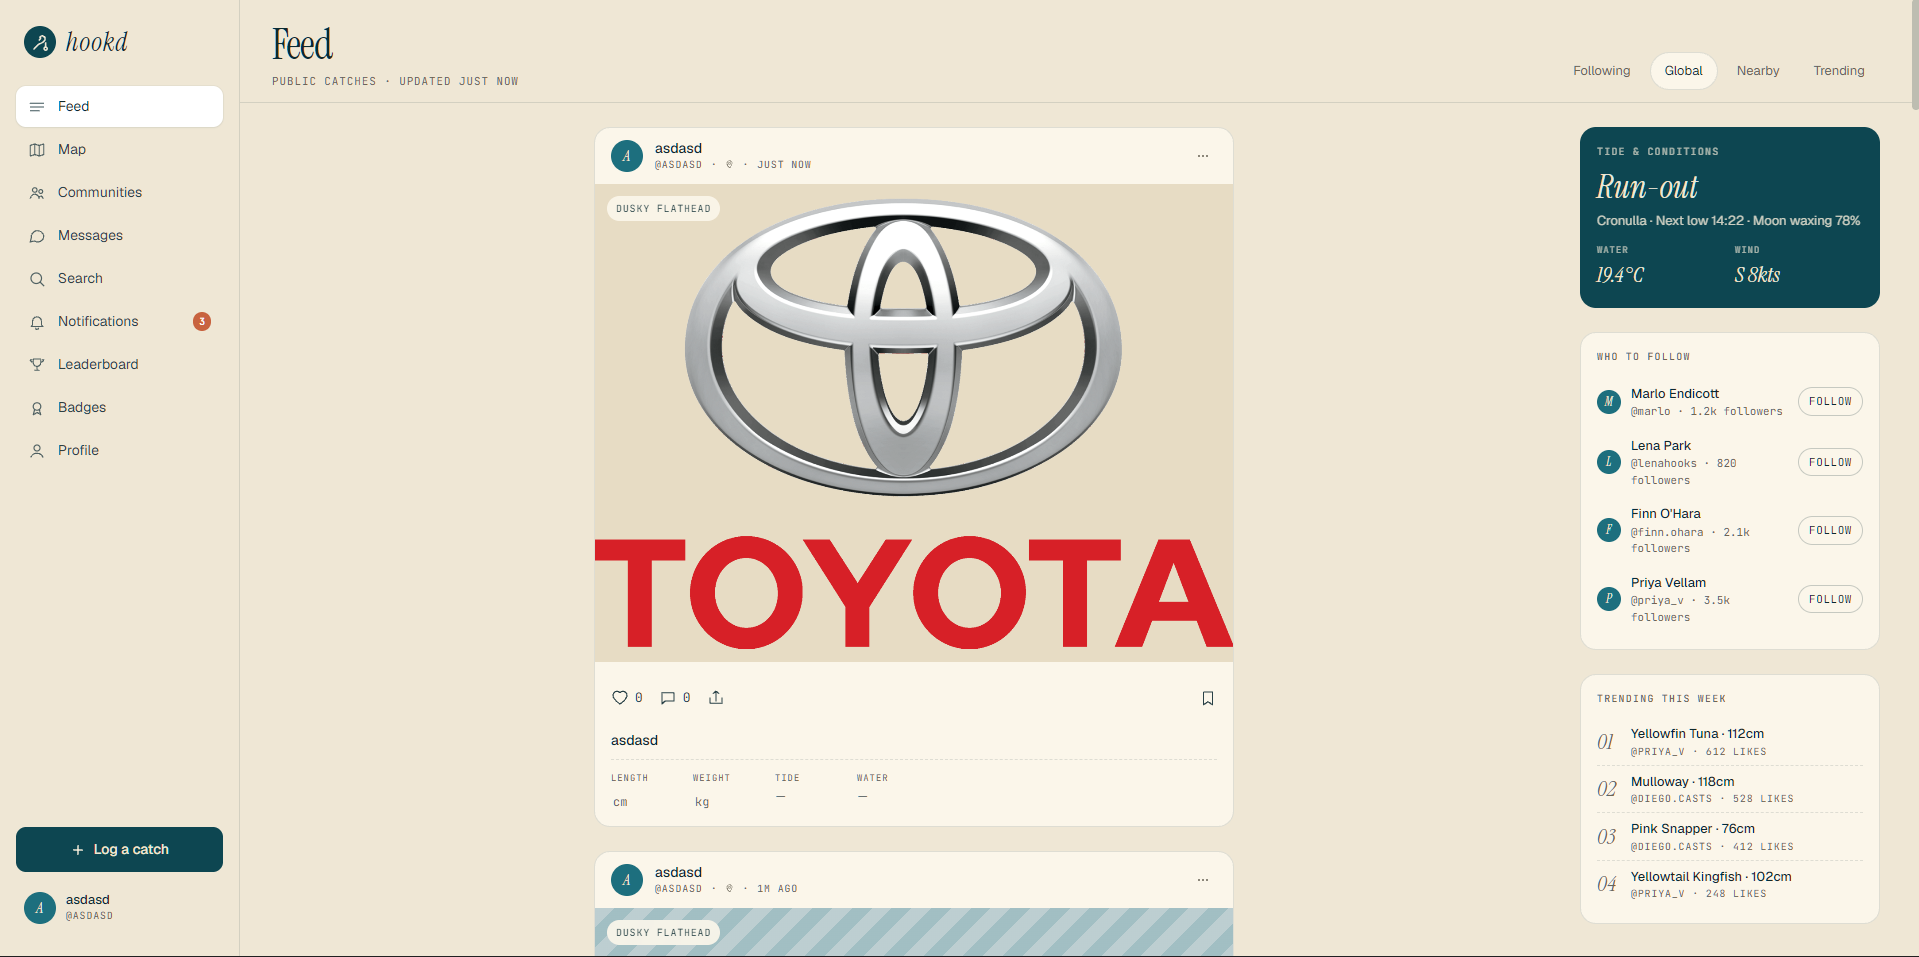
main feed
-

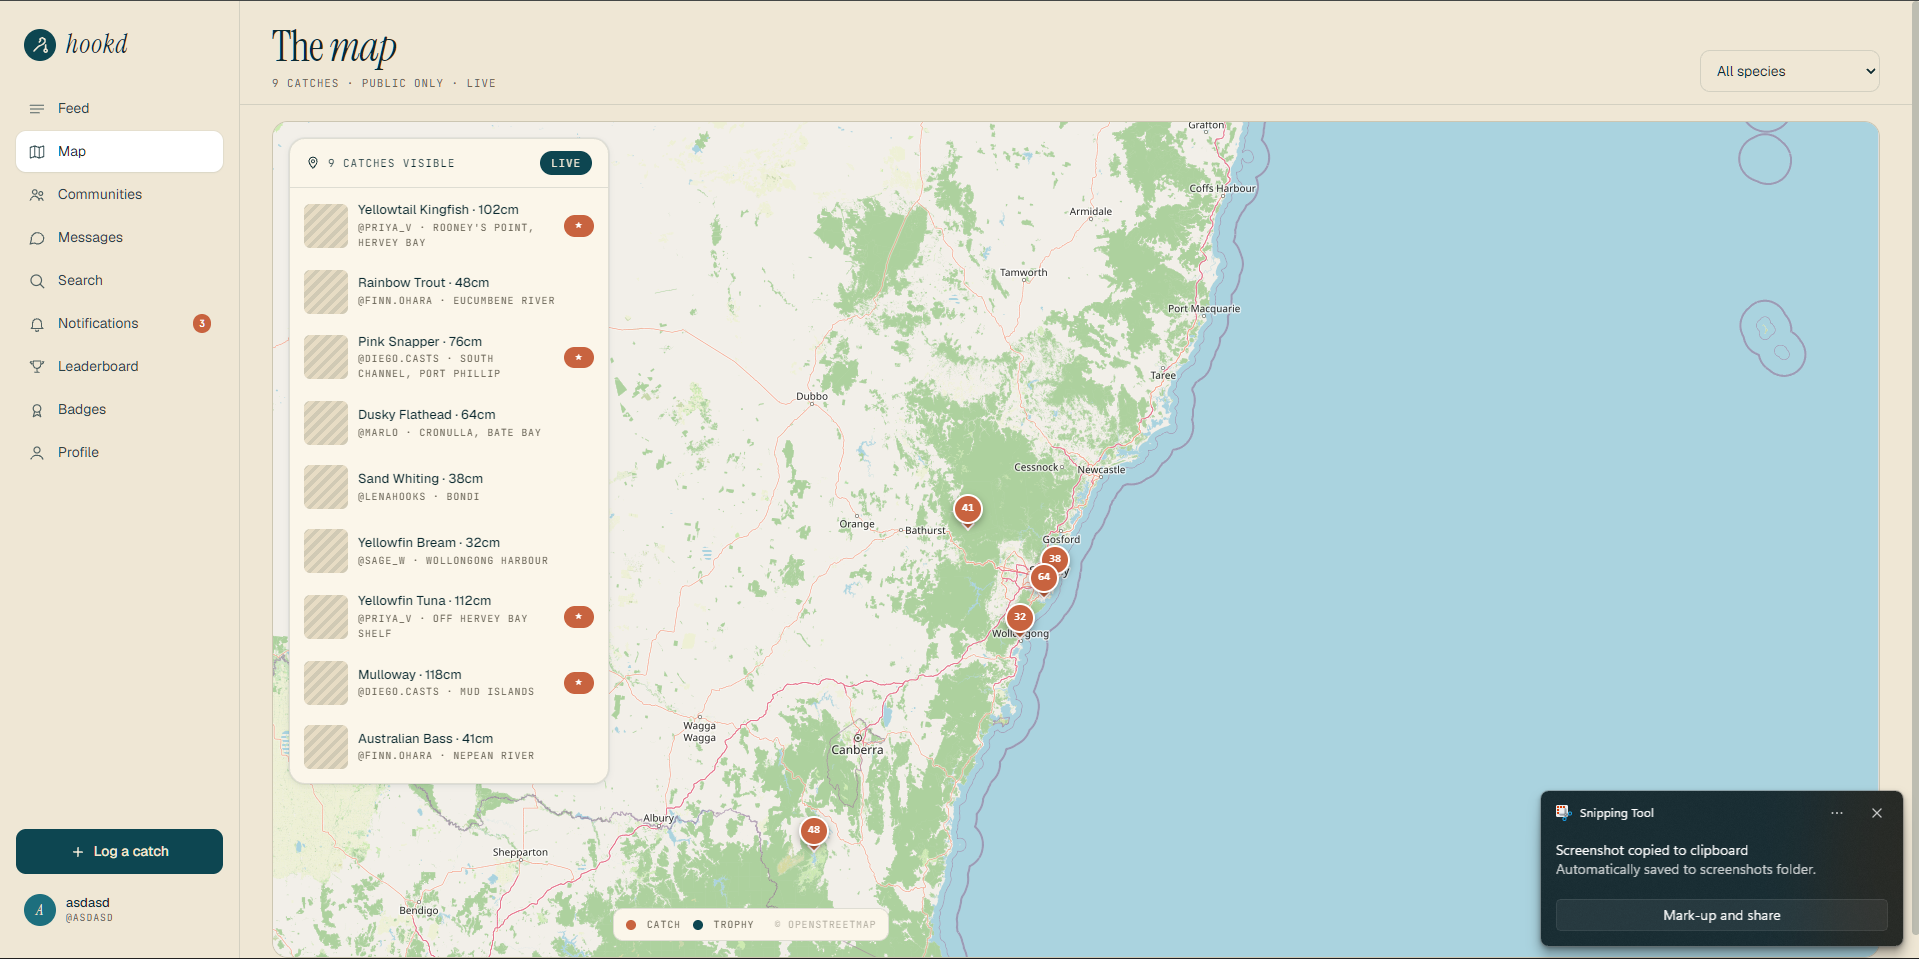
interactive live map of catches in area with location of other catches, freuqnecy, size
-
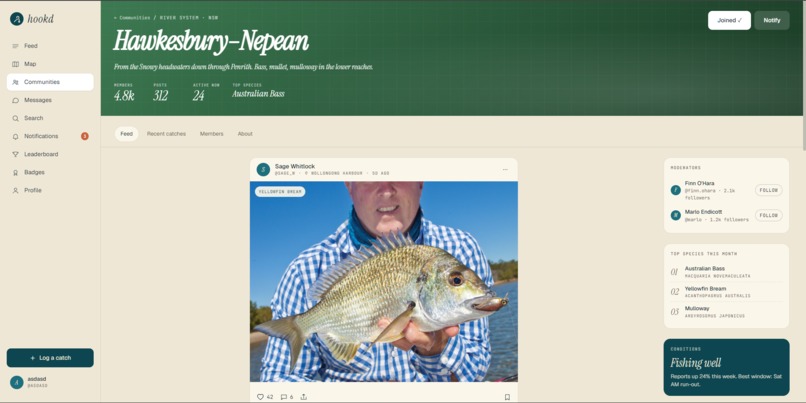
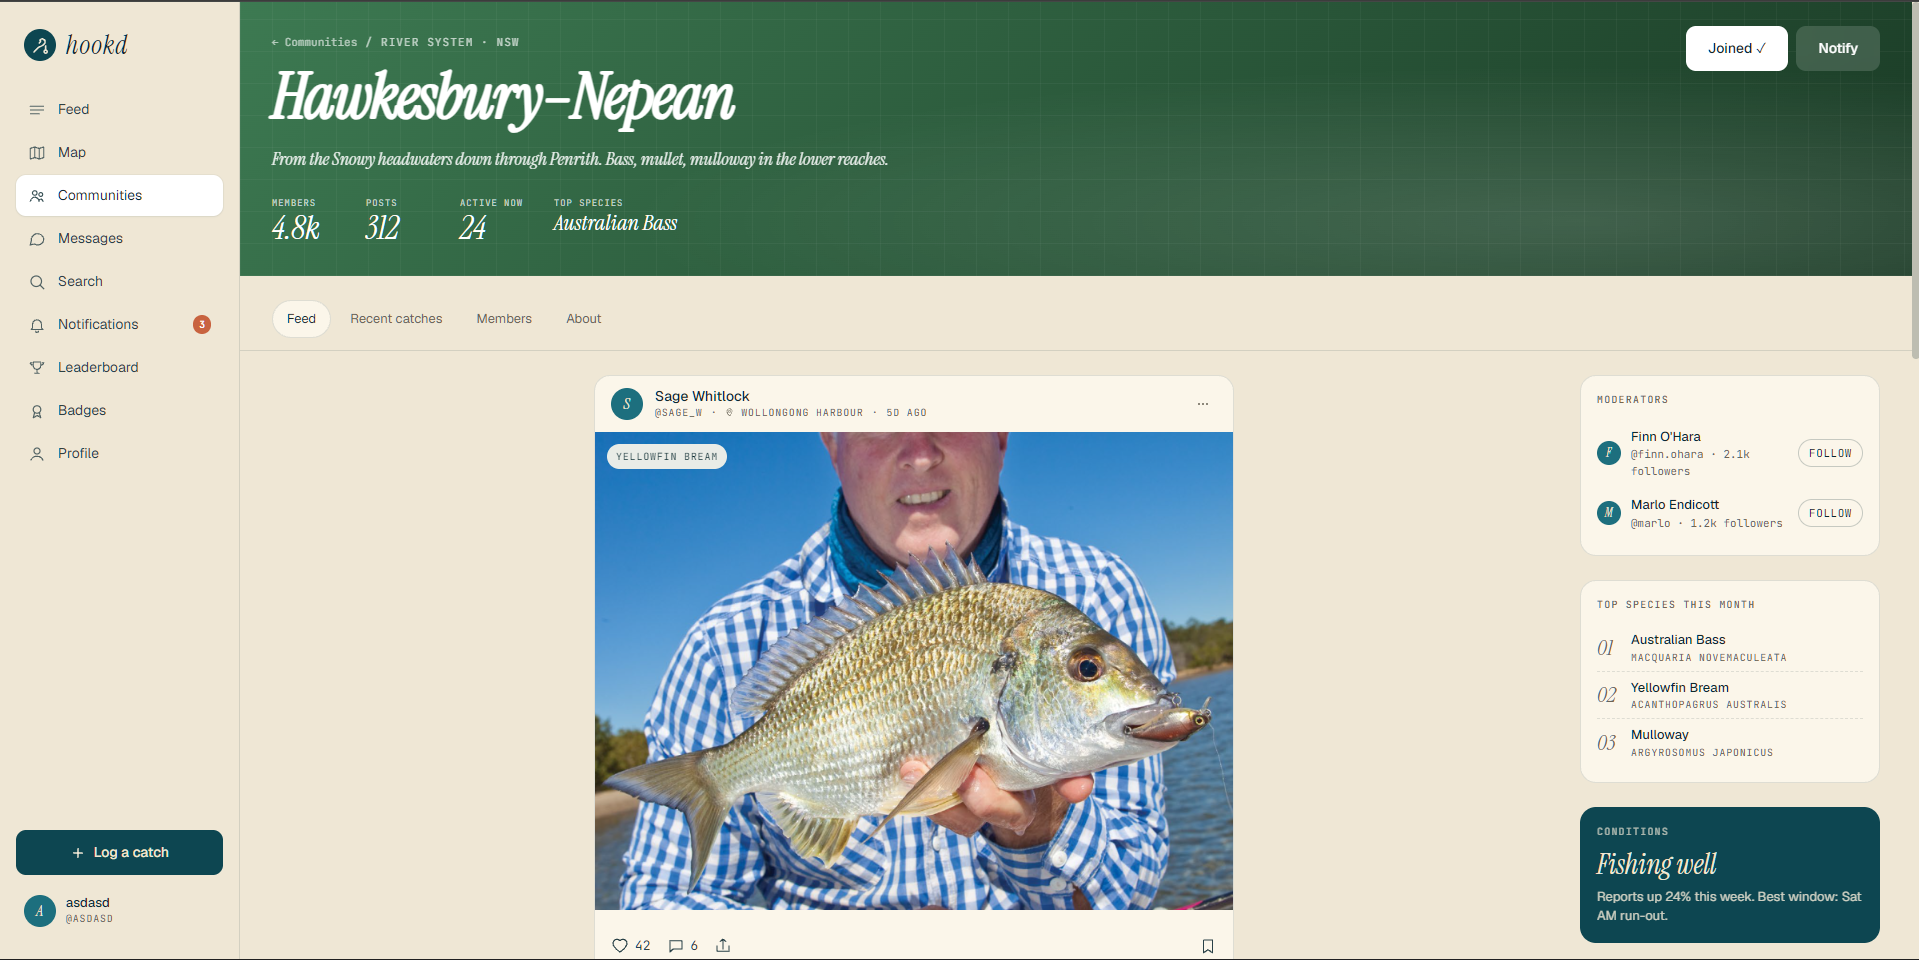
Inside each community tab


Inspiration
Fishing is one of the most social activities — until you get home. The banter on the water, the shared excitement of a trophy catch, the local knowledge whispered between regulars at the same spot for decades — none of it survives the drive back. Stories end up buried in group chats, photos rot in camera rolls, and hard-won knowledge about tides and hotspots stays locked in the heads of a lucky few.
We're anglers ourselves, and we kept asking: why doesn't a proper social network for fishing exist? The hackathon theme — connections — made the answer obvious. We had to build it.
What it does
Hookd is a full-stack social platform for the fishing community. Log a catch with photos, species, weight, length, and conditions. Follow other anglers and browse a live feed filtered by the people you follow, anglers nearby, or what's trending globally. Pin your catch to an interactive map so others can see where fish are being caught right now. Join communities around species or regions, compete on leaderboards, earn badges, and message other anglers directly.
How we built it
We used React on the frontend with a custom theming system supporting light/dark mode, multiple colour palettes, and density settings. The backend is Express/Node with a REST API handling auth, catches, follows, and user profiles — with persistence so your catches survive a page refresh.
The feed merges live API data with seed data sorted by recency. The map renders catch pins geographically and updates as new catches are logged. We paid special attention to surfacing conditions — tide state, water temperature, wind — alongside every catch, because that context is what transforms a log into genuinely useful knowledge for the next angler heading to the same spot.
Challenges we ran into
Time. Shipping auth, a social graph, a map, communities, messaging, leaderboards, and a badge system in 48 hours meant ruthless prioritisation. We cut scope constantly.
The social graph. Following, followers, and feed filtering sounds simple until you're merging live API results with seed data and need counts to stay consistent across components. We built a small client-side user cache to keep everything in sync.
Data modelling. A catch sits at the intersection of a user, a species, a location, and a set of conditions. Getting that schema right early — so the feed, map, and detail views could all share the same data shape — saved us from painful refactors later.
Accomplishments that we're proud of
Shipping a genuinely usable app in 48 hours. You can sign up, log a real catch with a photo, see it appear in the feed and on the map, and follow another angler — end to end, no smoke and mirrors. The conditions widget (tide, water temp, wind) baked into every catch card is a small detail we think makes Hookd feel like a tool anglers would actually reach for, not just a hackathon demo
What we learned
Building social features is hard — not technically, but in the design sense. Every screen implicitly asks: whose perspective is this from? Getting the viewer/subject distinction right across the feed, profiles, and notifications took more iterations than we expected.
We also learned that constraints breed creativity. The 48-hour clock forced decisions that would have taken weeks in a normal sprint — and most of them turned out fine
What's next for Hookd
The real unlock is data density — every catch logged makes the platform smarter for every angler on it. Next steps: Species heatmaps — visualise where specific fish are being caught across seasons Bite prediction — use logged conditions data to surface when and where fish are likely to be active Gear tracking — log what lure, line, and technique worked so knowledge compounds over time Native mobile app — fishing happens on the water, not at a desk; a phone-first experience is the natural next st

Log in or sign up for Devpost to join the conversation.