Inspiration
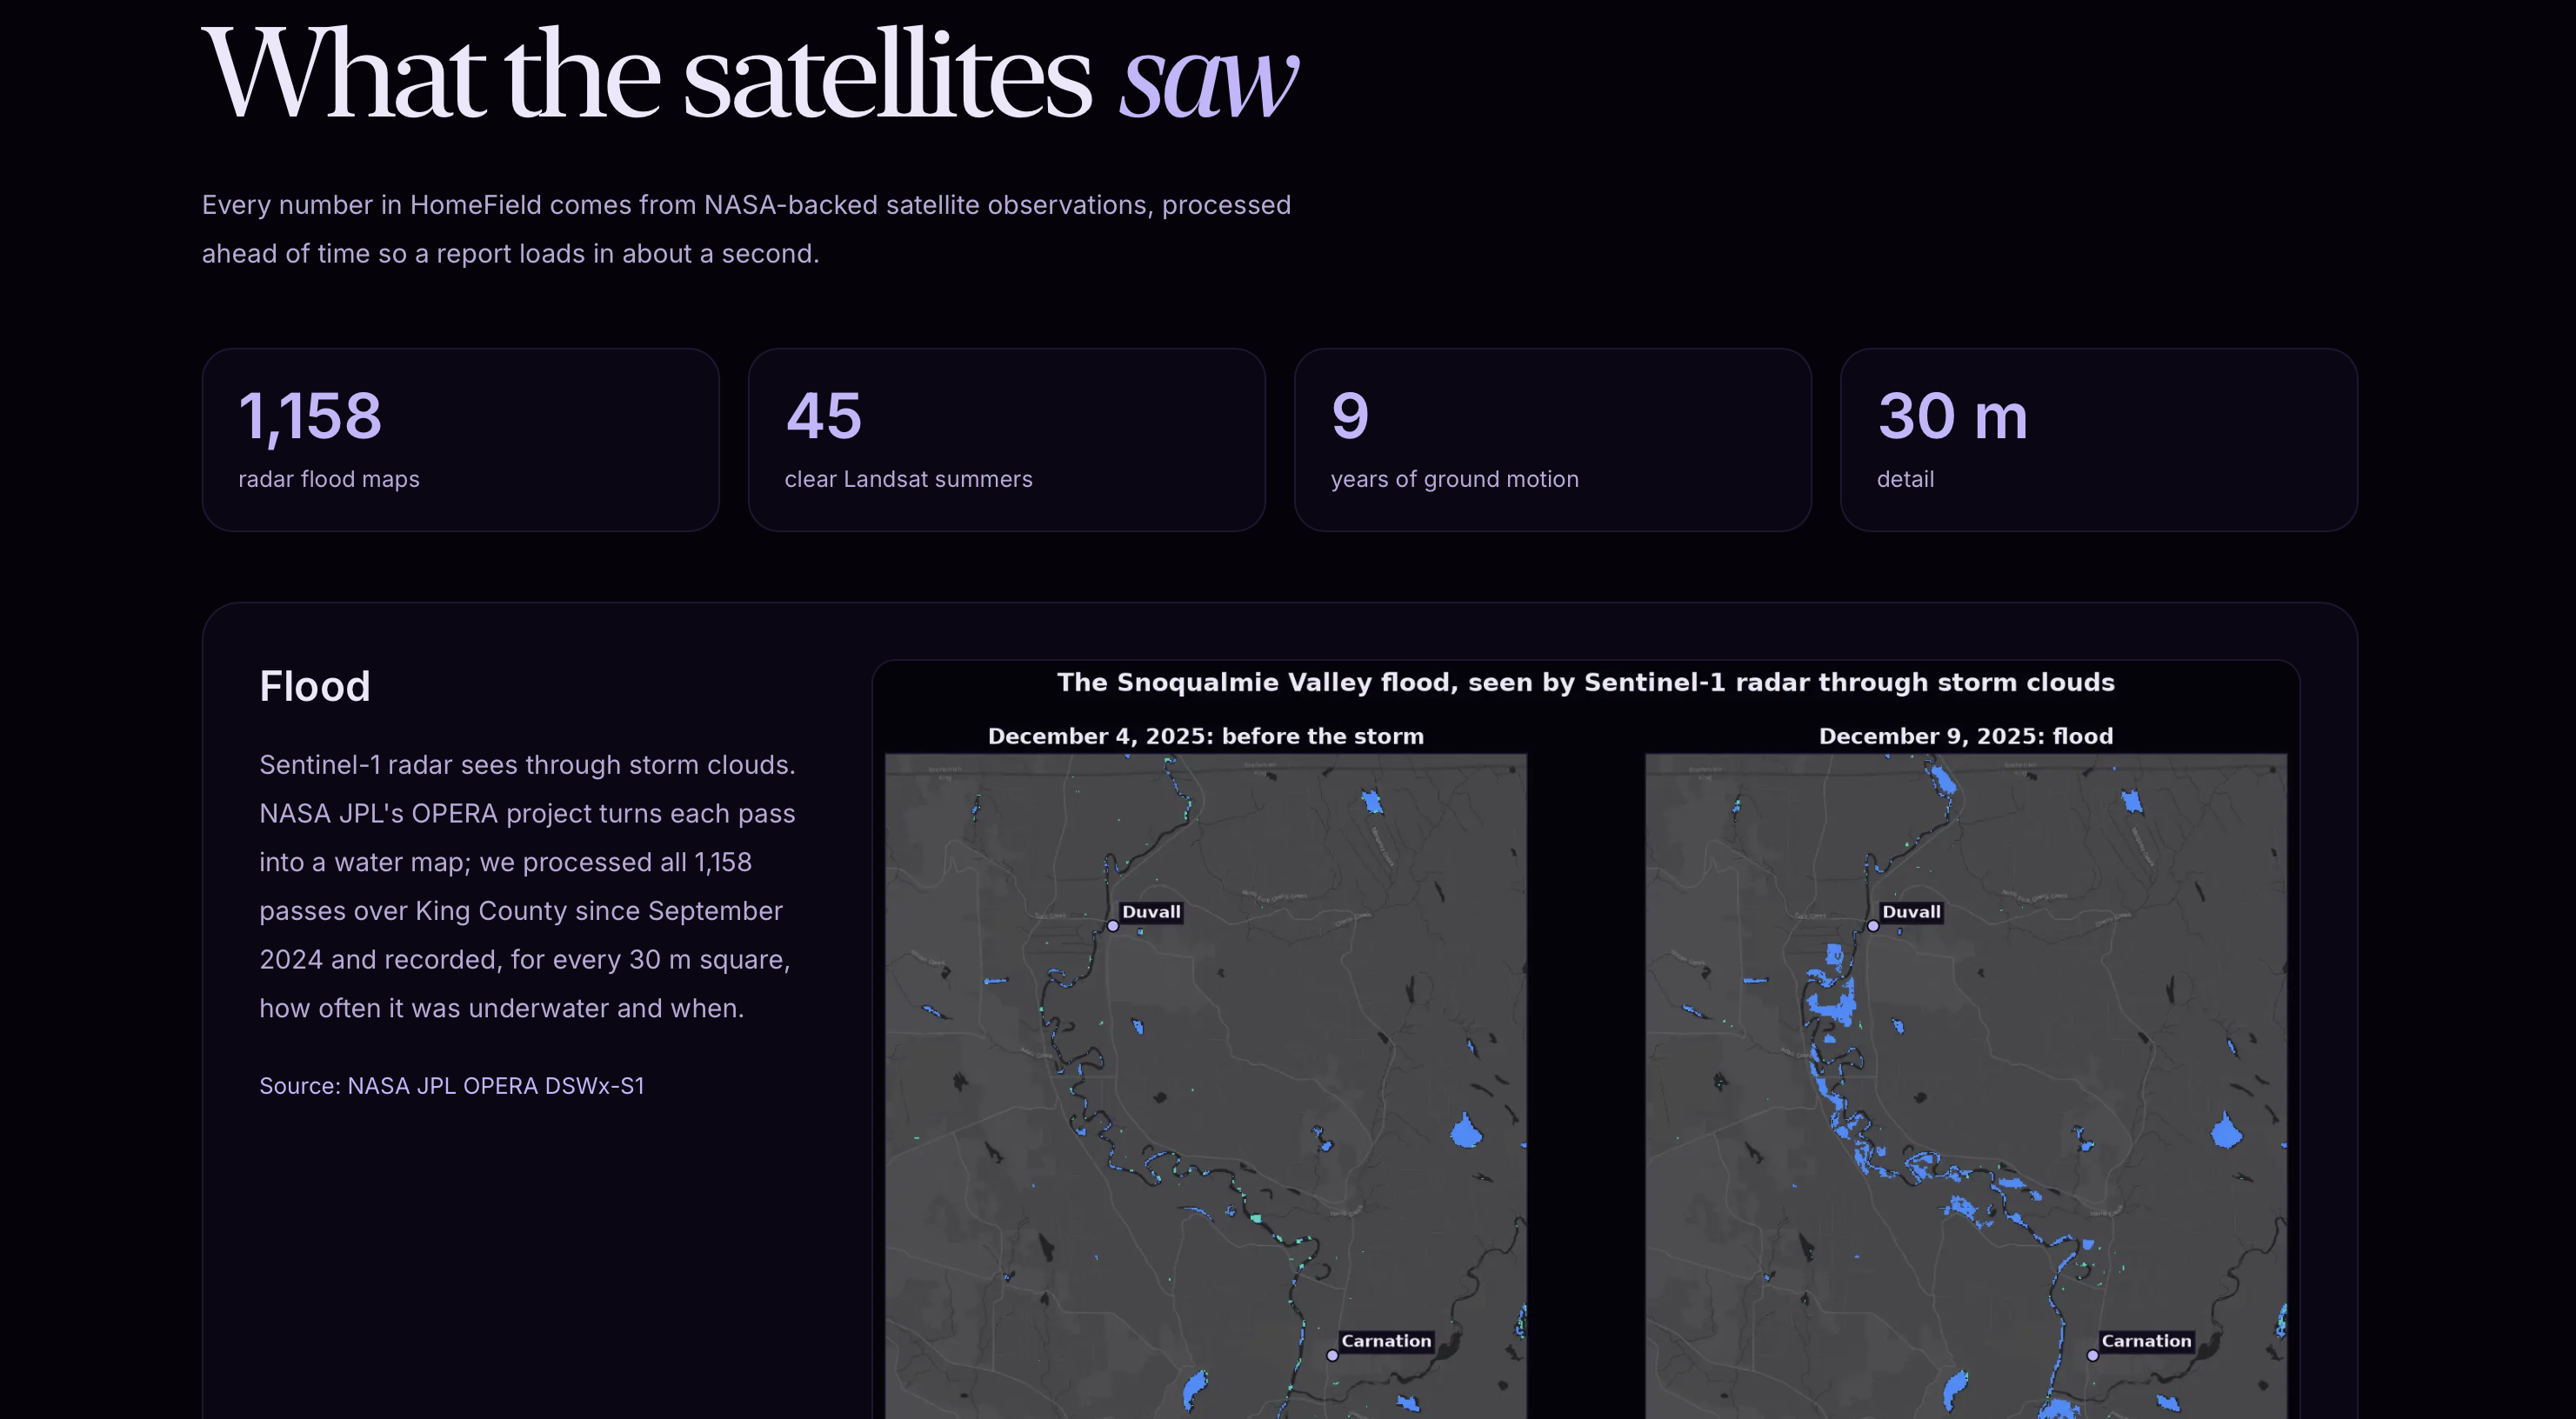
In December 2025, King County experienced historic flooding, with five major river systems reaching the highest flood warning level and nearly 400 homes reporting damage. With just one inch of floodwater capable of causing $25,000 in damage, understanding environmental risks before moving into a home matters.
Yet renters and homebuyers often lack accessible information about flooding, extreme heat, and ground instability. Meanwhile, NASA satellites have collected over decades of environmental observations, but this data remains buried in complex scientific datasets.
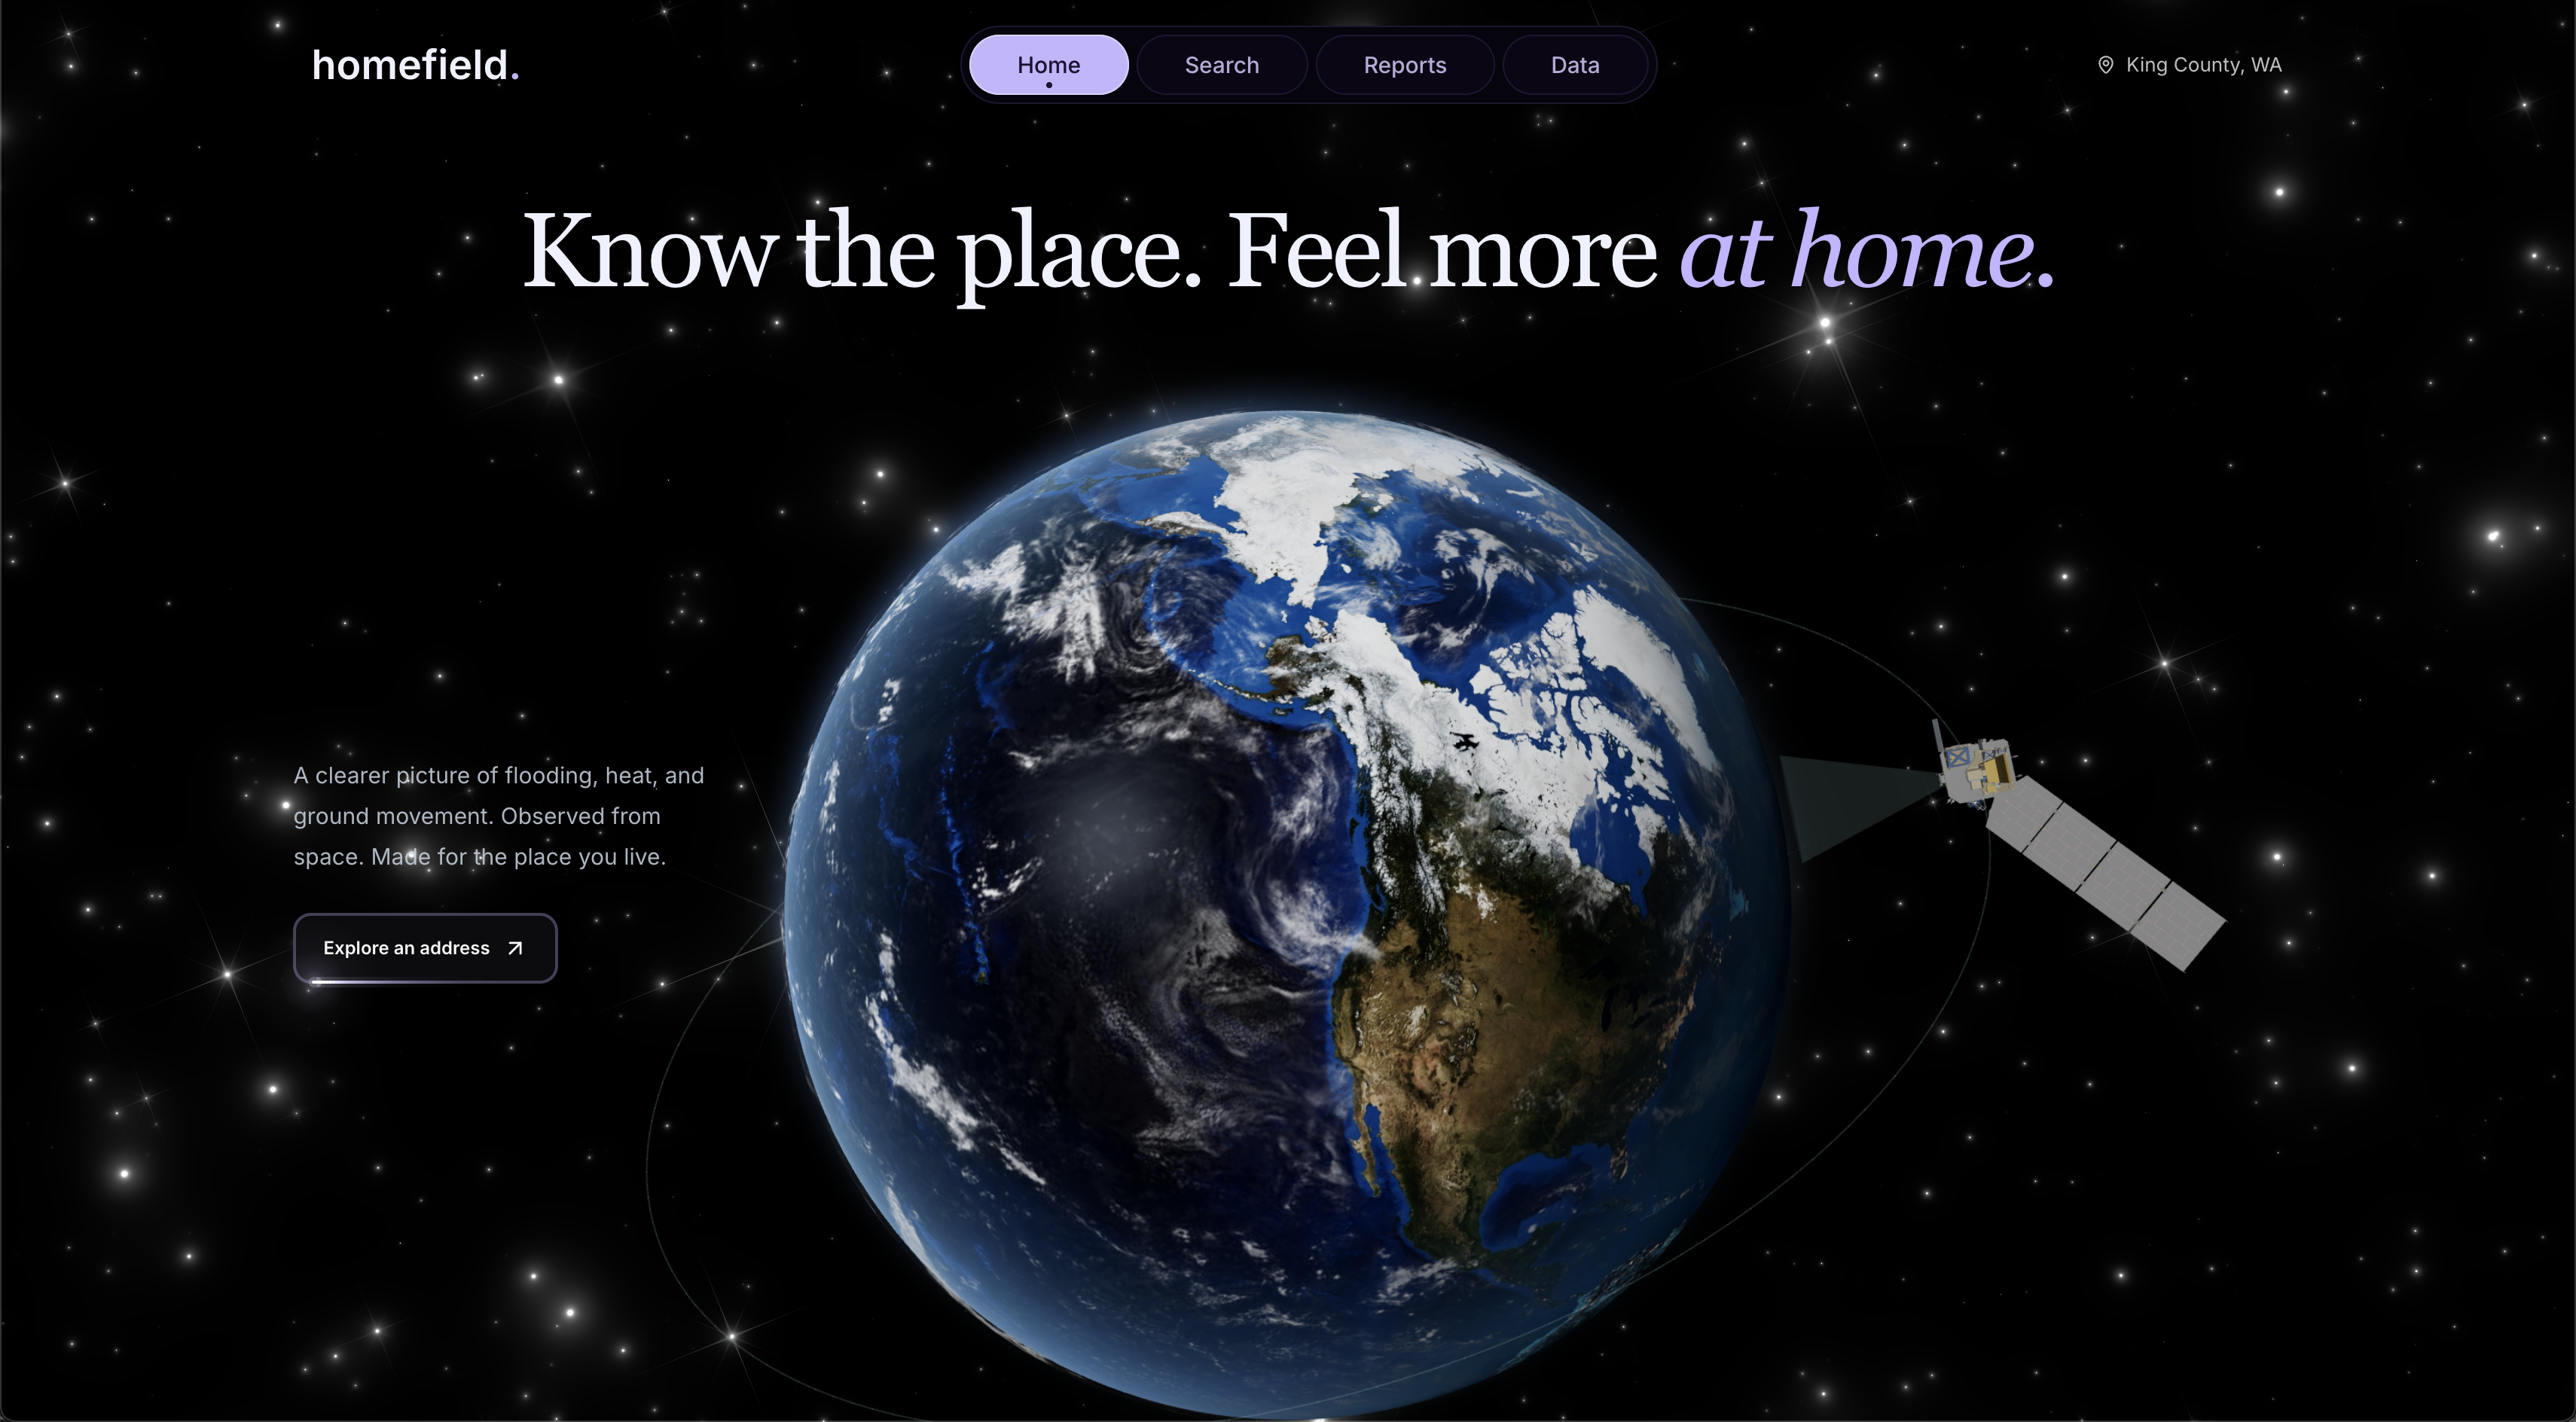
We built homefield to change that, transforming satellite data into an accessible environmental history of a home, helping people understand the risks before they move in.
What it does
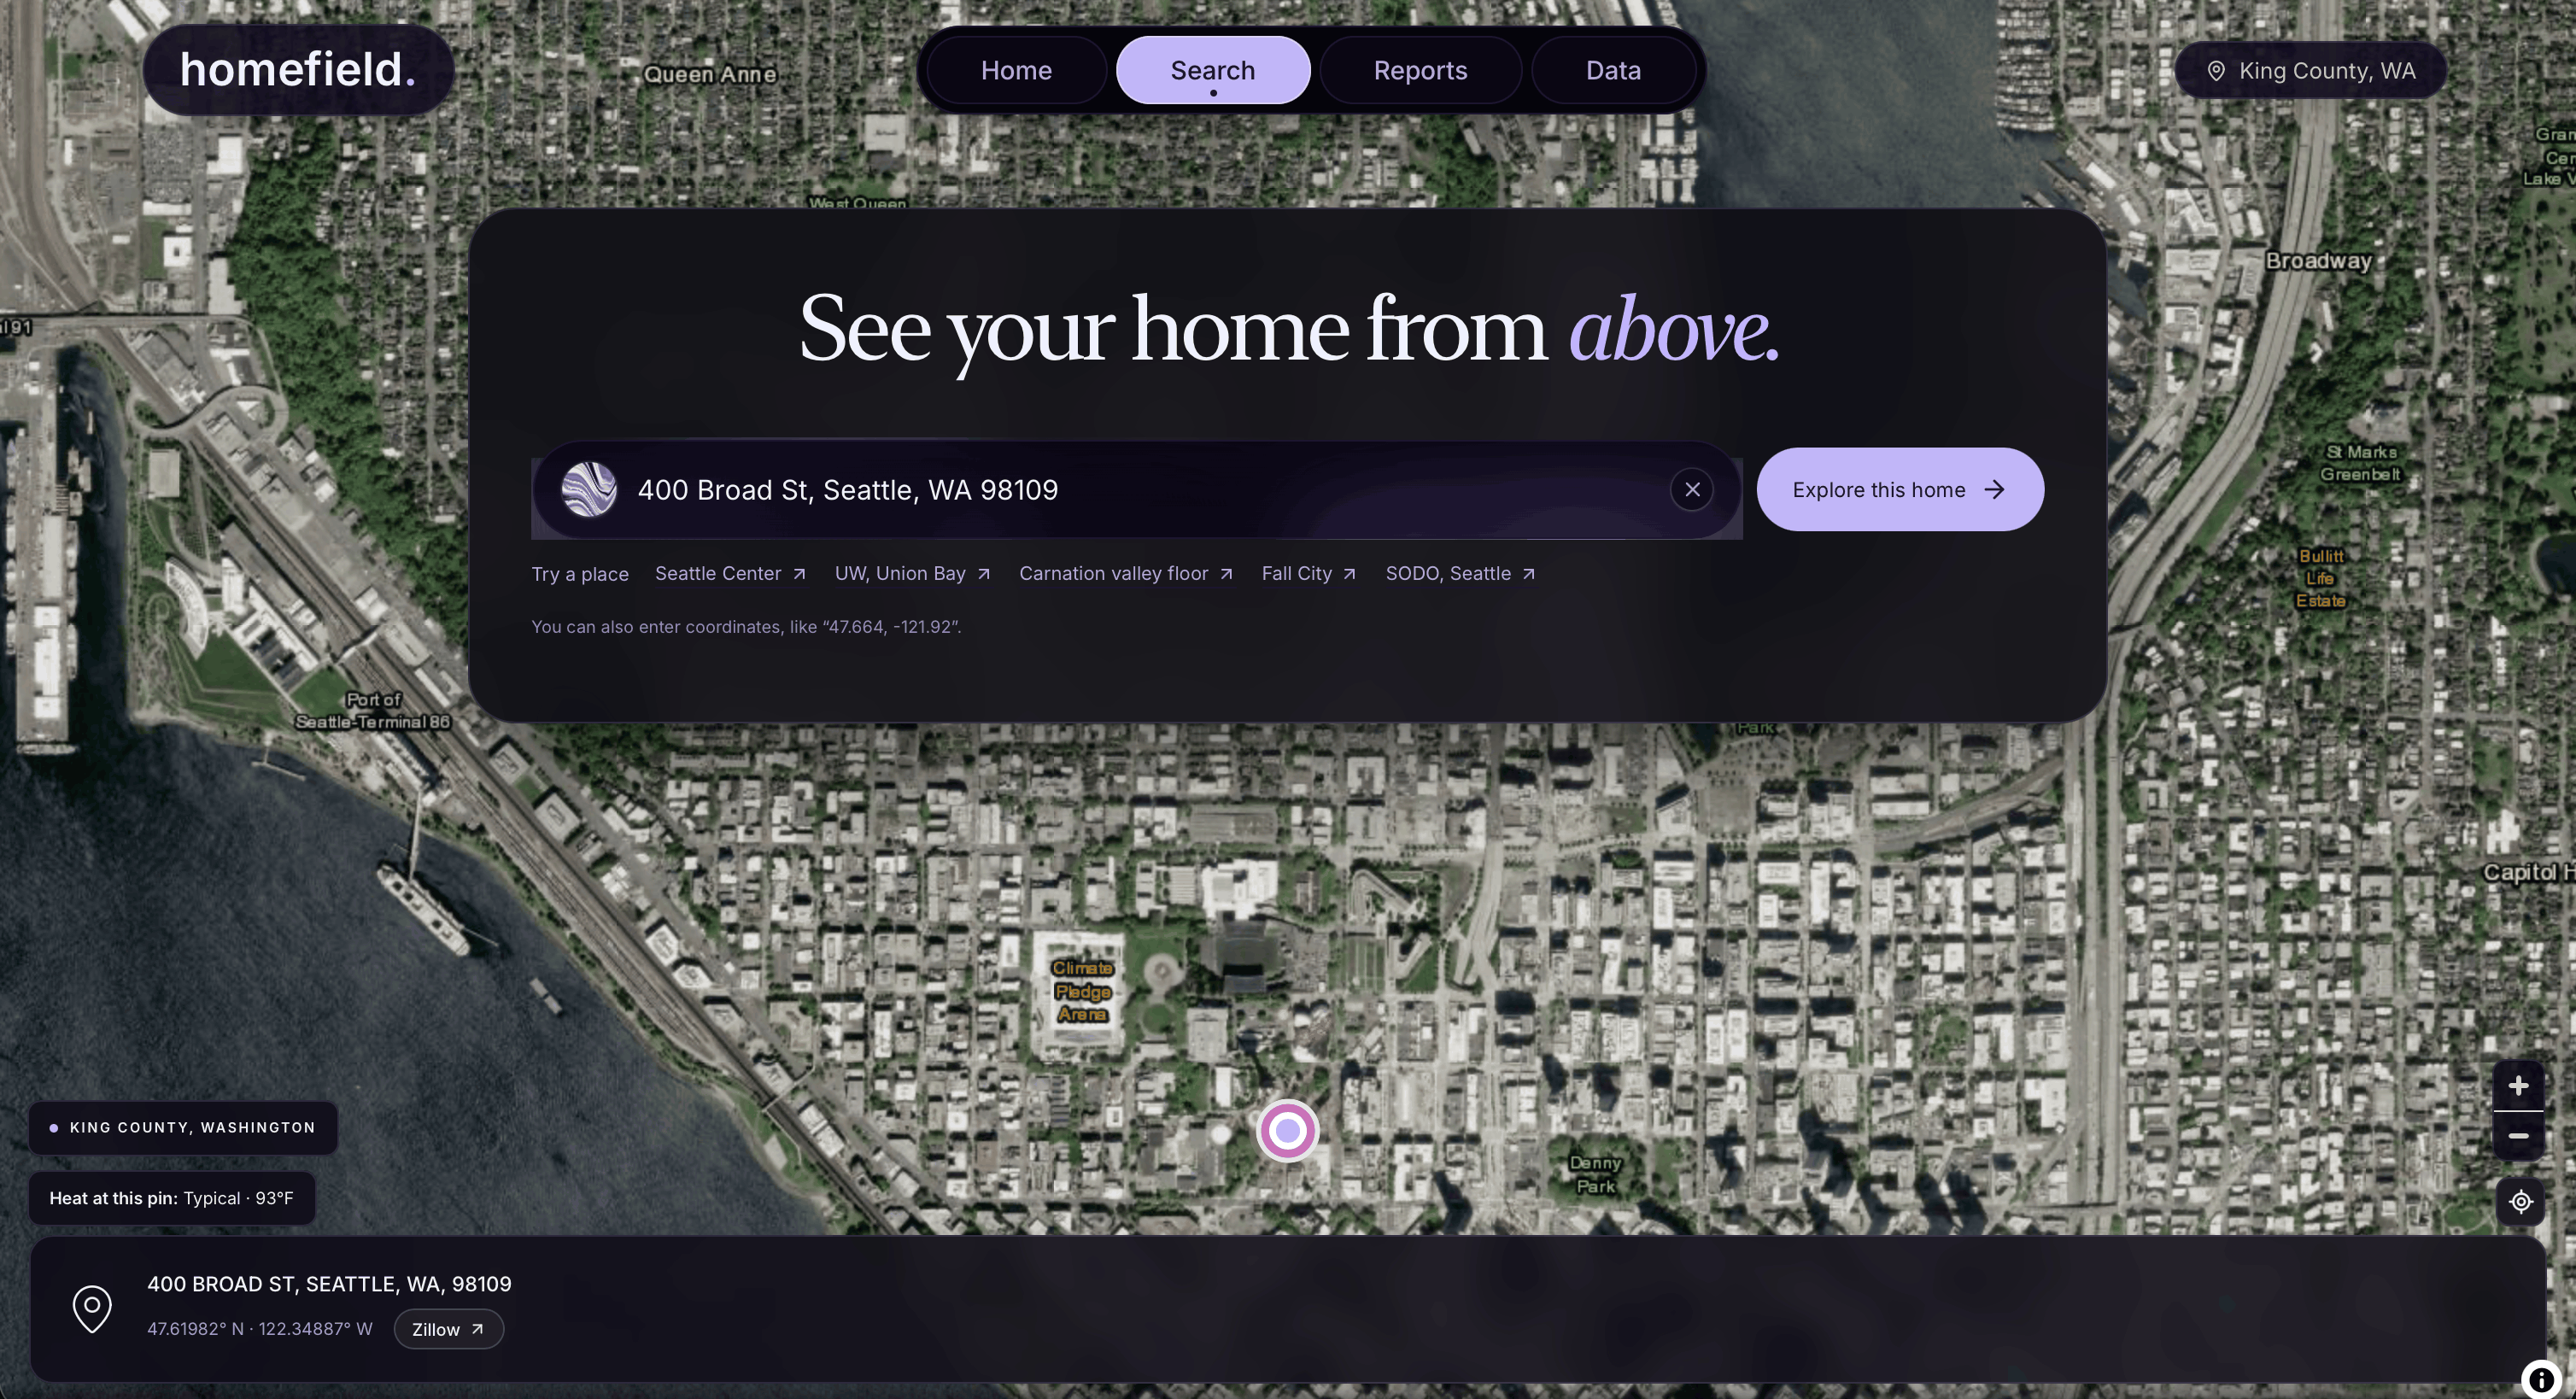
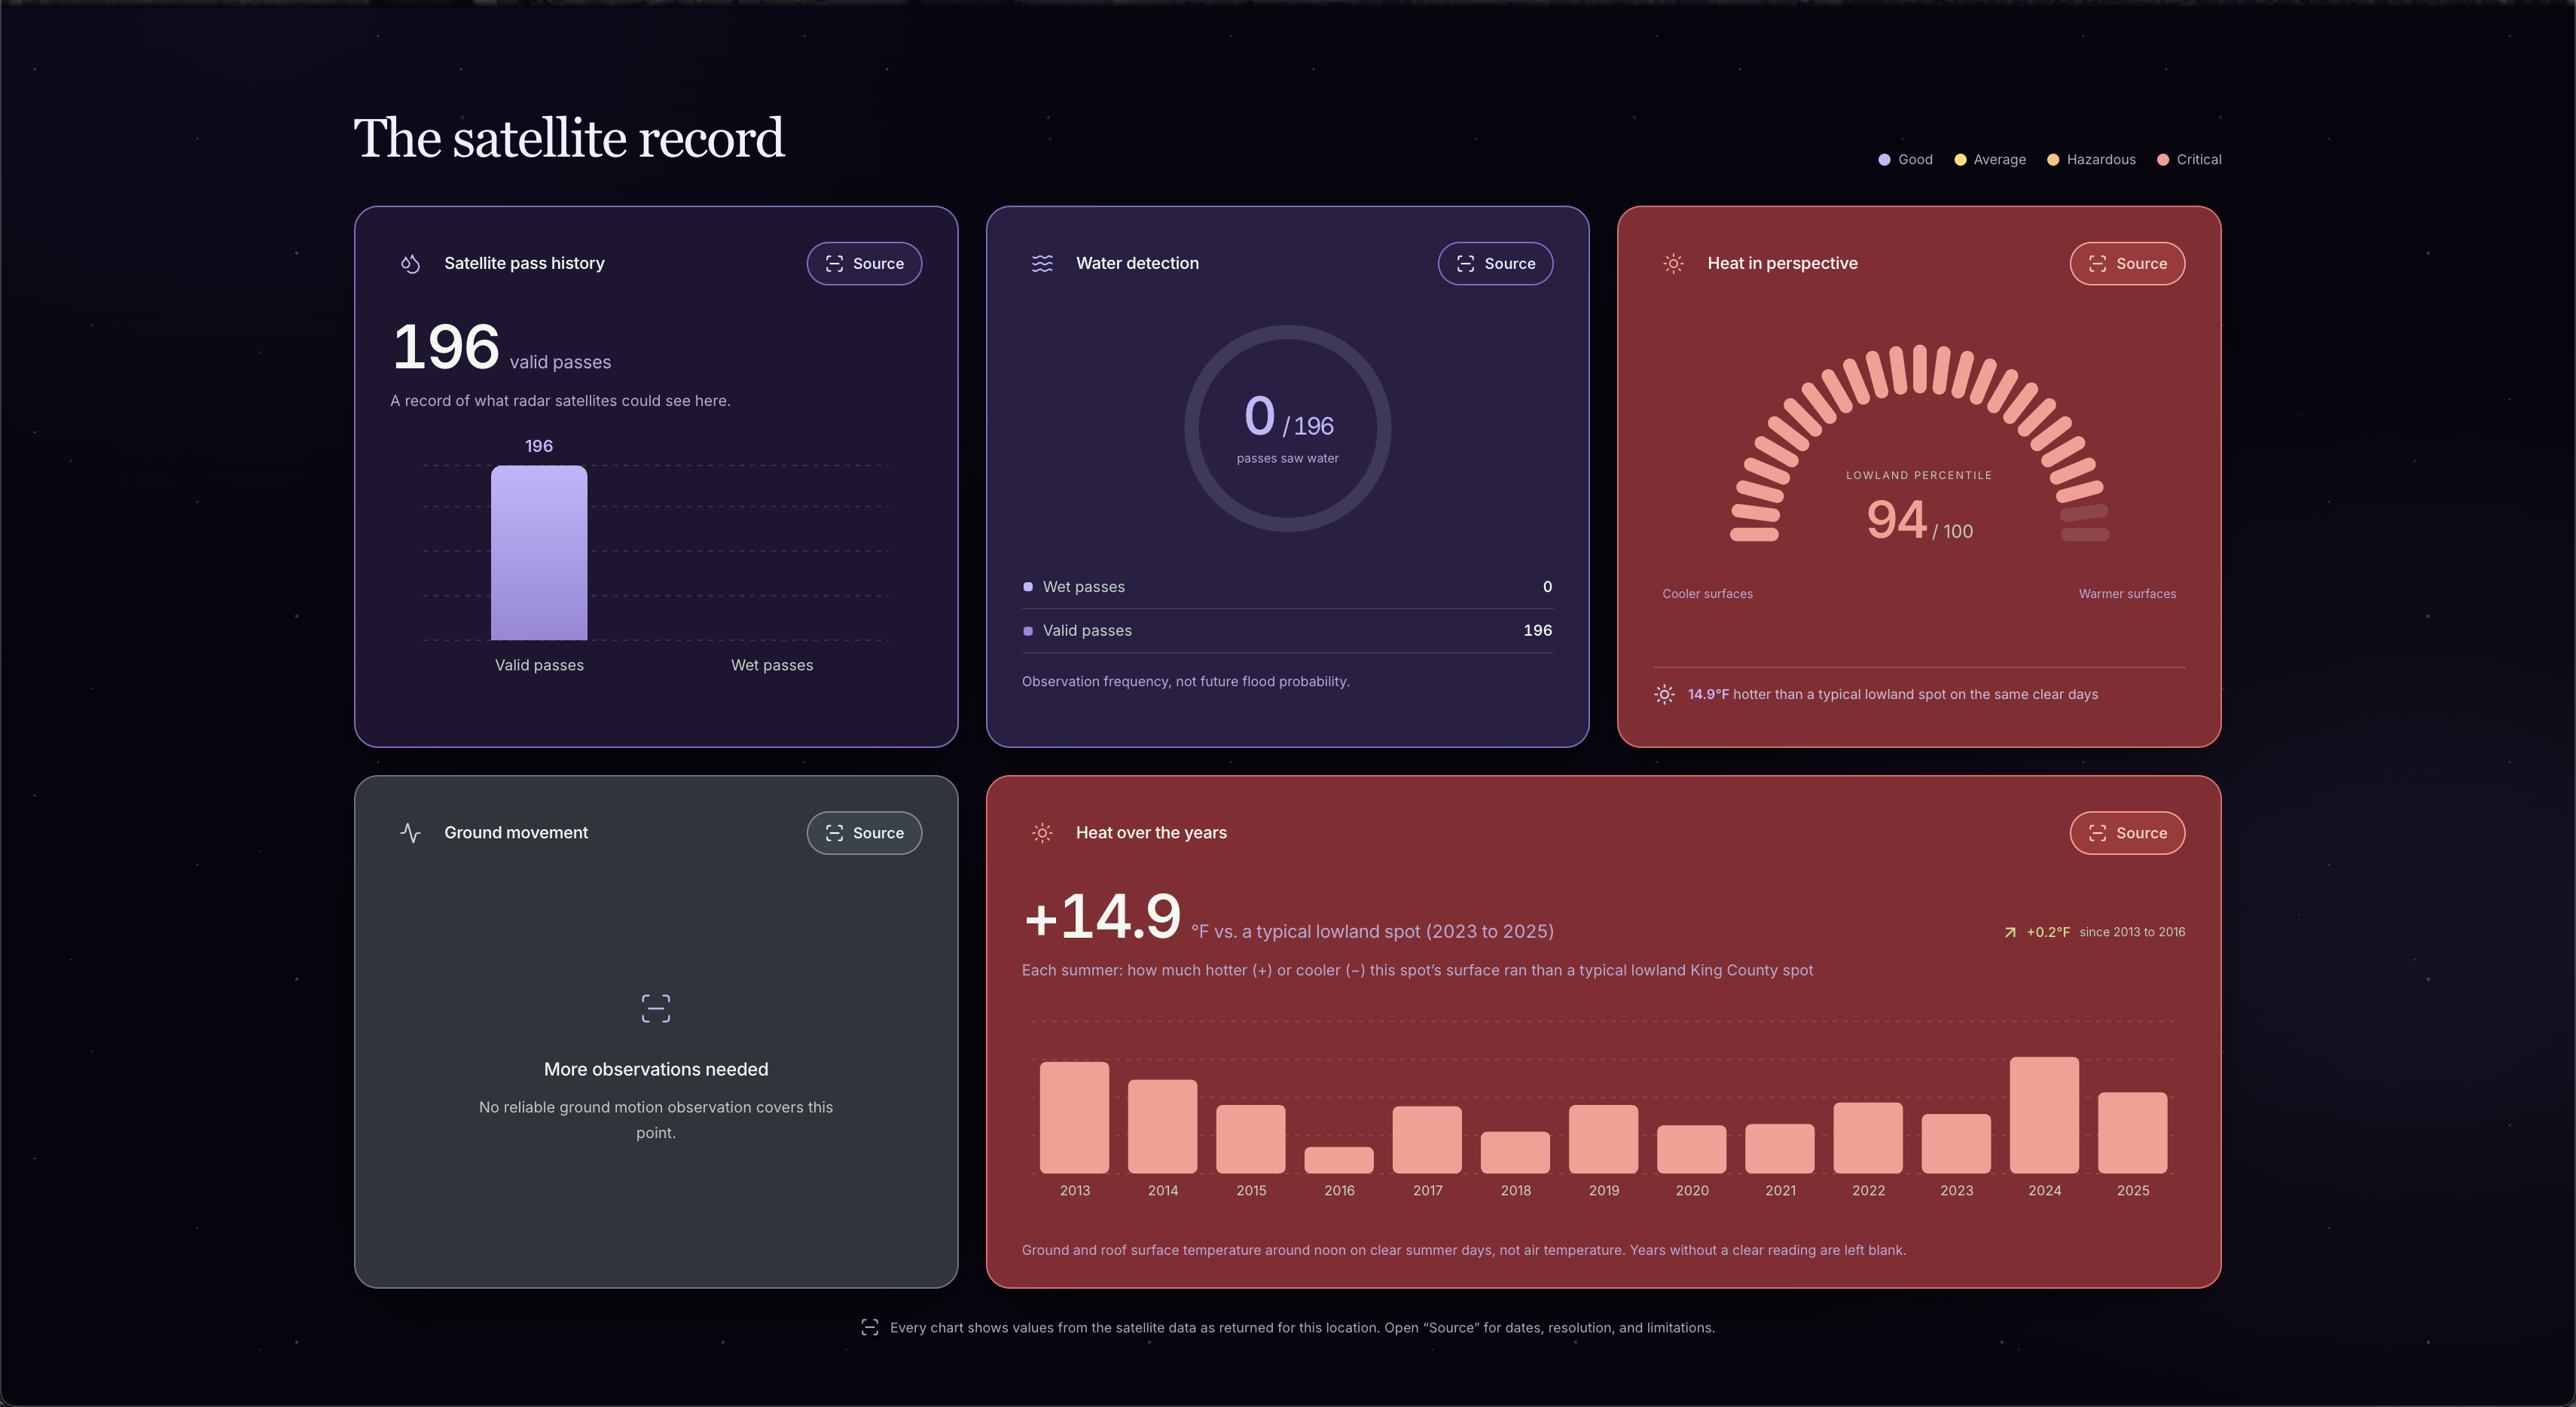
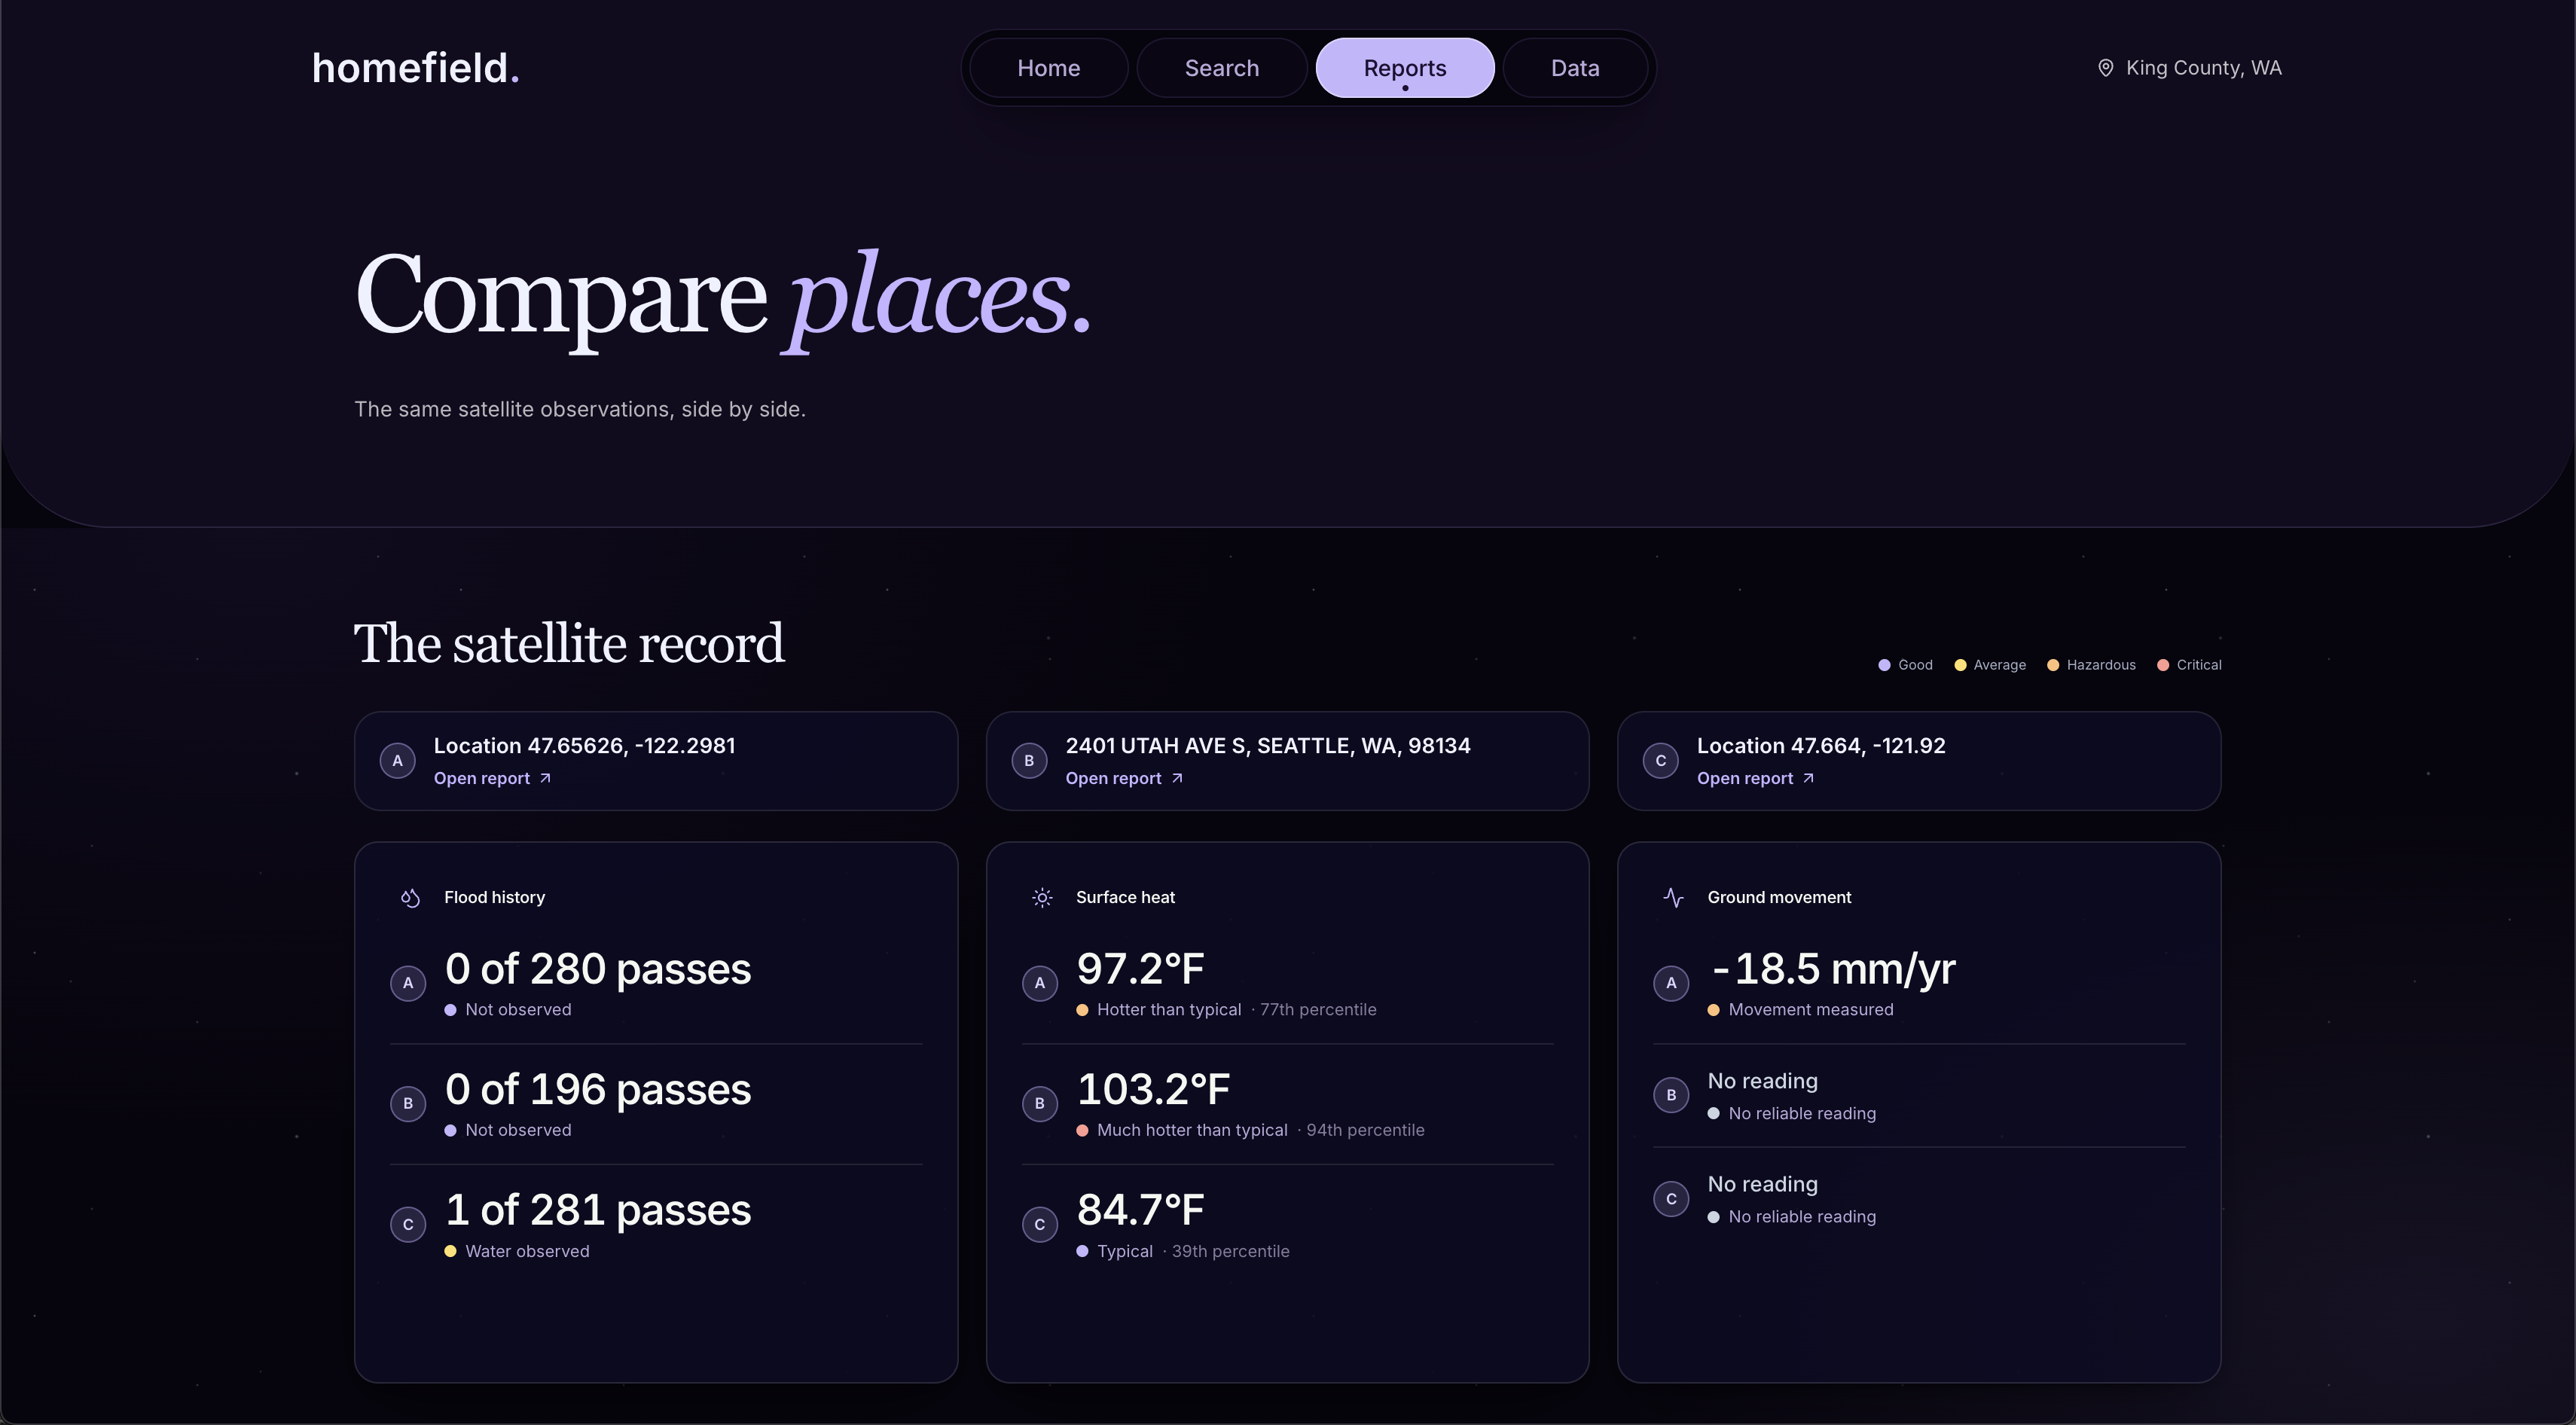
homefield reports three hazards for any King County address
- Flood history: how many times radar has checked that spot since September 2024, and whether it was ever underwater, including the December 2025 flood.
- Summer heat: how hot the ground and roofs get on clear summer days, how that compares with the rest of lowland King County, and whether the spot has gotten hotter since 2013.
- Ground motion: how much the ground has moved since 2016, in millimeters per year, measured along the satellite's line of sight.
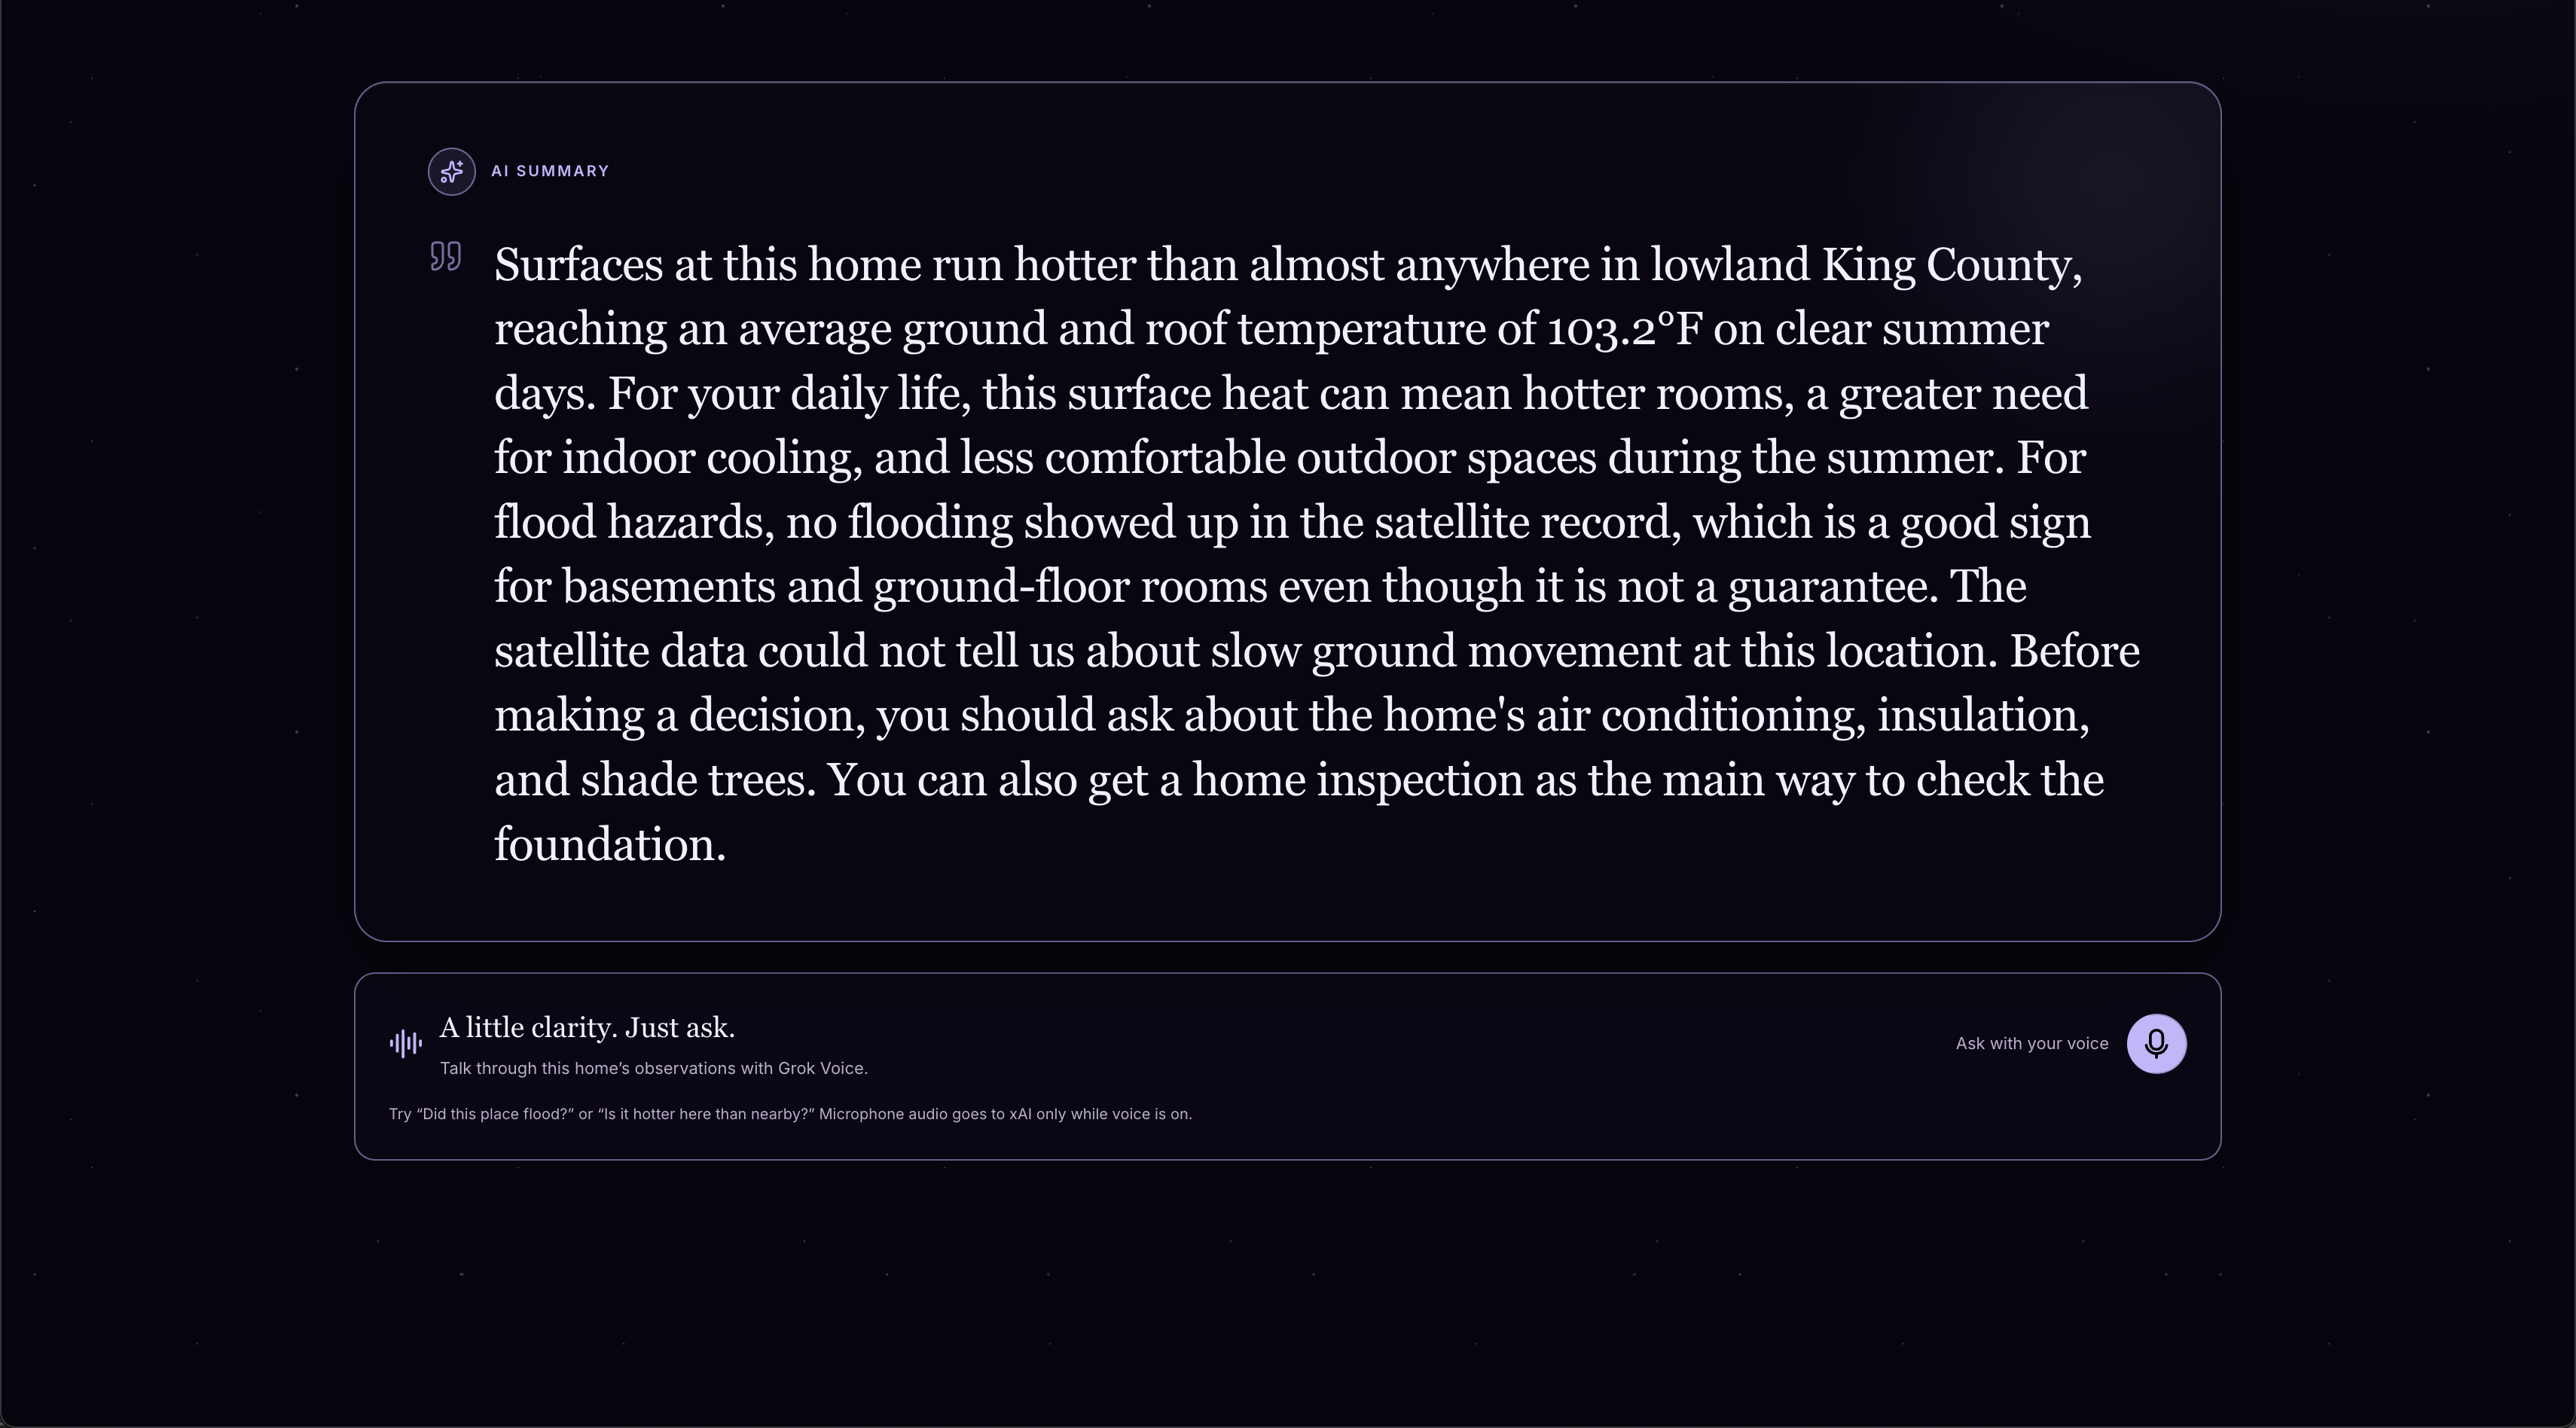
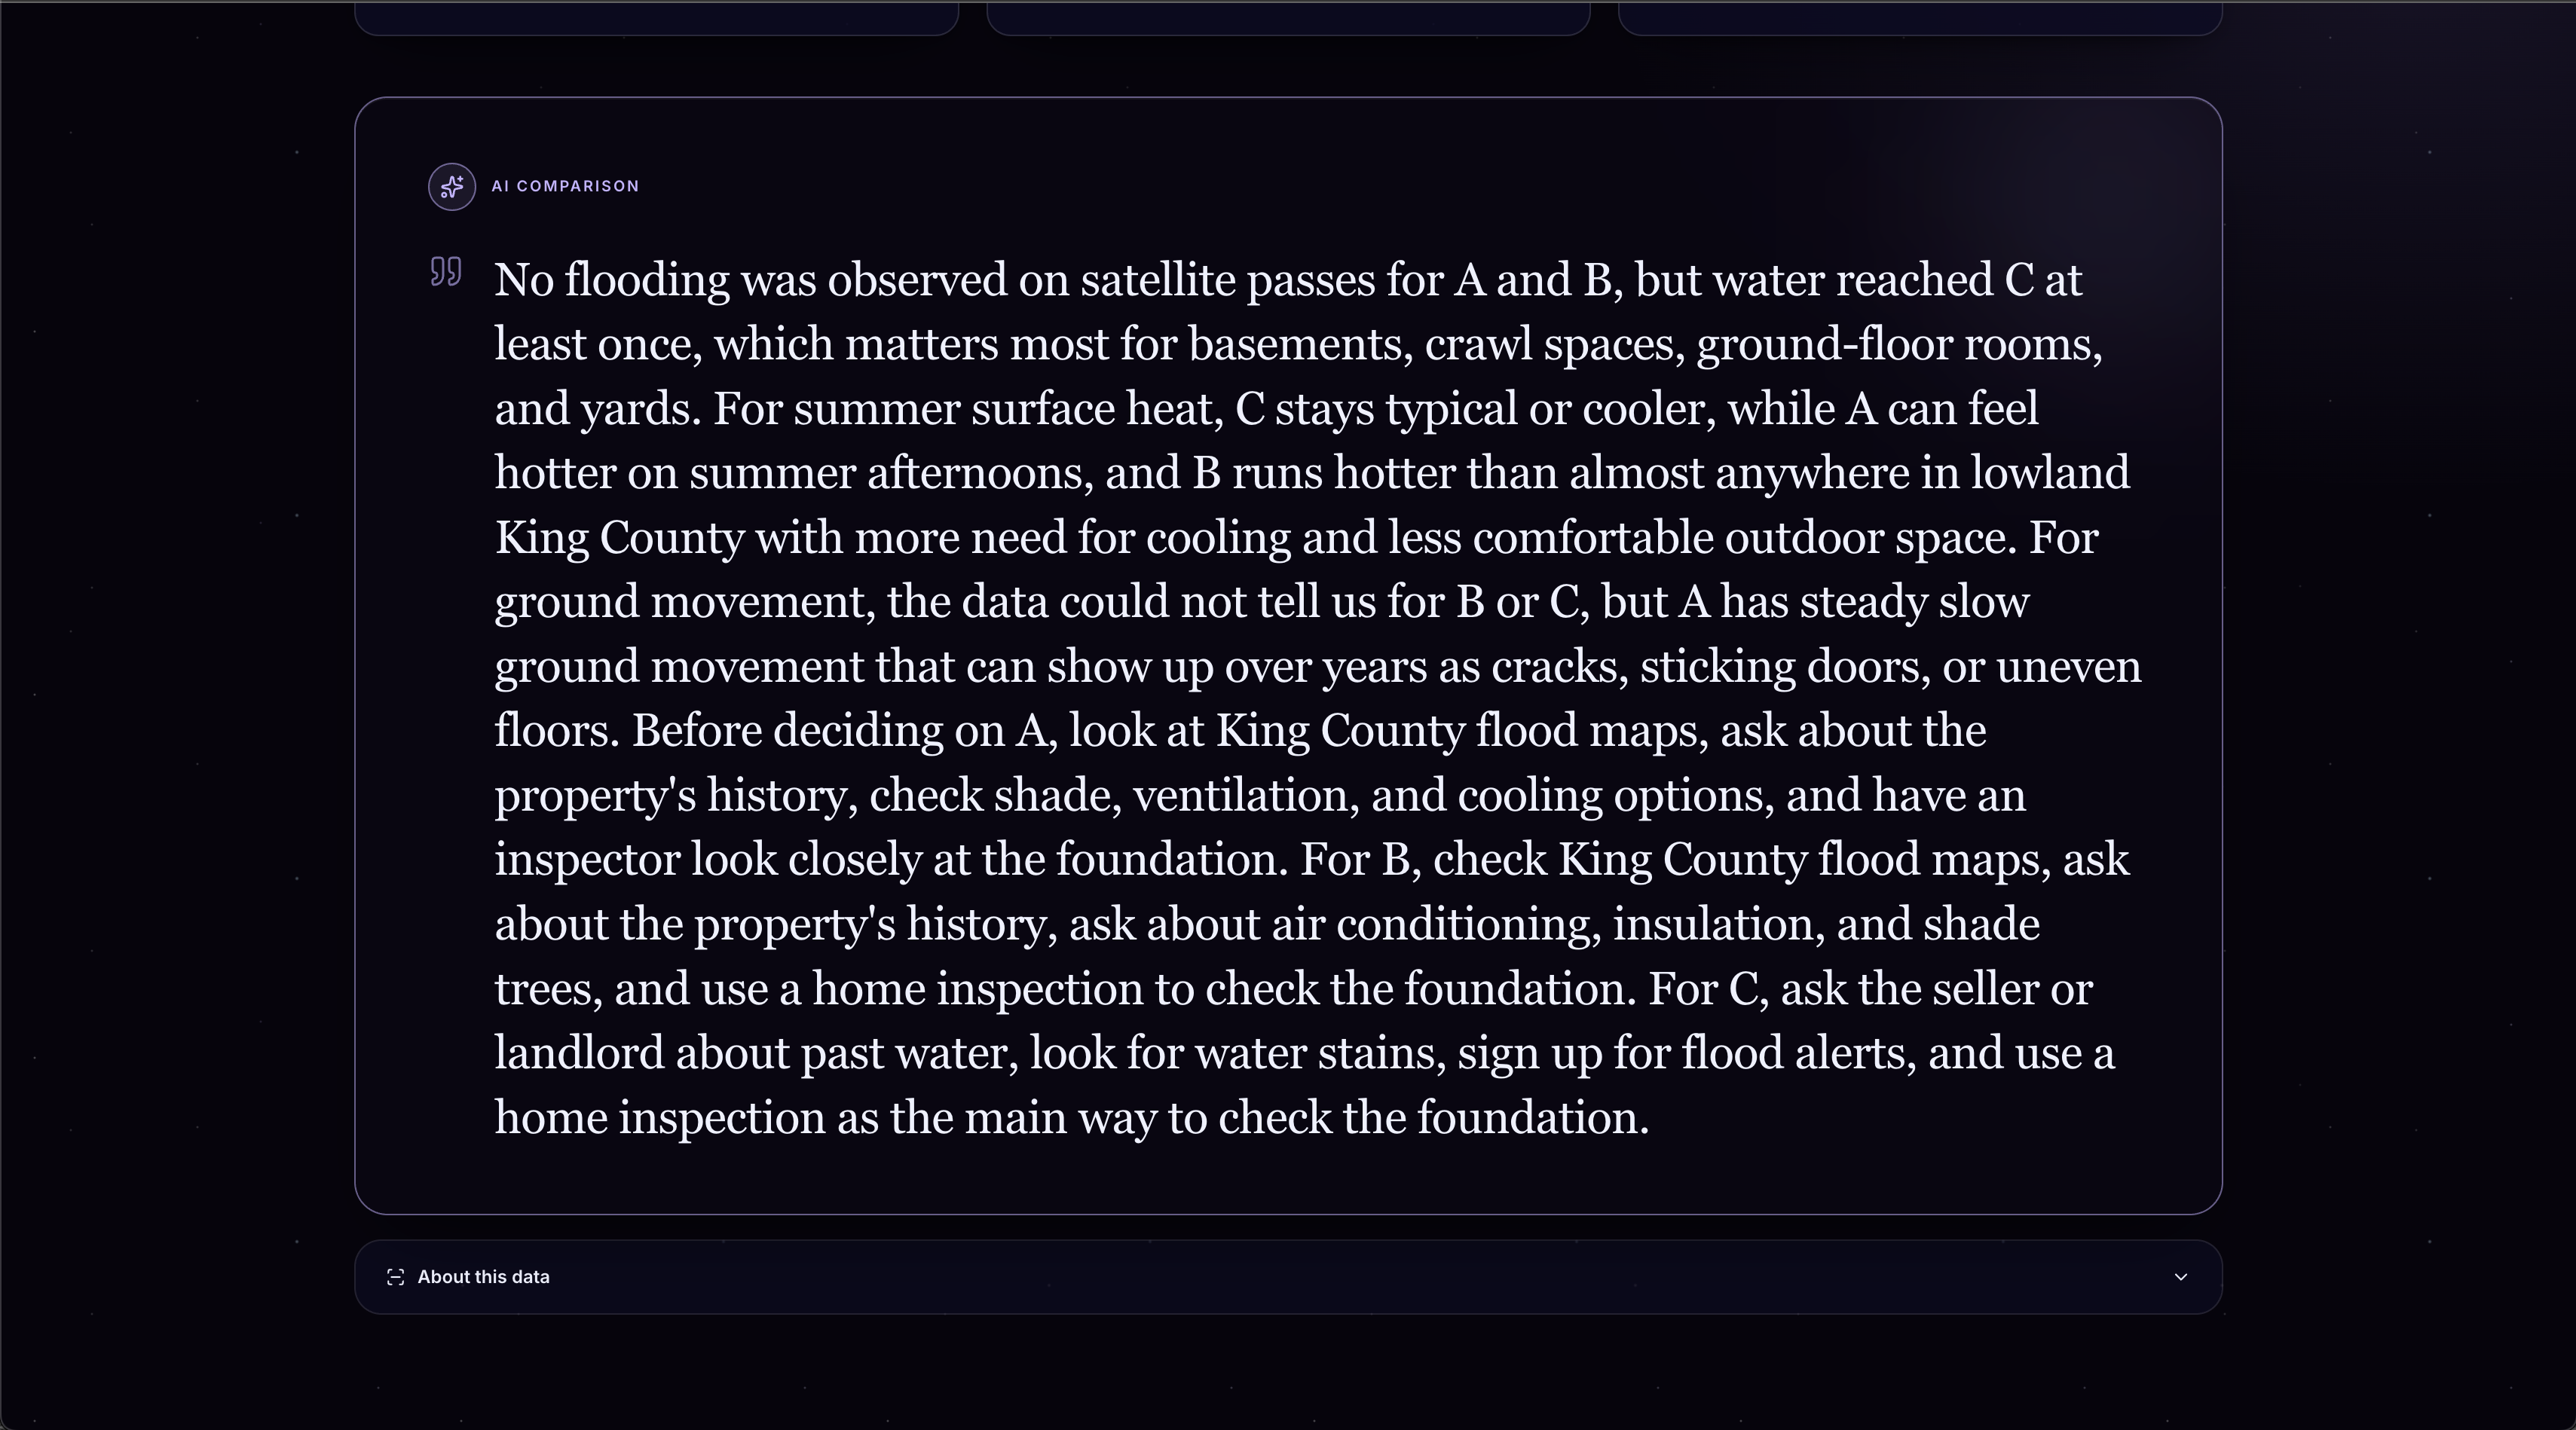
Gemini turns the results into a short plain-language summary with useful insights for buyers and renters, and with Grok Voice you can ask follow-up questions out loud ("Should I worry about my basement?"). Grok answers using context from that address's data.
How we built it
homefield has four main components, designed separately and fitted together at the end. We built all of them in Cursor, using its agent throughout: planning features, writing the FastAPI server and Next.js client, building the Chrome extension, profiling and fixing our page transitions, and generating the data page figures.
- Data pipelines: 1,158 Sentinel-1 radar water maps from NASA JPL's OPERA DSWx-S1 (September 2024 to October 2026), condensed into a flood history for every 30 m square; 45 clear Landsat 8/9 summer days (2013 to 2025), each compared to lowland King County on the same day so the weather cancels out; and nine years of OPERA DISP-S1 ground motion, chained from 8 of NASA's 119 files and read remotely instead of downloading 51 GB. Every layer is validated against known places. Full details are on our Data page.
- Server: a FastAPI backend that geocodes addresses, samples the prepared datasets, and returns a unified hazard report with sources and limitations attached. Used by both the web client and the Chrome extension.
- Web client: a Next.js app that presents reports through interactive maps, charts, side-by-side comparisons, Gemini-written summaries, and Grok Voice for spoken follow-up questions.
- Chrome extension: a browser side panel that reads the address from Zillow and Redfin listings and shows the matching homefield report.
Challenges we ran into
- 51 GB of ground motion data. NASA publishes ground motion as 119 files of about 450 MB each, which would have taken over 3 hours to read. Because each yearly batch starts where the last one ended, we chained just 8 files and read only our window of each, bringing it down to about 5 minutes.
- Designing around blind spots. Radar can't read under dense trees or between high-rises, and the December 10 pass came about 10 hours before the river crested. We made homefield say "no reliable reading here" instead of ever implying "safe."
Accomplishments that we're proud of
We're proud of transforming large, complex satellite datasets into clear, address-level hazard reports that load quickly and are easy to understand. We're also proud of combining results into immersive experiences through our web client and Chrome extension.
What we learned
We learned how to process and validate large geospatial datasets, efficiently sample raster data, and design an API around imperfect or missing observations. We also learned about the process of building chrome extensions and designing apps based around large sets of data.
What's next for homefield
- Wider and fresher coverage: extend ground motion to south King County, rerun the pipelines on a schedule so new floods appear within days, and expand to other counties. This is simple as the same method works anywhere NASA's data reaches.
- More context: show FEMA's modeled flood zones next to what satellites actually observed, so people can see where the two disagree.
- Startup model: Individuals wouldn't pay. We can find revenue in organizations that need hazard history in bulk, like listing sites that embed the report and cities and counties that use it for planning and outreach.
- Distribution: the Chrome extension puts a clickable homefield button on Zillow and Redfin listings, where users can save a shareable report and send it to roommates and family.


Log in or sign up for Devpost to join the conversation.