-
-
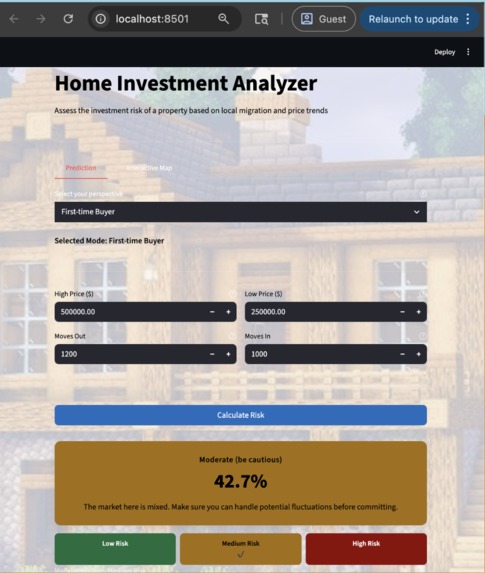
This displays the data analyzer for the risk of a particular house in OC
-

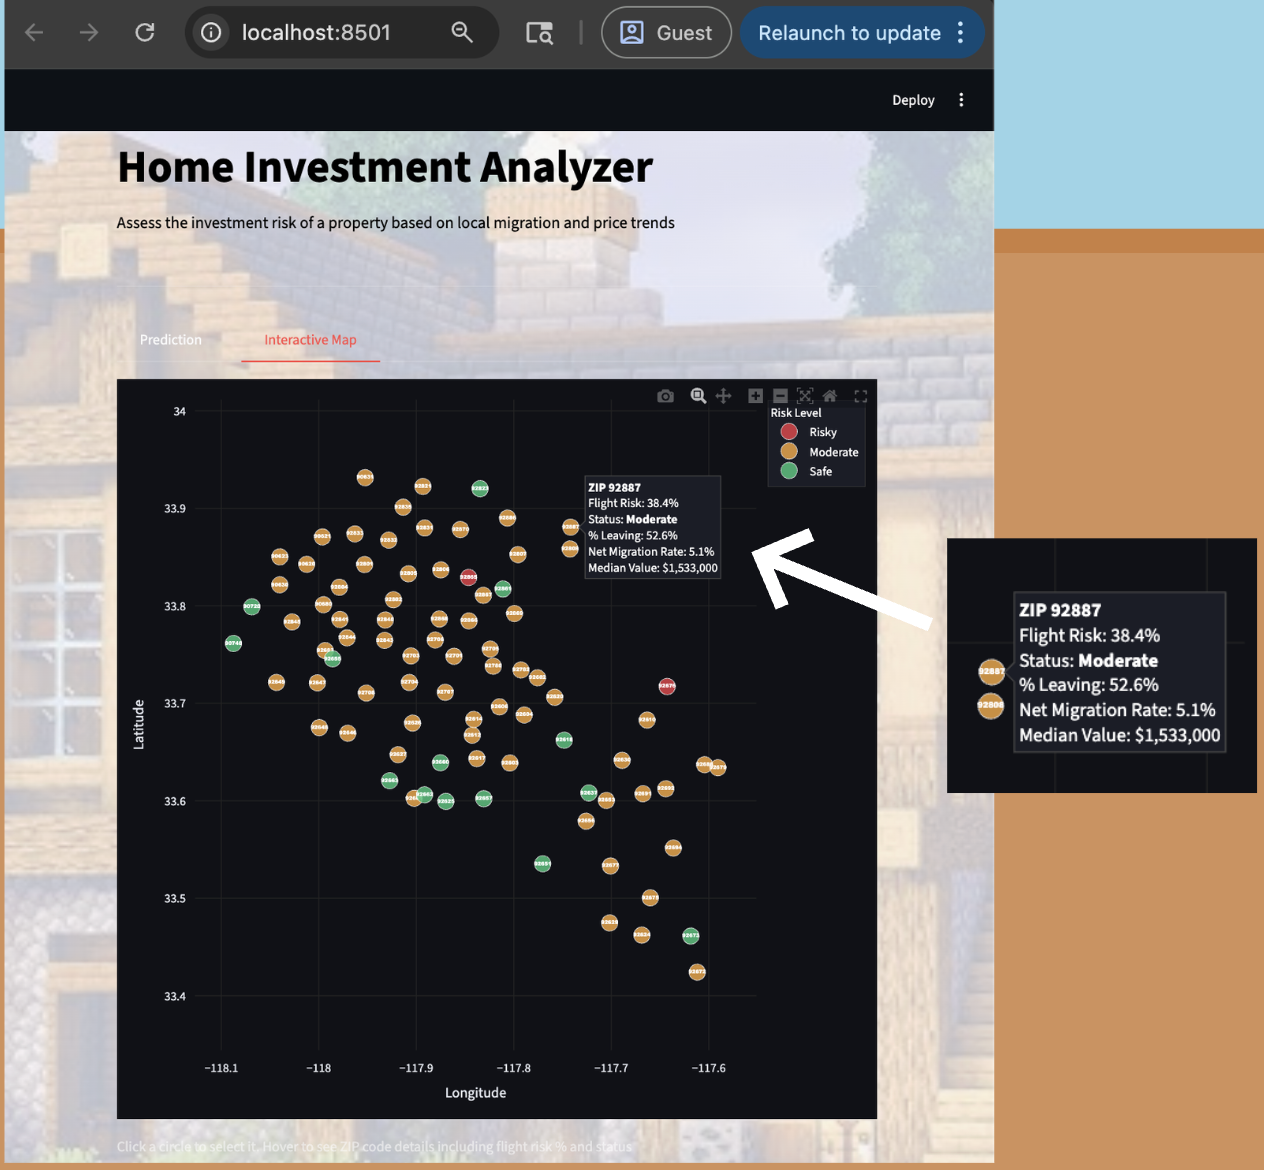
We have a interactive map which displays migration data for a particular data
-

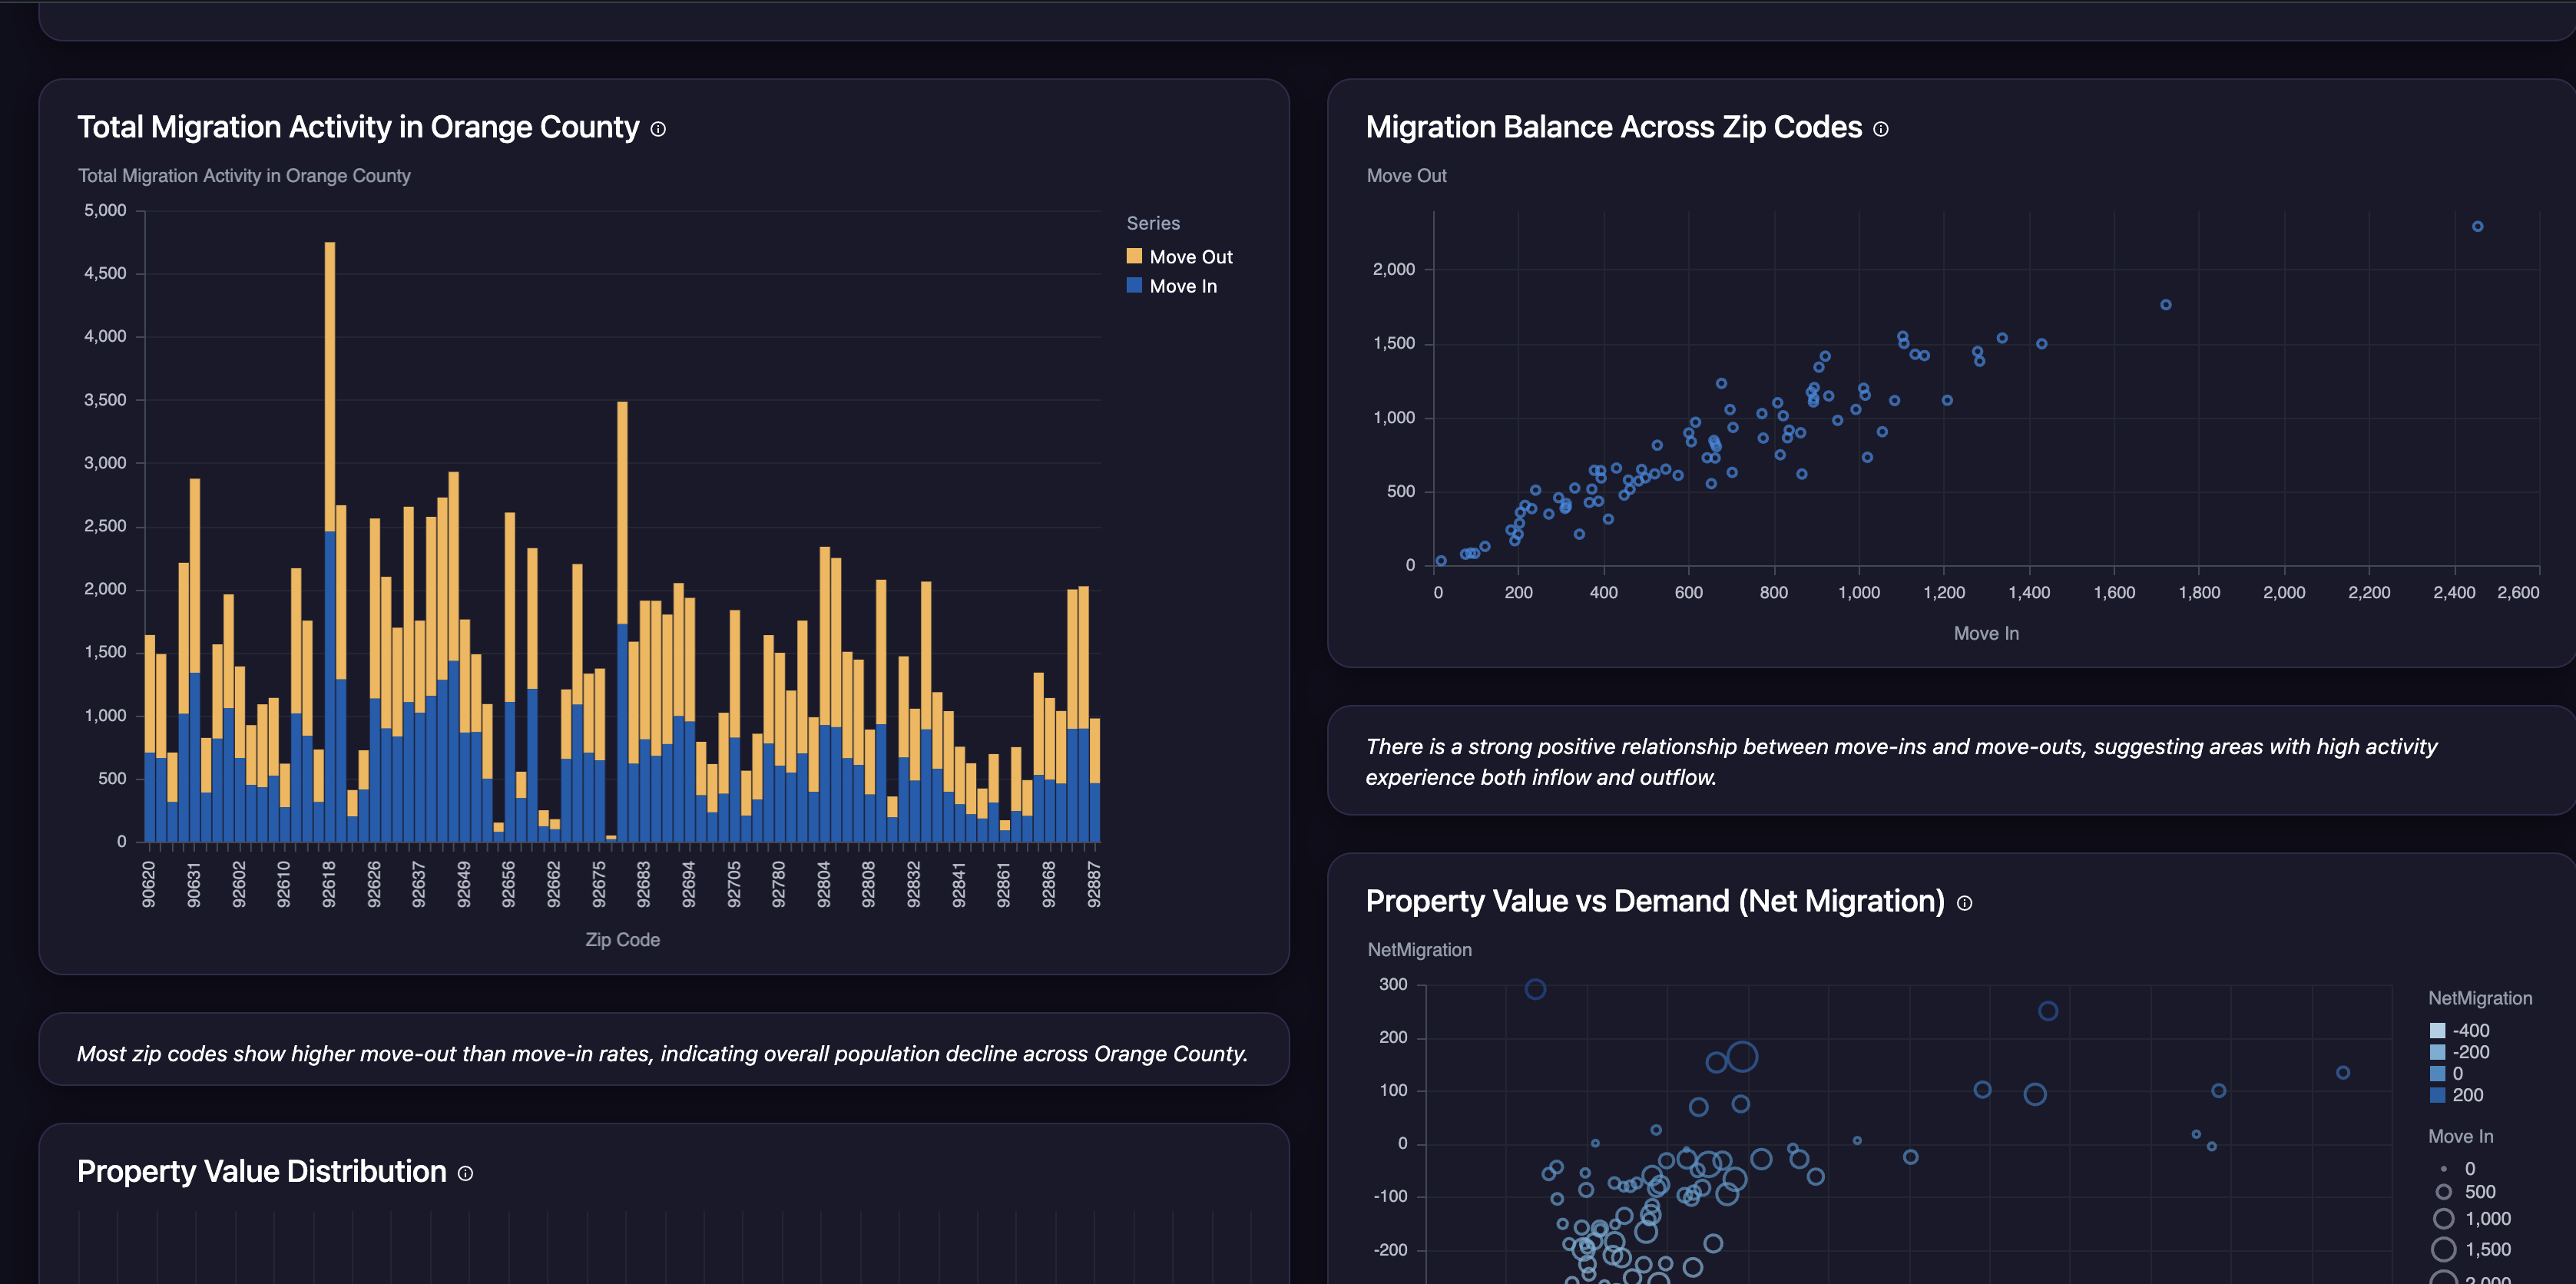
This represents the OMNI dashboard for the data visualization
-

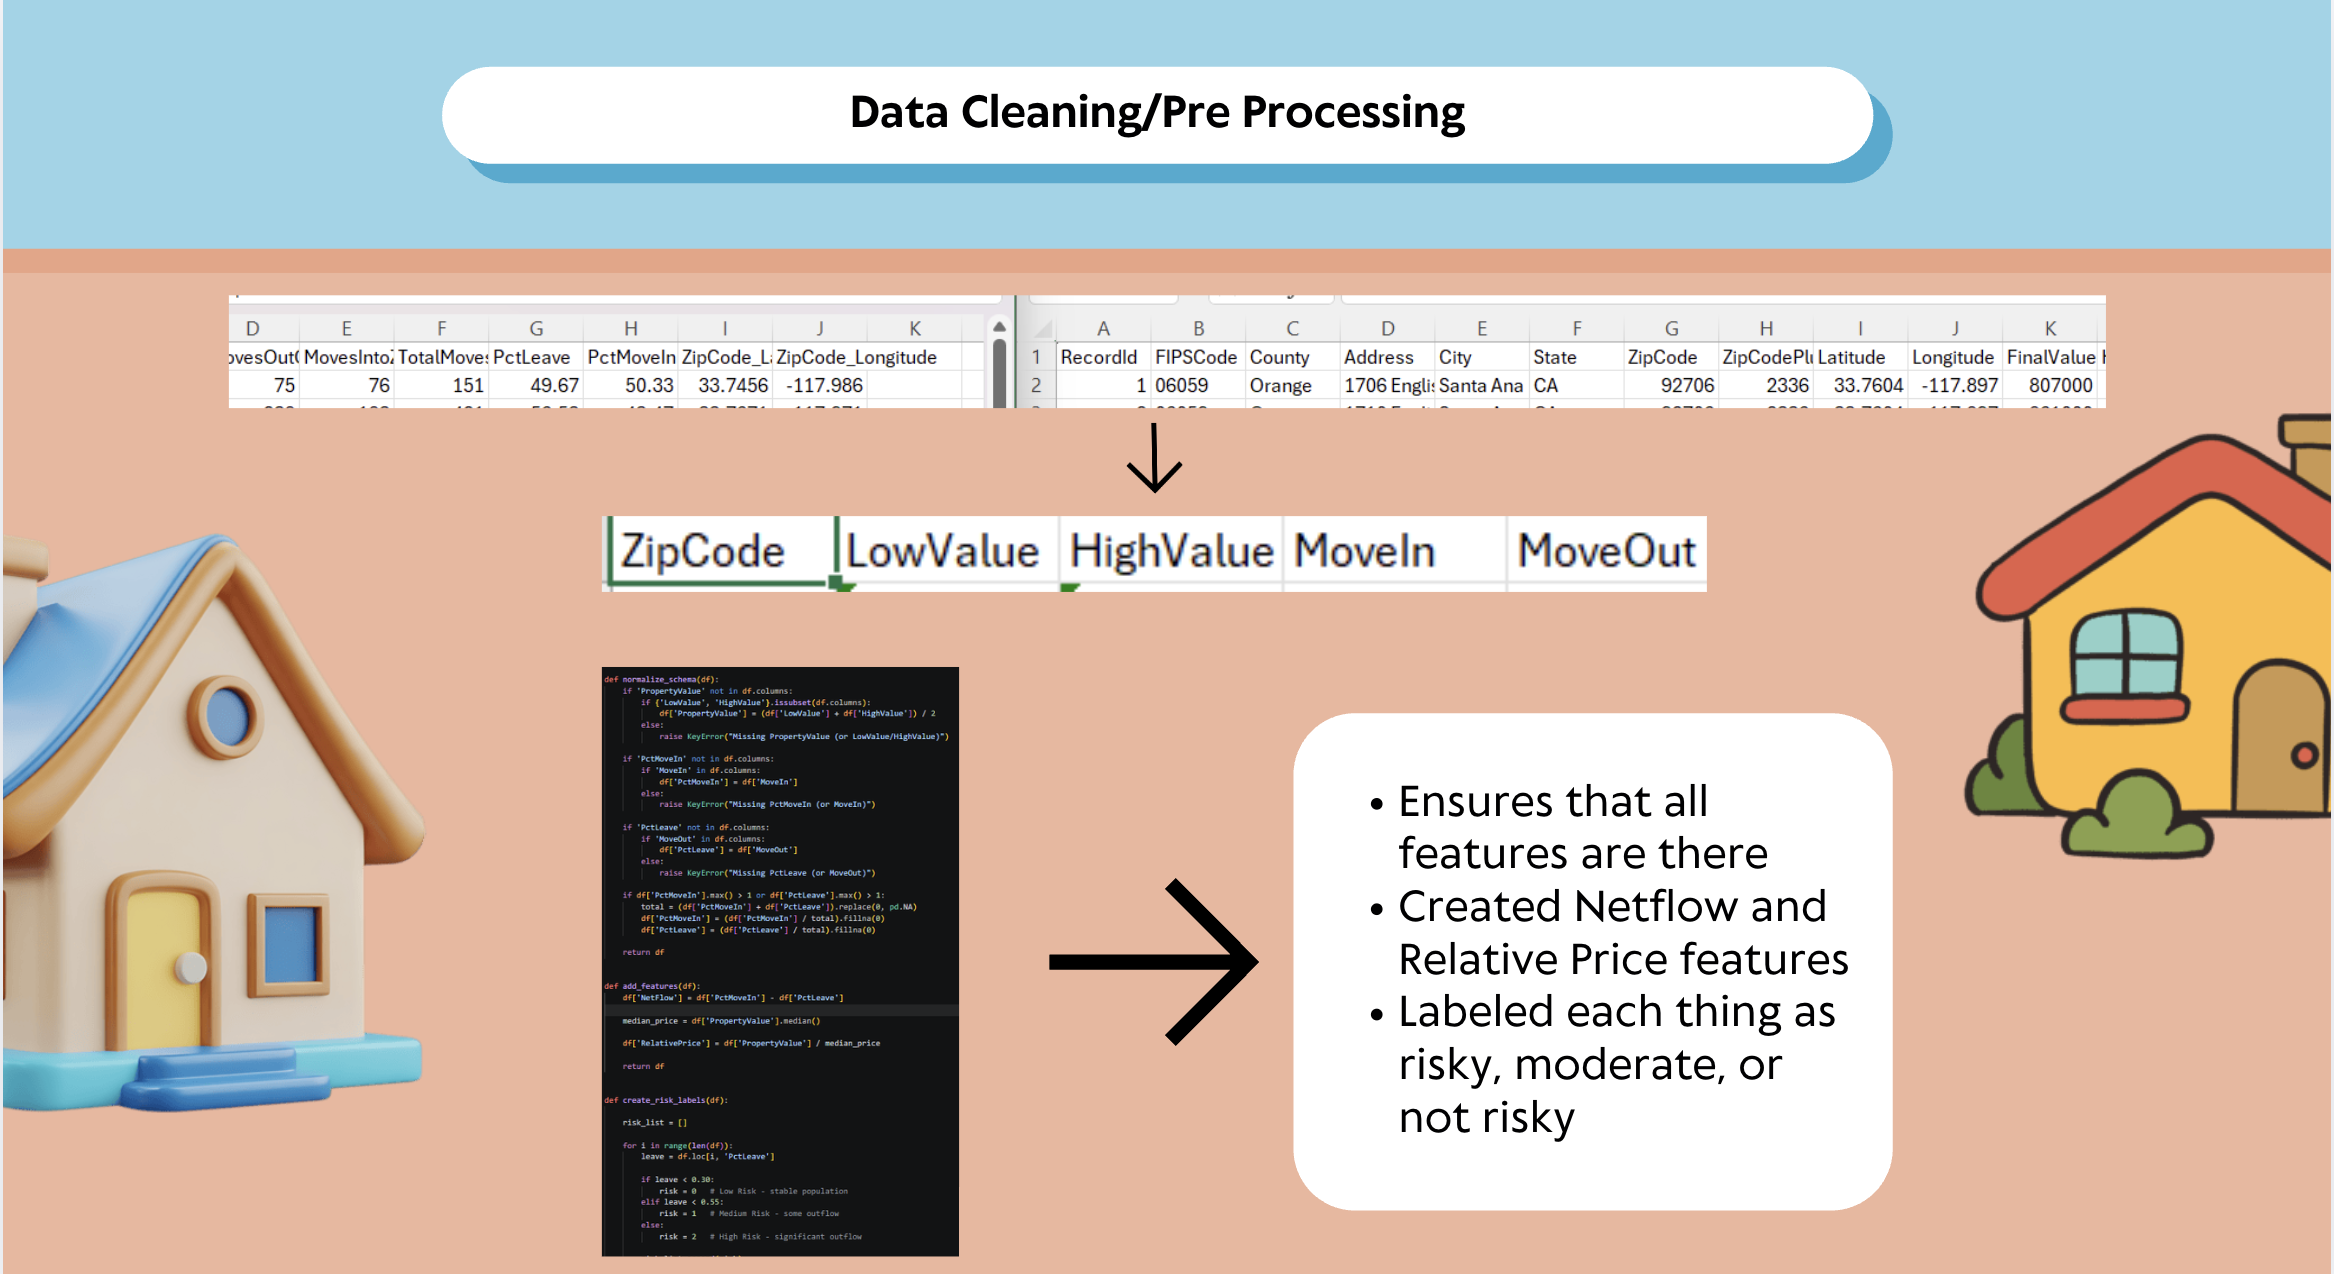
We cleaned and merged datasets, engineered key features like net flow and relative price, and labeled areas by displacement risk.

View
Our dashboard screenshot: https://drive.google.com/file/d/15QcaEgcqLXm3tix-V95goNal7Y0blGUF/view?usp=sharing
Our presentation slides: https://canva.link/1okweac2yh166pc
Inspiration
We were inspired by the growing issue of housing instability and displacement in many communities. Specifically from the Bay Area, where we are from, we have noticed exponential rises in housing prices, leading to more and more people being unable to afford living there. We wanted to explore this issue in a place where we now call home as well, Orange County. Rising property values and frequent population movement make it difficult for people to find stable housing. Hence, we were inspired to research how data could be used not just to understand these trends, but to predict and potentially prevent displacement before it happens.
What it does
Our project analyzes property values alongside migration patterns, such as move-in and move-out rates, to generate a housing risk score. By creating a predictive AI tool that is based on both housing costs and migrations, we are able to inform users of how much at risk the house they are thinking of is at. Then, we recommend them to move forward in a particular way, depending on whether they are a first-time buyer, city council member, or investor.
How we built it
We used Melissa datasets on Property Prices and Migration Data, then cleaned, sorted, and merged them based on overlapping locations. We developed a predictive model that calculates a displacement risk percentage using key variables. Finally, we created an interactive dashboard using Omni to visualize trends and make the data accessible and easy to interpret.
Challenges we ran into
One of our main challenges was working with inconsistent datasets, especially aligning locations and formats. It was difficult to sort through the numerous rows of data in the Property Values dataset to find out which rows aligned with the Migration Data dataset. We also had to make sure that our models were clear and easy to understand for the general public, while still making sure that they remained meaningful. Another difficulty was the time constraints, as we were required to prioritize key features and simplify parts of our implementation.
Accomplishments that we're proud of
We are proud of creating a project that has a real societal impact, as the housing crisis not only impacts people across Orange County, but also in America and the rest of the world. On a more technical note, we are also proud of building a functional model that goes beyond basic analysis by identifying patterns of instability. Our dashboard effectively communicates data in a clear and engaging way.
What we learned
Through this project, we learned how to work with real-world data, including cleaning, merging, and analyzing datasets that were available on Melissa for Education. We also gained experience in building predictive models and designing visualizations that clearly communicate insights to users through using Omni. Finally, we gained time management skills, which allowed us to maximize the limited time that we had.
What's next for Home Investment Analyzer
In the future, we hope to improve our model by adding data from other datasets, such as ones that include information on income levels or environmental risks. We also plan to enhance the dashboard with more interactivity and potentially integrate real-time data to make our predictions even more accurate and impactful. We would also like to increase the features available to our users through the website.

Log in or sign up for Devpost to join the conversation.