Inspiration
In today's digital age, social media has become a massive part of our lives. While it offers numerous benefits, it can also lead to a loss in productivity. Inspired by the growing concern over digital distraction and its impact on productivity, our team set out to create a tool that can quantify productivity loss based on social media usage. We wanted to provide users with insights into how their social media habits might be affecting their work and overall productivity.
What it does
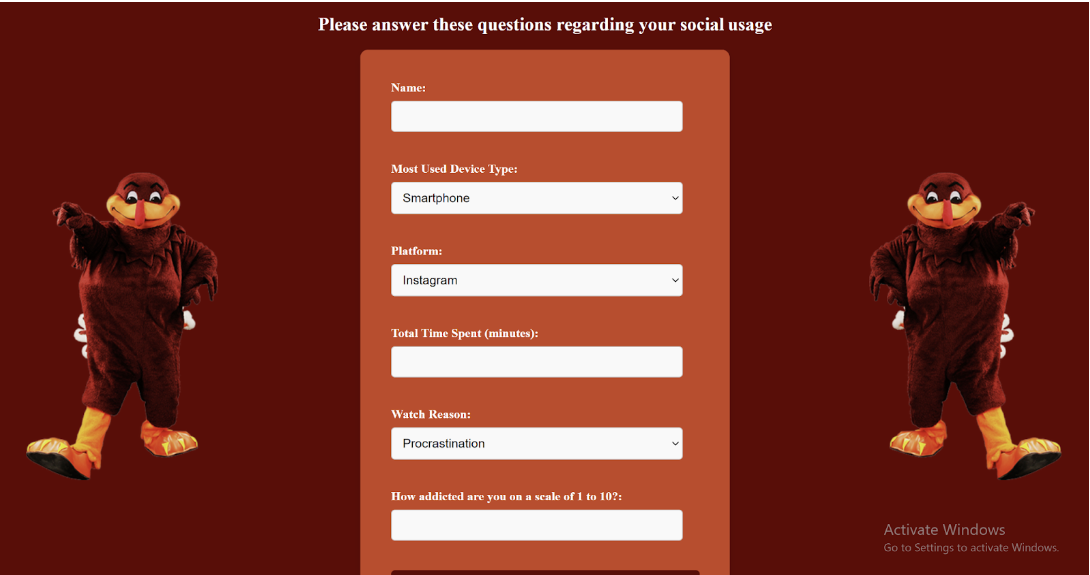
Our Productivity Loss Prediction Web Application helps users understand the impact of their social media usage on productivity. By collecting data through a survey -- which measures daily social media minutes, platform used, addiction level, and reasons for usage -- the app uses a logistic regression model to predict potential productivity loss. Users receive a message directly after submitting the survey informing them of their results.
How we built it
The logistic regression model was built in Python using sci-kit learn and pandas for data processing. The actual dataset was taken from Kaggle(https://www.kaggle.com/datasets/zeesolver/dark-web?resource=download) and contained various features relating to social media usage and productivity. Flask, a python library, was employed to link the model to the front-end survey. HTML and CSS were used to design the survey and results page.
Challenges we ran into
We attempted to use GitHub as we knew that people use it for collaborative projects. However, we ran into some issues and decided to stop using it. We were not very experienced in logistic regression. We struggled with the data processing aspect and making sure the dimensions of the dataframe were correct. Transmitting the survey results to the model and back to the front-end was also somewhat difficult and took us some time to figure out.
Accomplishments that we're proud of
We managed to achieve an 87.5% accuracy on the training dataset after tinkering with what features to use and how to process the data(one hot encoding, standardization). We were also proud of linking the back-end model to the front-end webpage and achieve a "full-stack" application, as none of us had done that on our own before.
What we learned
We learned how to preprocess data, transfer information between the front-end and back-end with Flask, and work on a programming project in a team.
What's next for Hokie Productivity Insight
We would like to improve the model, finetuning it to achieve a higher accuracy. We would also like to spice up the webpages and offer more insight on the final results page. This insight would relate to more personalized information about the user's survey results and tips to increase productivity.

Log in or sign up for Devpost to join the conversation.