Hi, my name is Rustom Ichhaporia! Welcome to my submission for HackIllinois 2022: Hofstede's Globe.
Inspiration
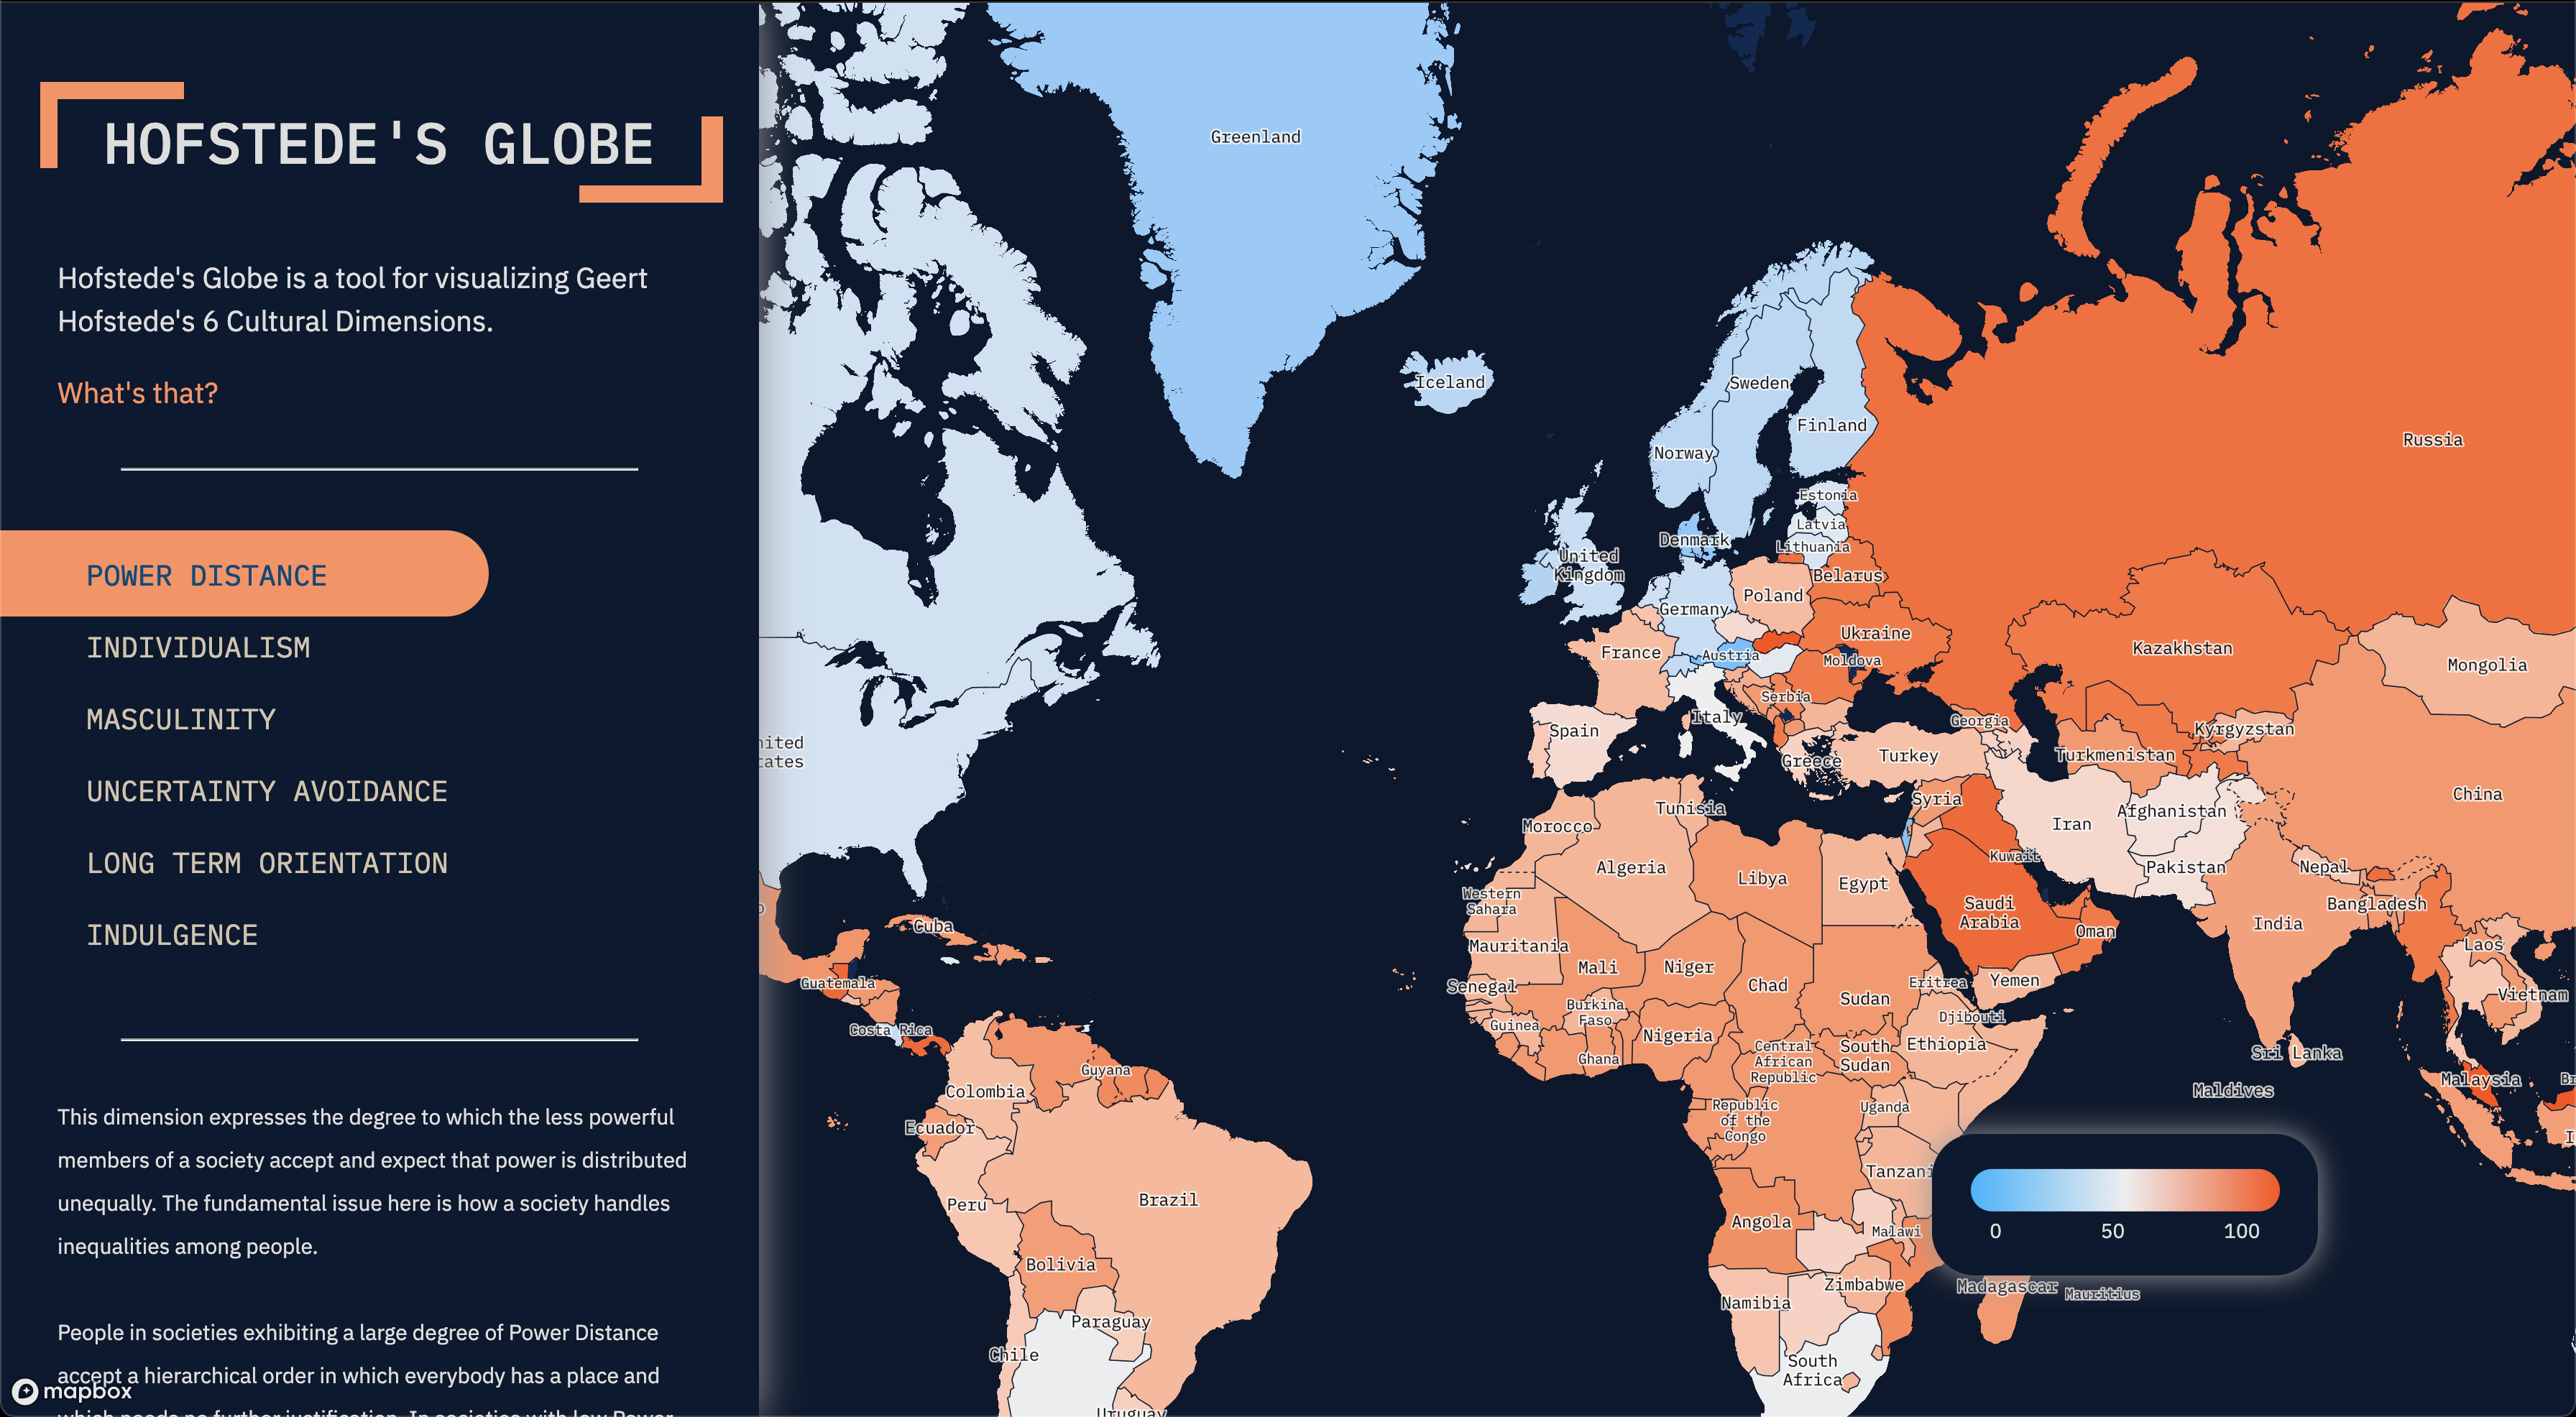
Hofstede's Globe is a tool for visualizing Geert Hofstede's 6 Cultural Dimensions. Hofstede was a social scientist who studied how people from across the world communicate. He noticed trends in the way people from different cultures approached adversity, success, and relationships. I first learned about the dimensions through Malcolm Gladwell's 2008 book, Outliers, and was inspired to create a tool that could visualize these trends.
I was unable to find any resource online that allowed me to truly compare countries in all their dimensions next to each other, and I was curious as to how I perceive those around me through their communication styles, so I figured I would make it myself.
What it does
Hofstede's Globe provides an interactive heatmap visualization to explore each of Geert Hofstede's 6 cultural dimensions, as well as information about how each of the 6 dimensions applies to our world.
How we built it
This project was built with GatsbyJS and ReactJS for the front-end. Other than some preliminary data manipulation in Python, most of the code was written in Javascript. It is hosted on Github Pages. The data was handled by GatsbyJS's integration with GraphQL, which allows for instant runtime querying of static, self-hosted data. Some of the NPM packages used include:
styled-components: efficient CSS-in-JS stylingmapbox-GL: interactive, custom map components served through APIframer-motion: smooth, declarative animations compatible with ReactJSChromaJS: web color utilities- Google Fonts: self-hosted custom fonts
GitHub Student Developer Pack
I made use of the GitHub Student Developer Pack to create this project. I hosted the website on GitHub Pages, which allows for free and efficient static deployment straight from my GitHub repo. I also tried out a new text editor, Atom, and blackfire.io to profile my website's loading performance. I used GitHub Desktop to compare different versions of my code during branching, and Canva to create some of the animation palettes. Lastly, I made use of DeepSource to experiment with static analysis for my repo. All of these tools were made available to me thanks to the GitHub student developer pack.
Challenges we ran into
Along the way, I faced a variety of typical debugging issues that occur during the process of front-end development, including deployment stalls, DOM handler misunderstandings, API documentation ambiguities, and simple CSS mishaps. I was able to debug most of the issues through Googling. For the ones I was unable to fix in time, I managed to find sufficient workarounds so that my project progress was not stalled.
Accomplishments that we're proud of
I have never created a front-end project of this scope in one weekend, so I'm proud that I was able to learn how to use a variety of new hosting and ReactJS tools in such a short time frame.
What we learned
I learned a lot about front-end development, data visualization, and human-centered design through the construction of this project and subsequent coding and styling. Perhaps more importantly, I learned about the way in which I and other people around me interact with each other through Hofstede's dimensions, and how understanding the differences between cultural communication styles can allow us to communicate more effectively with people of different backgrounds rather than stereotype them.
What's next for Hofstede's Globe
After HackIllinois completes, I plan to add to Hofstede's Globe by incorporating accessibility features and adding additional information and plots to more directly compare two countries side-by-side.
Thanks for reading! Please reach out to me at rustom.dev with any questions.
Built With
- framer-motion
- gatsby
- github
- javascript
- mapbox
- python
- react
- styled-components


Log in or sign up for Devpost to join the conversation.