Inspiration
In India, groundwater is the primary source of drinking water for millions, yet heavy metal contamination often invisible and odorless leads to chronic health issues like organ damage and neurological disorders. While the Heavy Metal Pollution Index (HMPI) is a powerful tool for quantifying this risk, the current manual methods using complex spreadsheets are time-consuming and prone to human error. We were inspired to build a tool that bridges the gap between raw laboratory data and actionable public health insights, allowing researchers to focus on solutions rather than formulas.
What it does
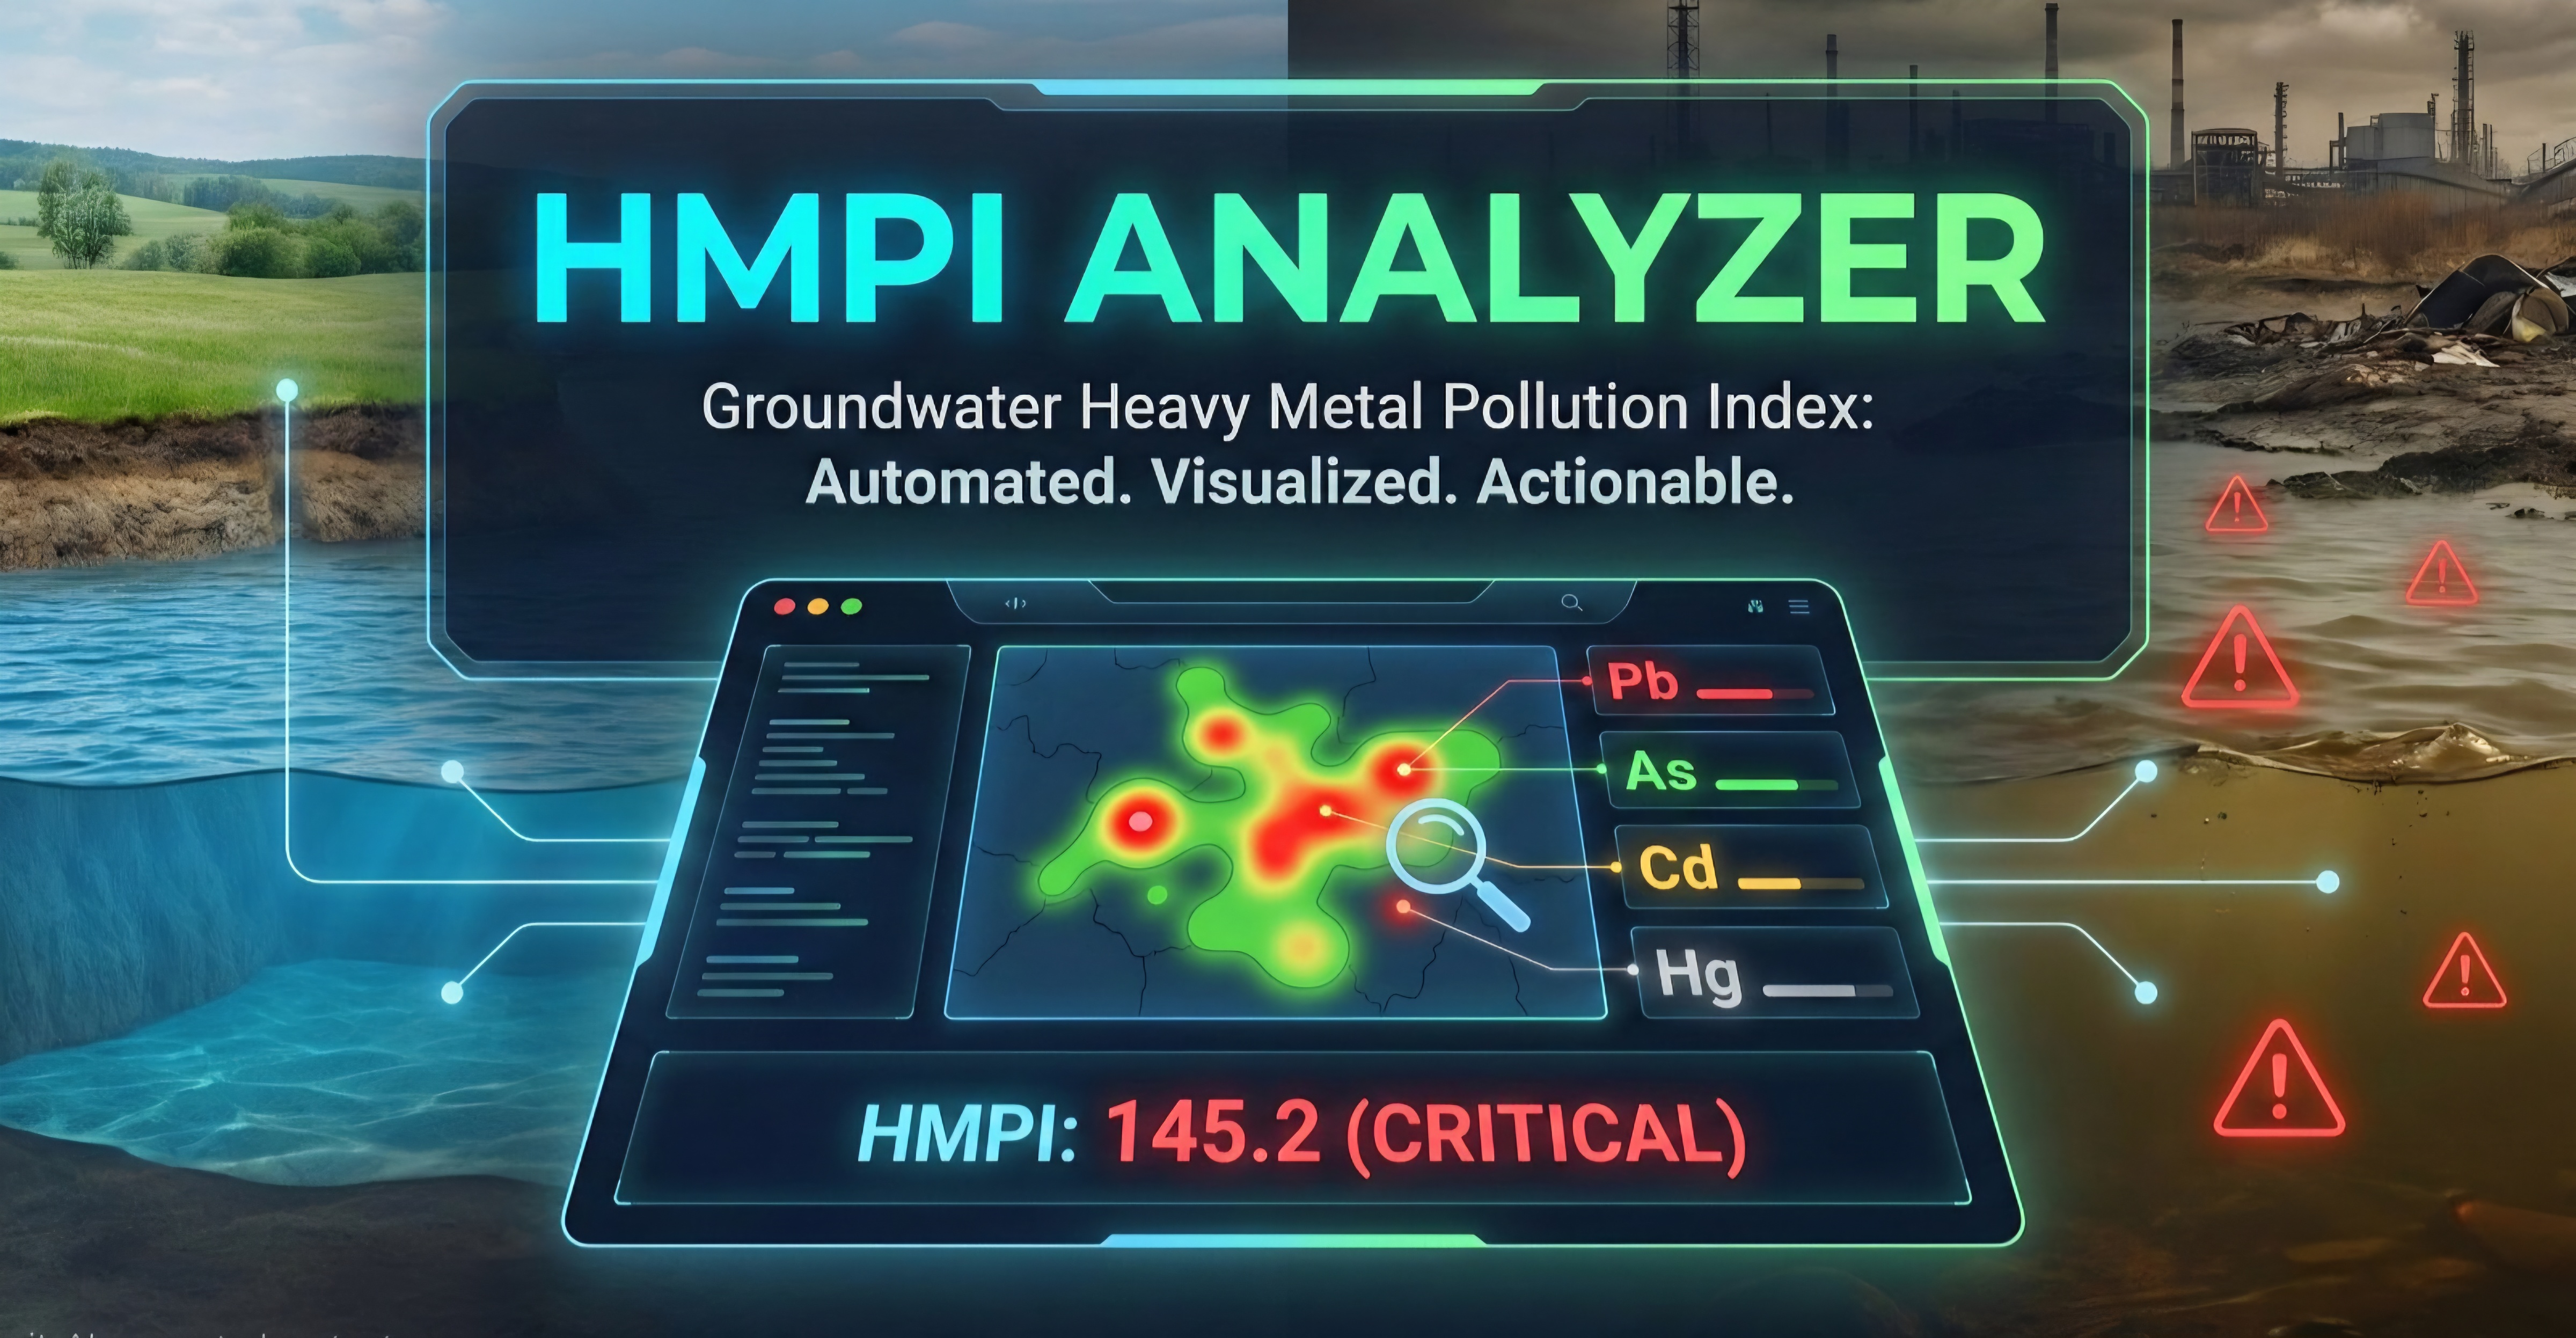
HMPI Analyzer is an automated web platform designed for environmental scientists and policymakers. Automated Computation: Users simply upload a CSV or Excel dataset containing heavy metal concentrations. Instant Visualization: The app automatically calculates the HMPI for every sample and renders an interactive map with color-coded markers (Green for safe, Red for critical). Advanced Reporting: It generates professional-grade PDF and Excel reports with one click. Threshold Alerts: The system identifies samples exceeding WHO or national standards, acting as an early warning system for toxic "red zones."
How we built it
We developed a full-stack solution optimized for speed and geospatial accuracy: Frontend: Built with Next.js and Tailwind CSS for a high-performance, responsive dashboard. Mapping: Integrated Leaflet.js to handle dynamic map rendering and coordinate plotting. Backend: A Node.js engine handles the core mathematical processing. Database: PostgreSQL was used to manage structured data and geospatial coordinates. Mathematics: We implemented the standard weighted arithmetic index formula using LaTeX for precision: $$HMPI = \frac{\sum_{i=1}^{n} (Q_i \times W_i)}{\sum_{i=1}^{n} W_i}$$ Where the sub-index ($Q_i$) is calculated as: $$Q_i = \frac{C_i}{S_i} \times 100$$ ( $C_i$: monitored concentration,$S_i$: standard permissible limit,$W_i$: unit weightage).
standard weighted arithmetic index formula for maximum precision: HMPI = Σ (Qi × Wi) / Σ Wi Qi = (Ci / Si) × 100
Where: Cᵢ = Monitored concentration Sᵢ = Standard permissible limit Wᵢ = Unit weightage
Challenges we ran into
One of the biggest hurdles was Data Normalization. Datasets often come with inconsistent headers or varying coordinate formats. We built a robust validation layer to clean and parse these files before they hit the calculation engine. Additionally, managing real-time rendering for large datasets on the map required optimizing our React state management to prevent lag. Accomplishments that we're proud of We are proud of creating a seamless "Data-to-Map" pipeline. Being able to transform a messy raw spreadsheet into a fully interactive, color-coded geographic visualization in under three seconds is a major win. Successfully implementing the complex HMPI logic into a clean, reusable JavaScript module was also a highlight for our team.
Accomplishments that we're proud of
This project was a deep dive into Geospatial Engineering. We learned how to handle latitude/longitude data and how to translate scientific indices into functional code. We also gained a greater appreciation for User-Centric Design—ensuring that a tool meant for scientists is actually intuitive and easy for anyone to use. What's next for HMPI Analyzer AI/ML Predictive Modeling: Using historical data to predict which regions are at risk of future contamination. IoT Integration: Connecting live water quality sensors for real-time monitoring without manual uploads. Mobile App with Offline Mode: Enabling field researchers in remote areas to collect data offline and sync it once they reach connectivity. converts this into a word file where the formula should be in the correct order
What we learned
This project was a deep dive into Geospatial Engineering. We learned how to handle latitude/longitude data and how to translate scientific indices into functional code. We also gained a greater appreciation for User-Centric Design ensuring that a tool meant for scientists is actually intuitive and easy for anyone to use.
What's next for HMPI Analyzer: Real-time Water Risk Platform
AI/ML Predictive Modeling: Using historical data to predict which regions are at risk of future contamination. IoT Integration: Connecting live water quality sensors for real-time monitoring without manual uploads. Mobile App with Offline Mode: Enabling field researchers in remote areas to collect data offline and sync it once they reach connectivity.


Log in or sign up for Devpost to join the conversation.