-
-
-
-

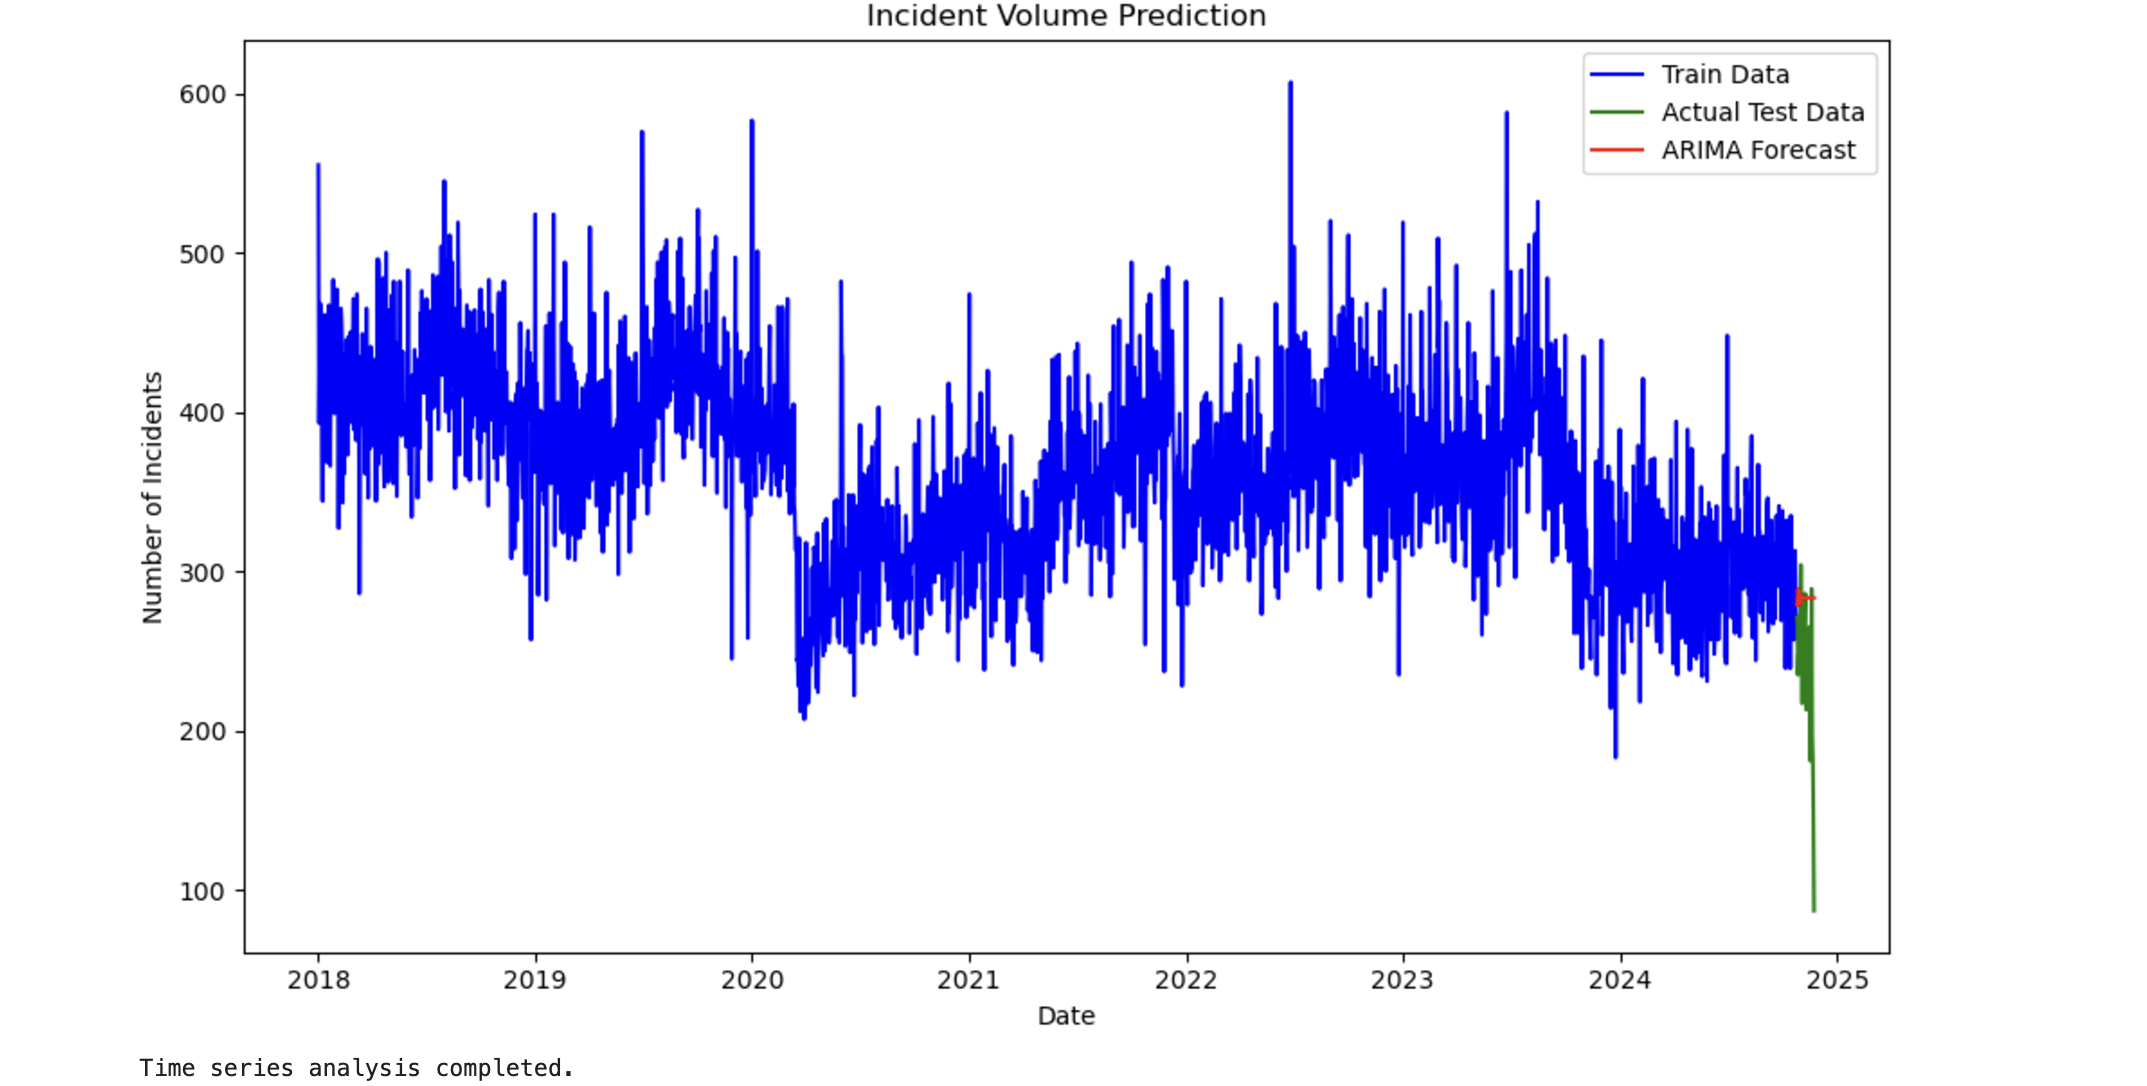
Prediction
-
-
-


Inspiration
The inspiration behind this project stems from the need to enhance public safety and emergency response in urban areas. By analyzing historical incident data, we aim to support communities and law enforcement in addressing crime more effectively and improving resource allocation.
What it does
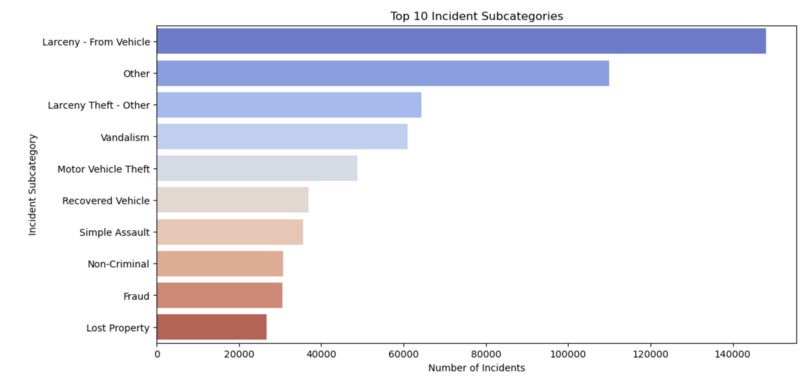
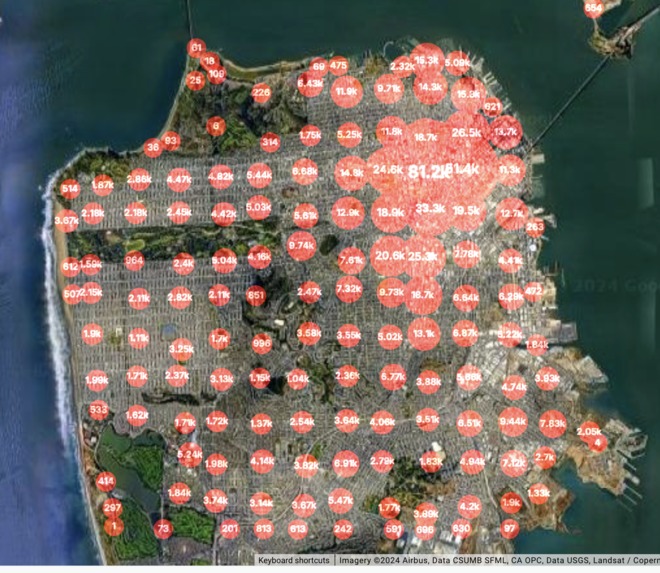
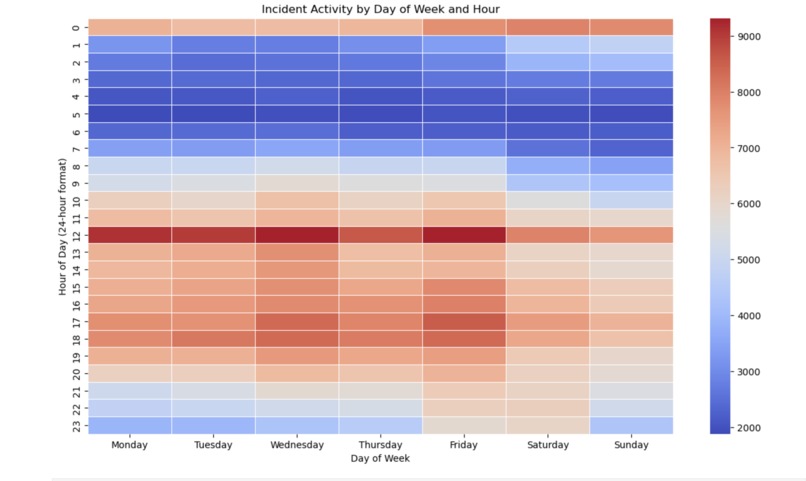
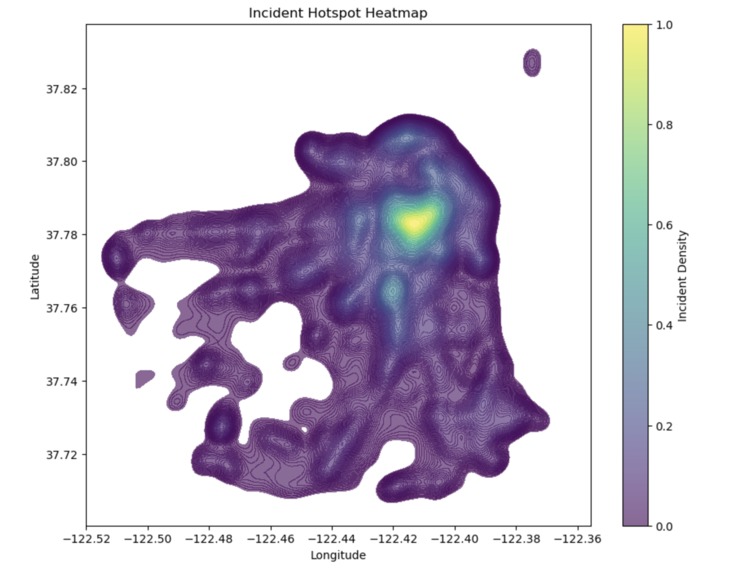
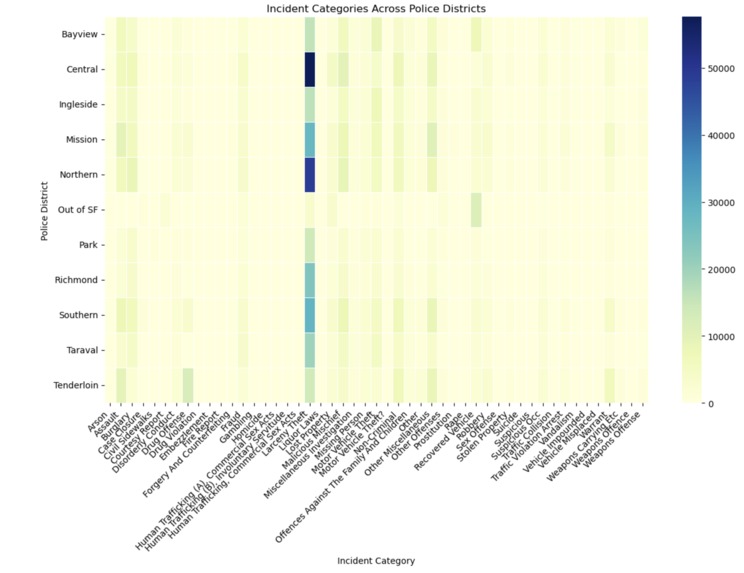
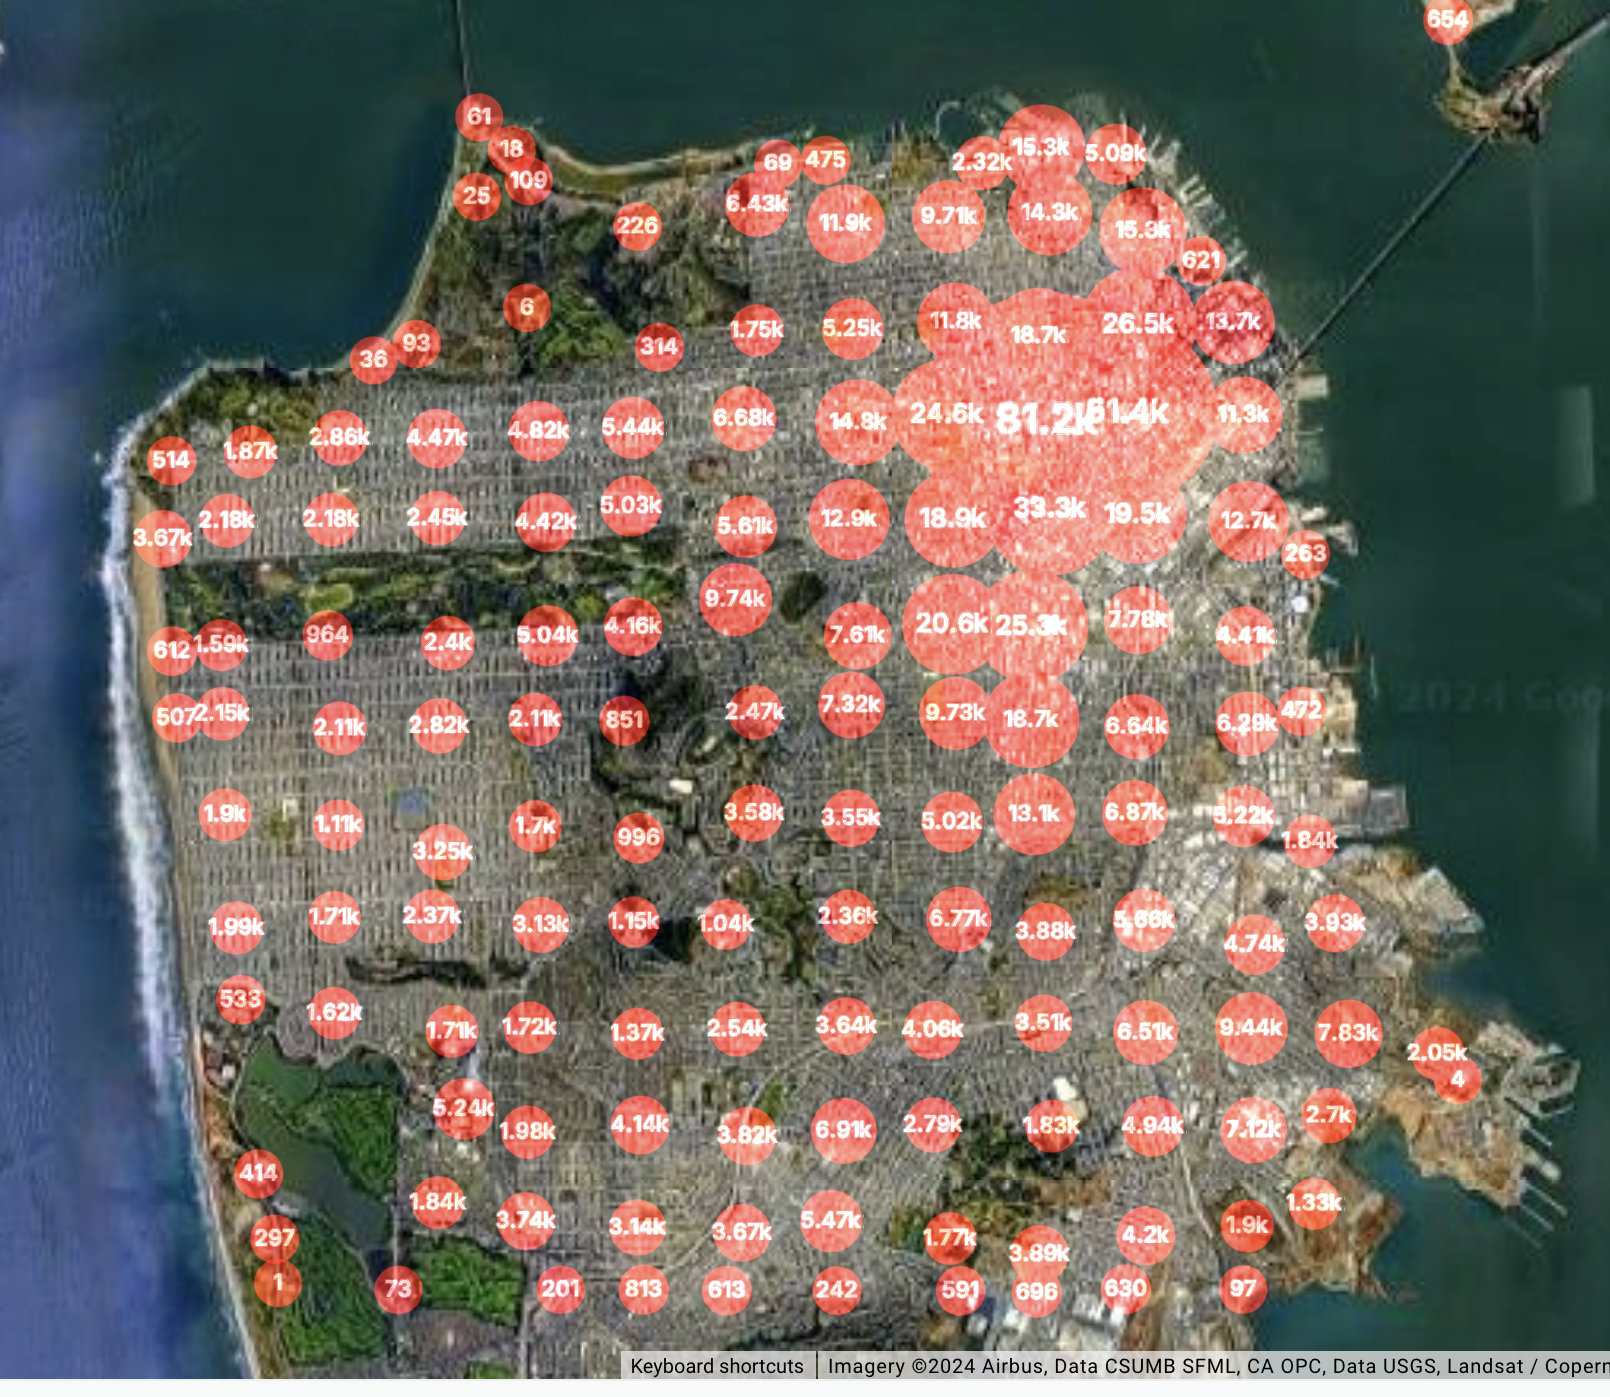
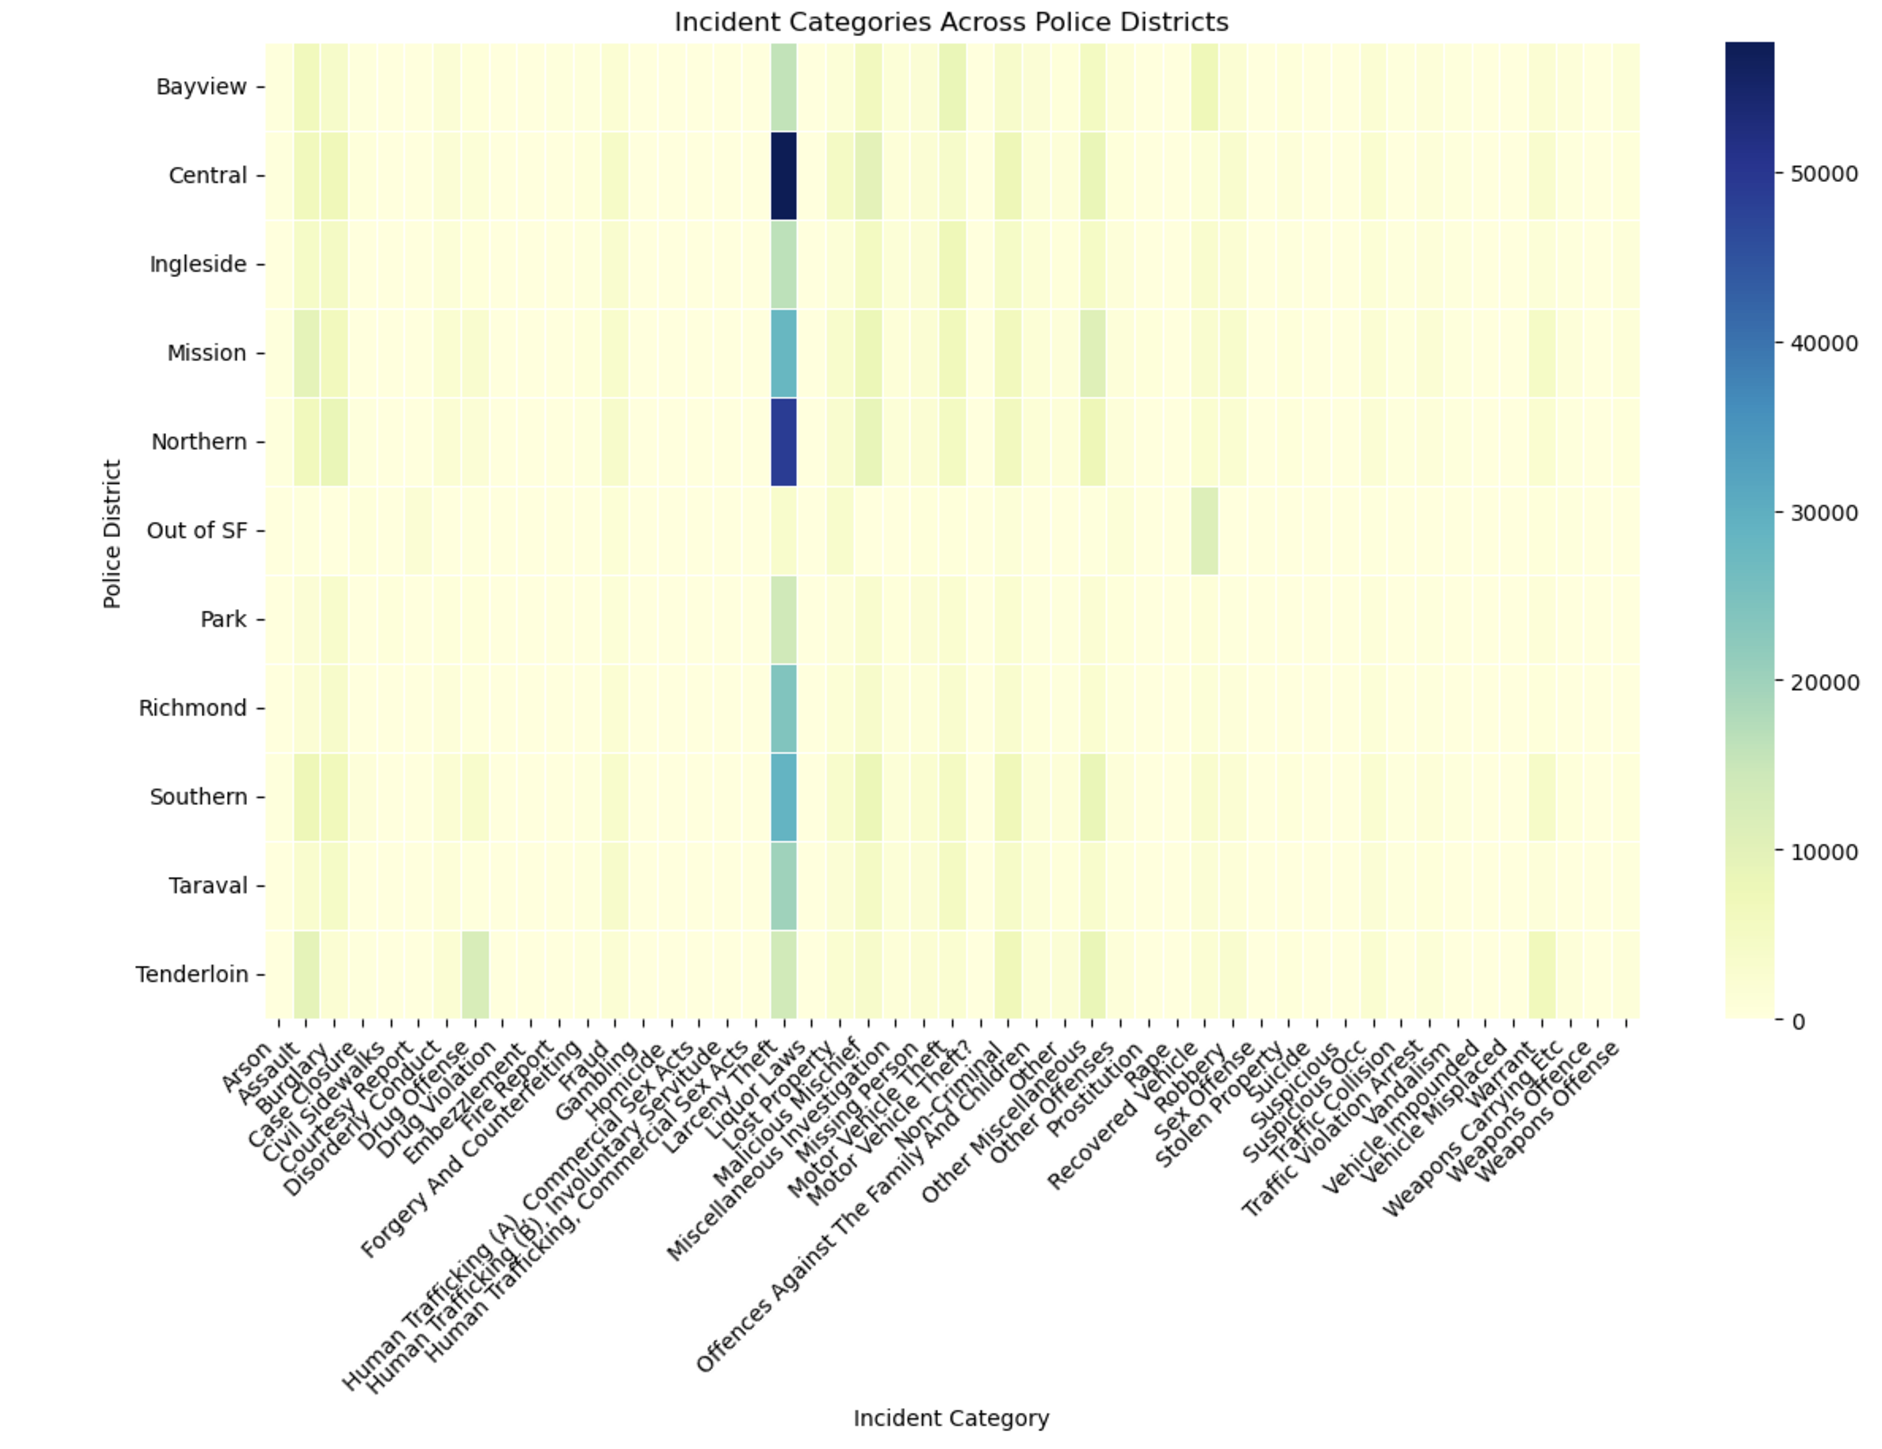
The project analyzes and visualizes incident reports in San Francisco from 2018 to the present. It identifies crime hotspots, temporal patterns, and trends, enabling better decision-making for emergency response, resource distribution, and community engagement.
How we built it
We utilized a robust tech stack including Python for data preprocessing and analysis,GIS tools for spatial analysis, and clustering algorithms like DBSCAN and K-means.
Challenges we ran into
Data Cleaning: Handling a large dataset with inconsistent or incomplete entries. Geospatial Analysis: Mapping incidents accurately and clustering them into meaningful patterns. Interpretation: Balancing technical insights with actionable recommendations for non-technical stakeholders.
Accomplishments that we're proud of
Successfully processing and analyzing over 900,000 incident reports. Identifying critical crime hotspots and temporal patterns that can inform emergency services. Creating an intuitive dashboard to make insights accessible to policymakers and the public.
What we learned
We plan to expand the project by integrating real-time incident reporting, incorporating predictive analytics, and exploring other cities for a broader impact. Collaborating with local authorities and community organizations to implement the insights is also on the horizon.
What's next
We plan to expand the project by integrating real-time incident reporting, incorporating predictive analytics, and exploring other cities for a broader impact. Collaborating with local authorities and community organizations to implement the insights is also on the horizon.
Built With
- clustering
- gis-(geographic-information-systems)
- k-means
- like
- numpy
- pandas
- python
- scikit-learn
- sql
- tableau-(or-another-visualization-tool)