Inspiration
This project was inspired by the work of quantitative analysts, who need to understand the underlying causes and effects of the market. We believe that this could help them more easily grasp trends without having to spend as much time diving deep into news stories and trends.
What it does
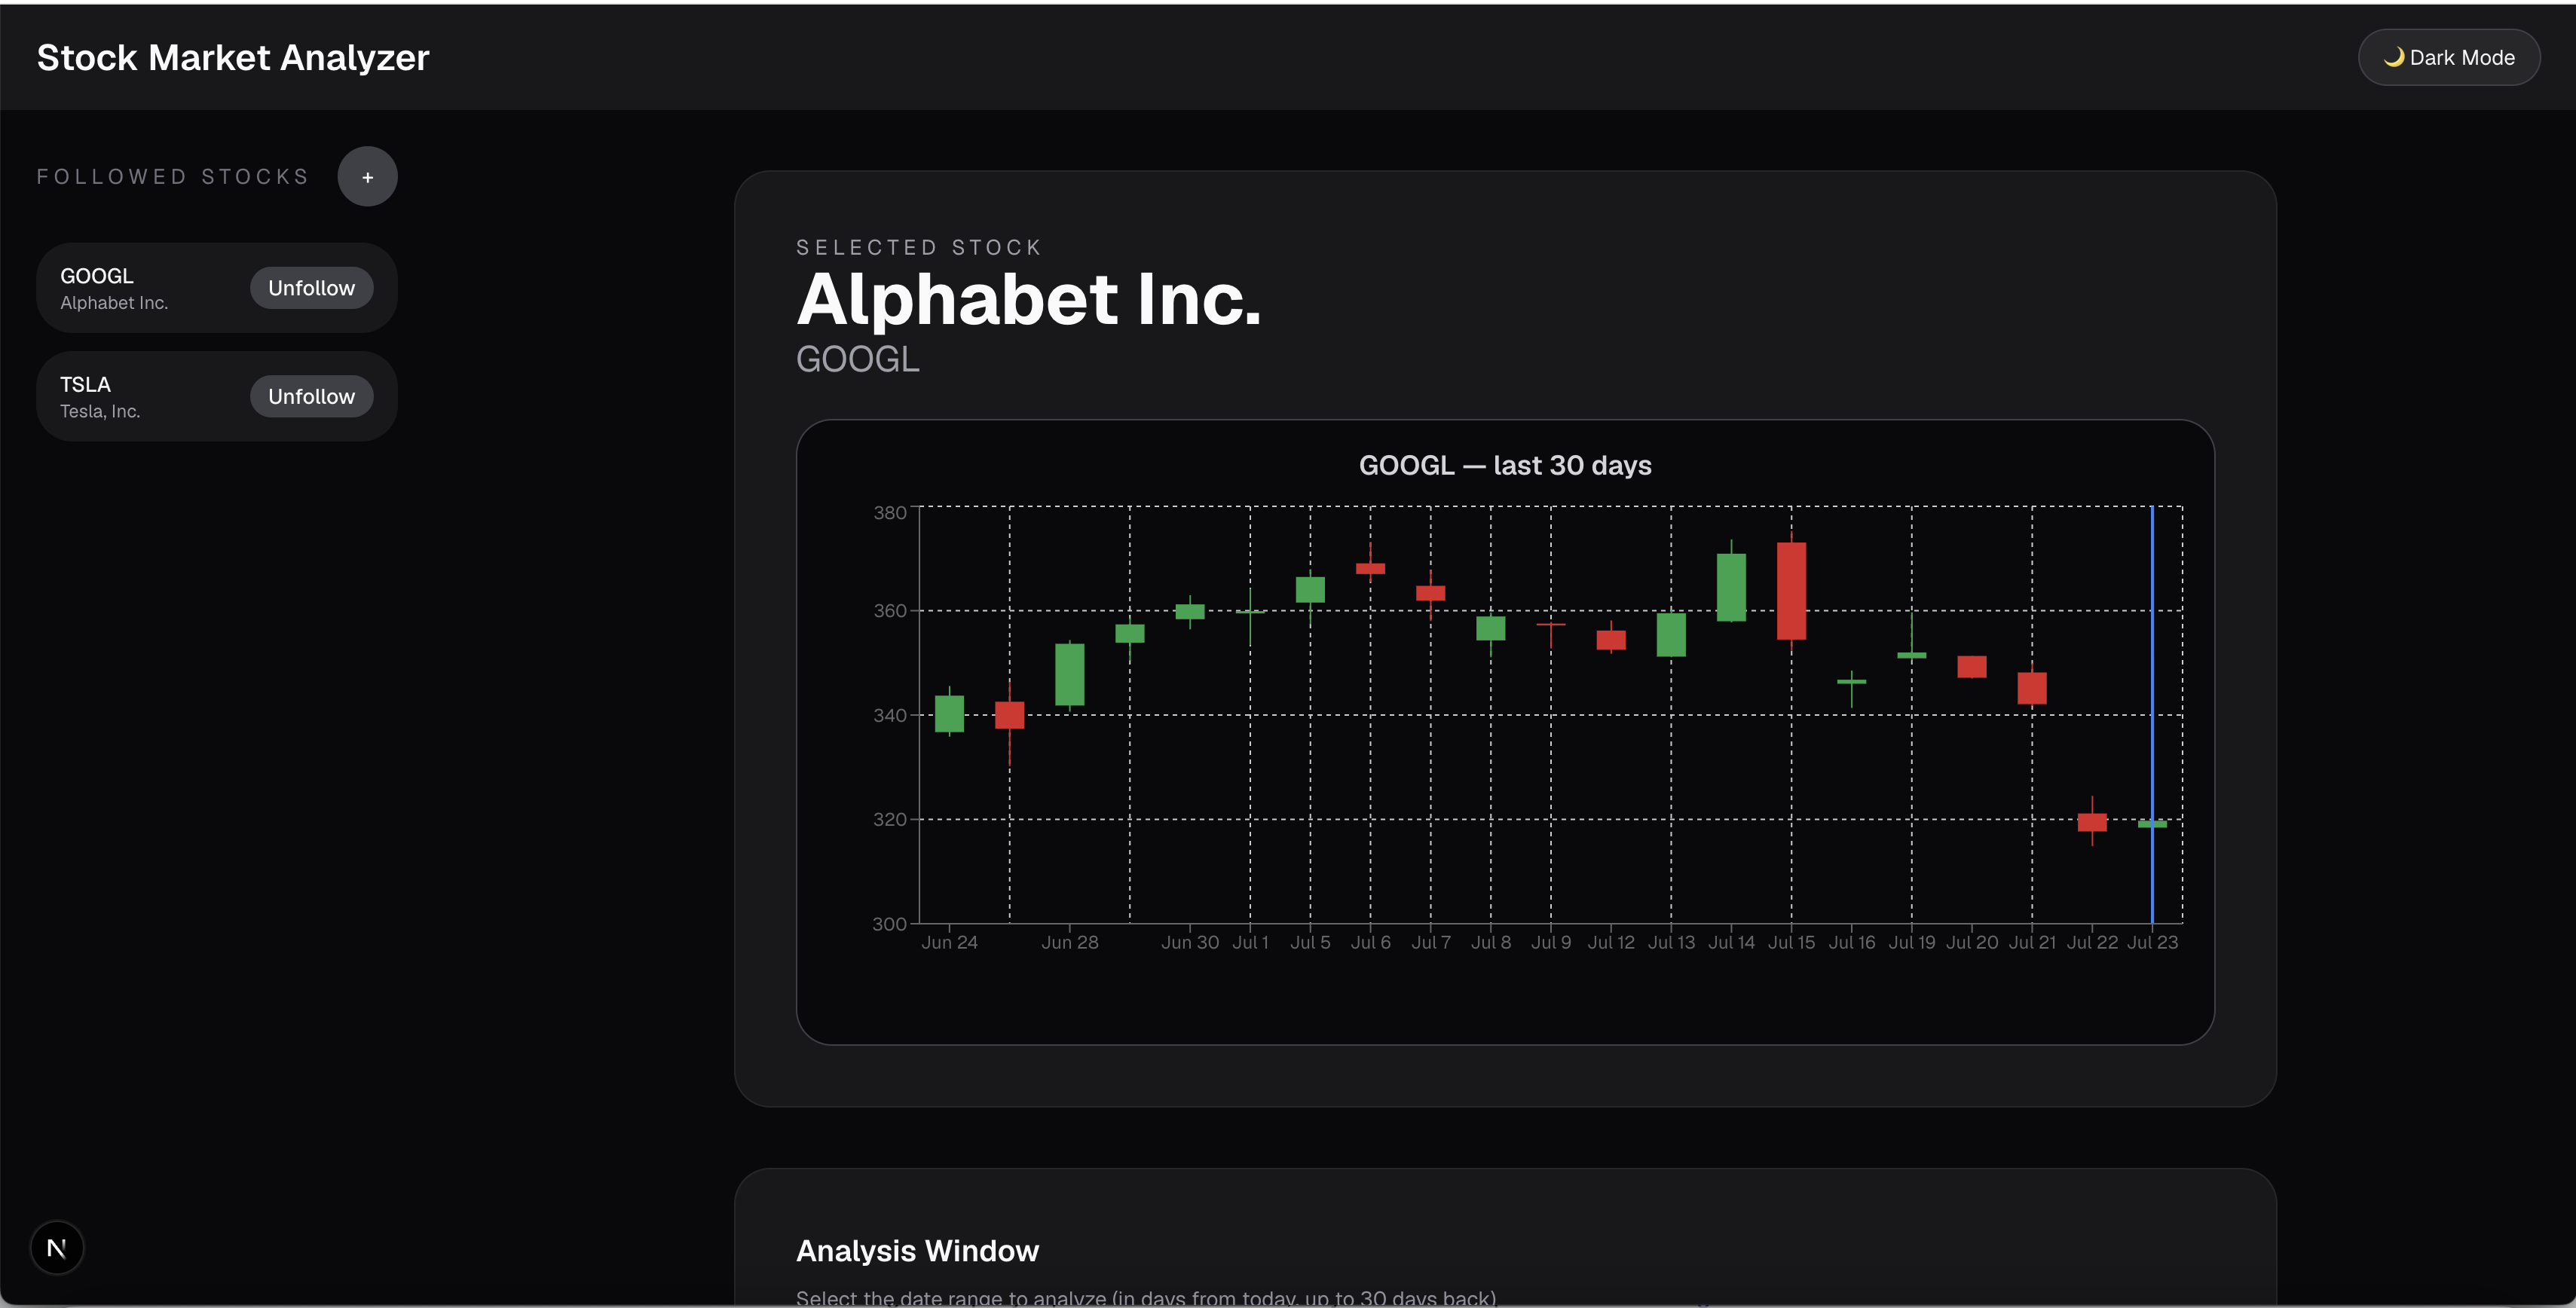
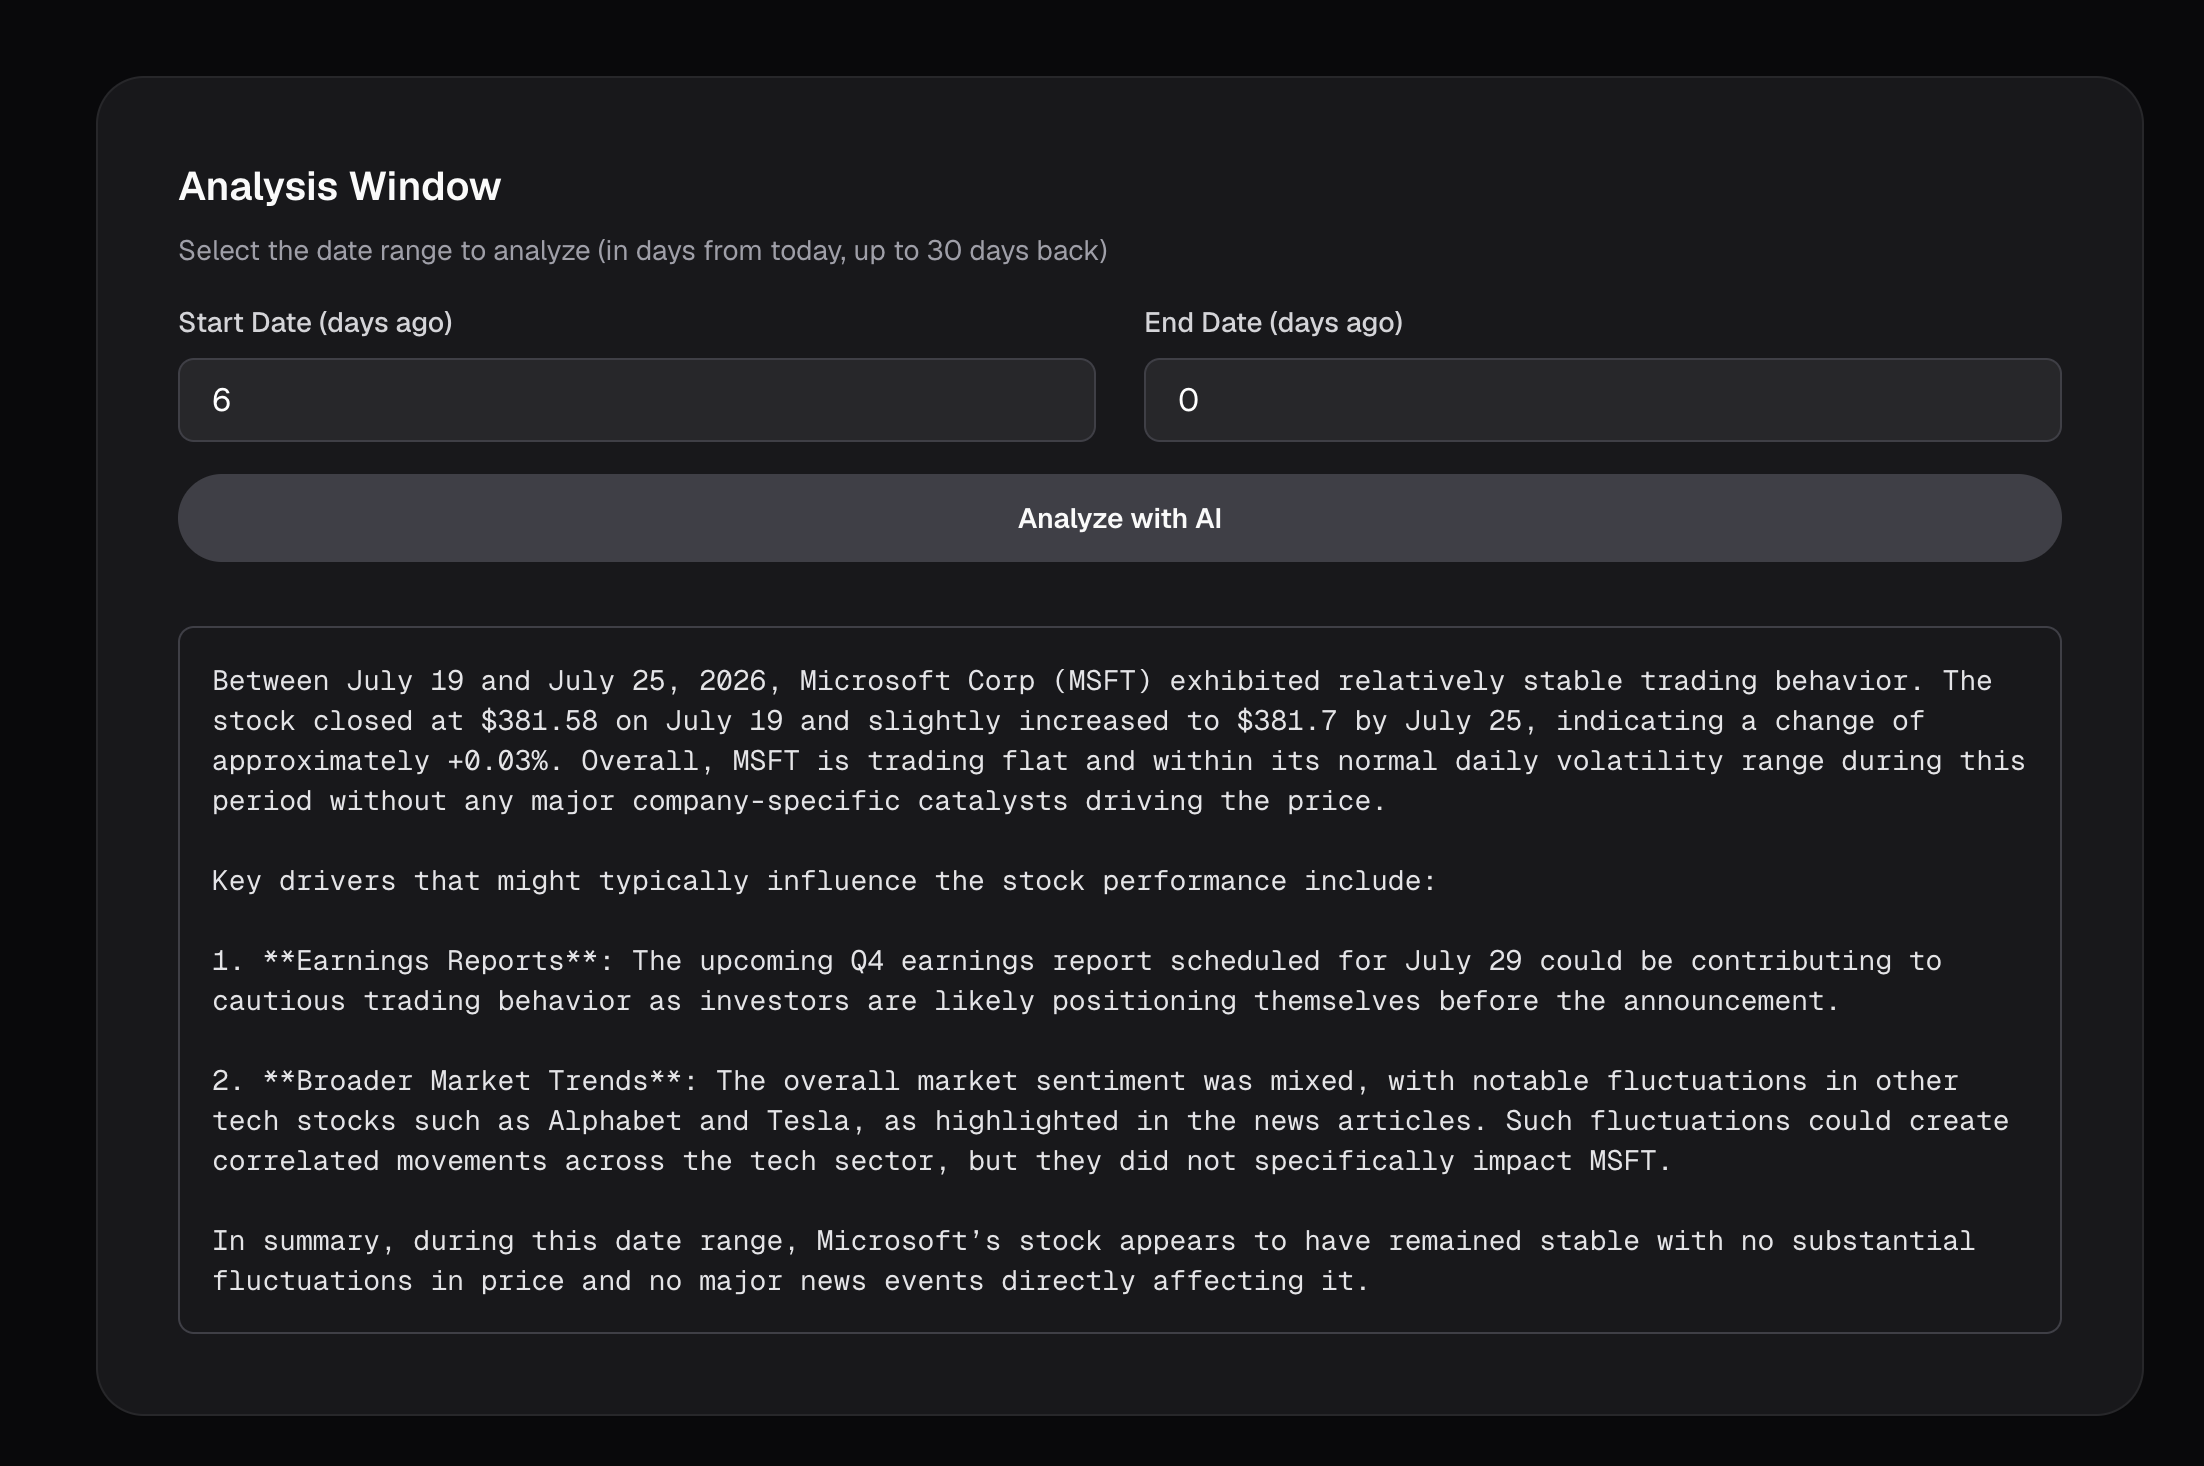
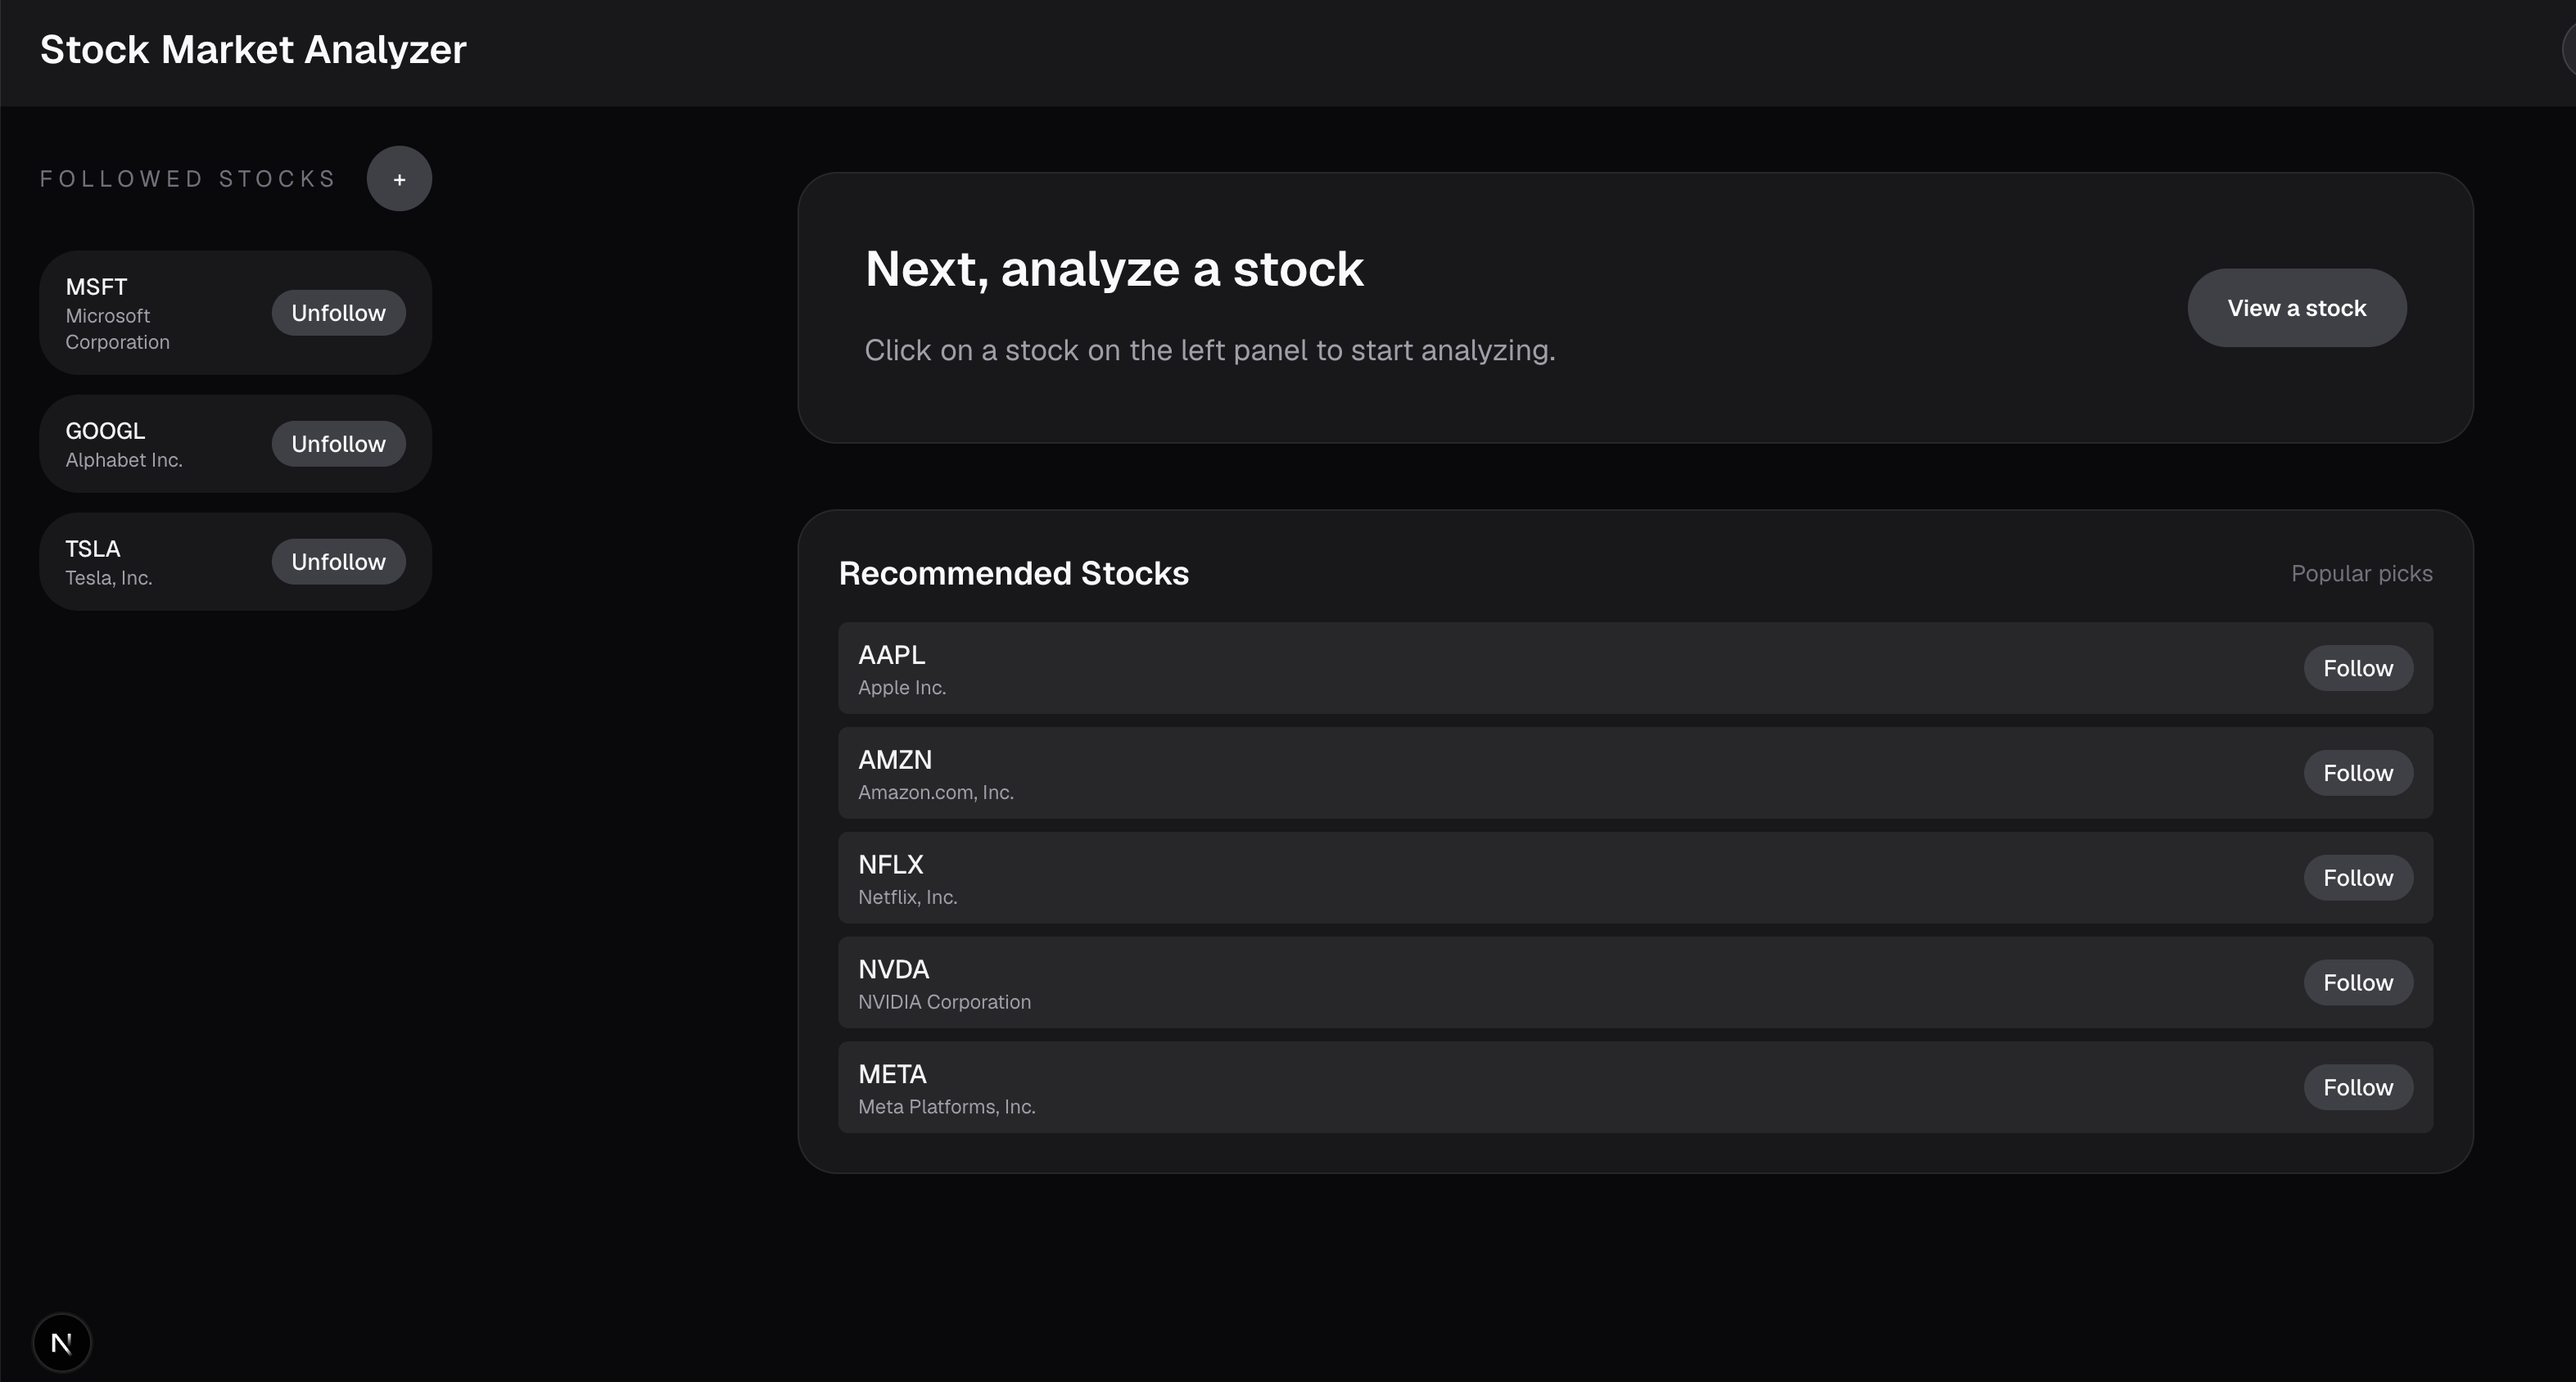
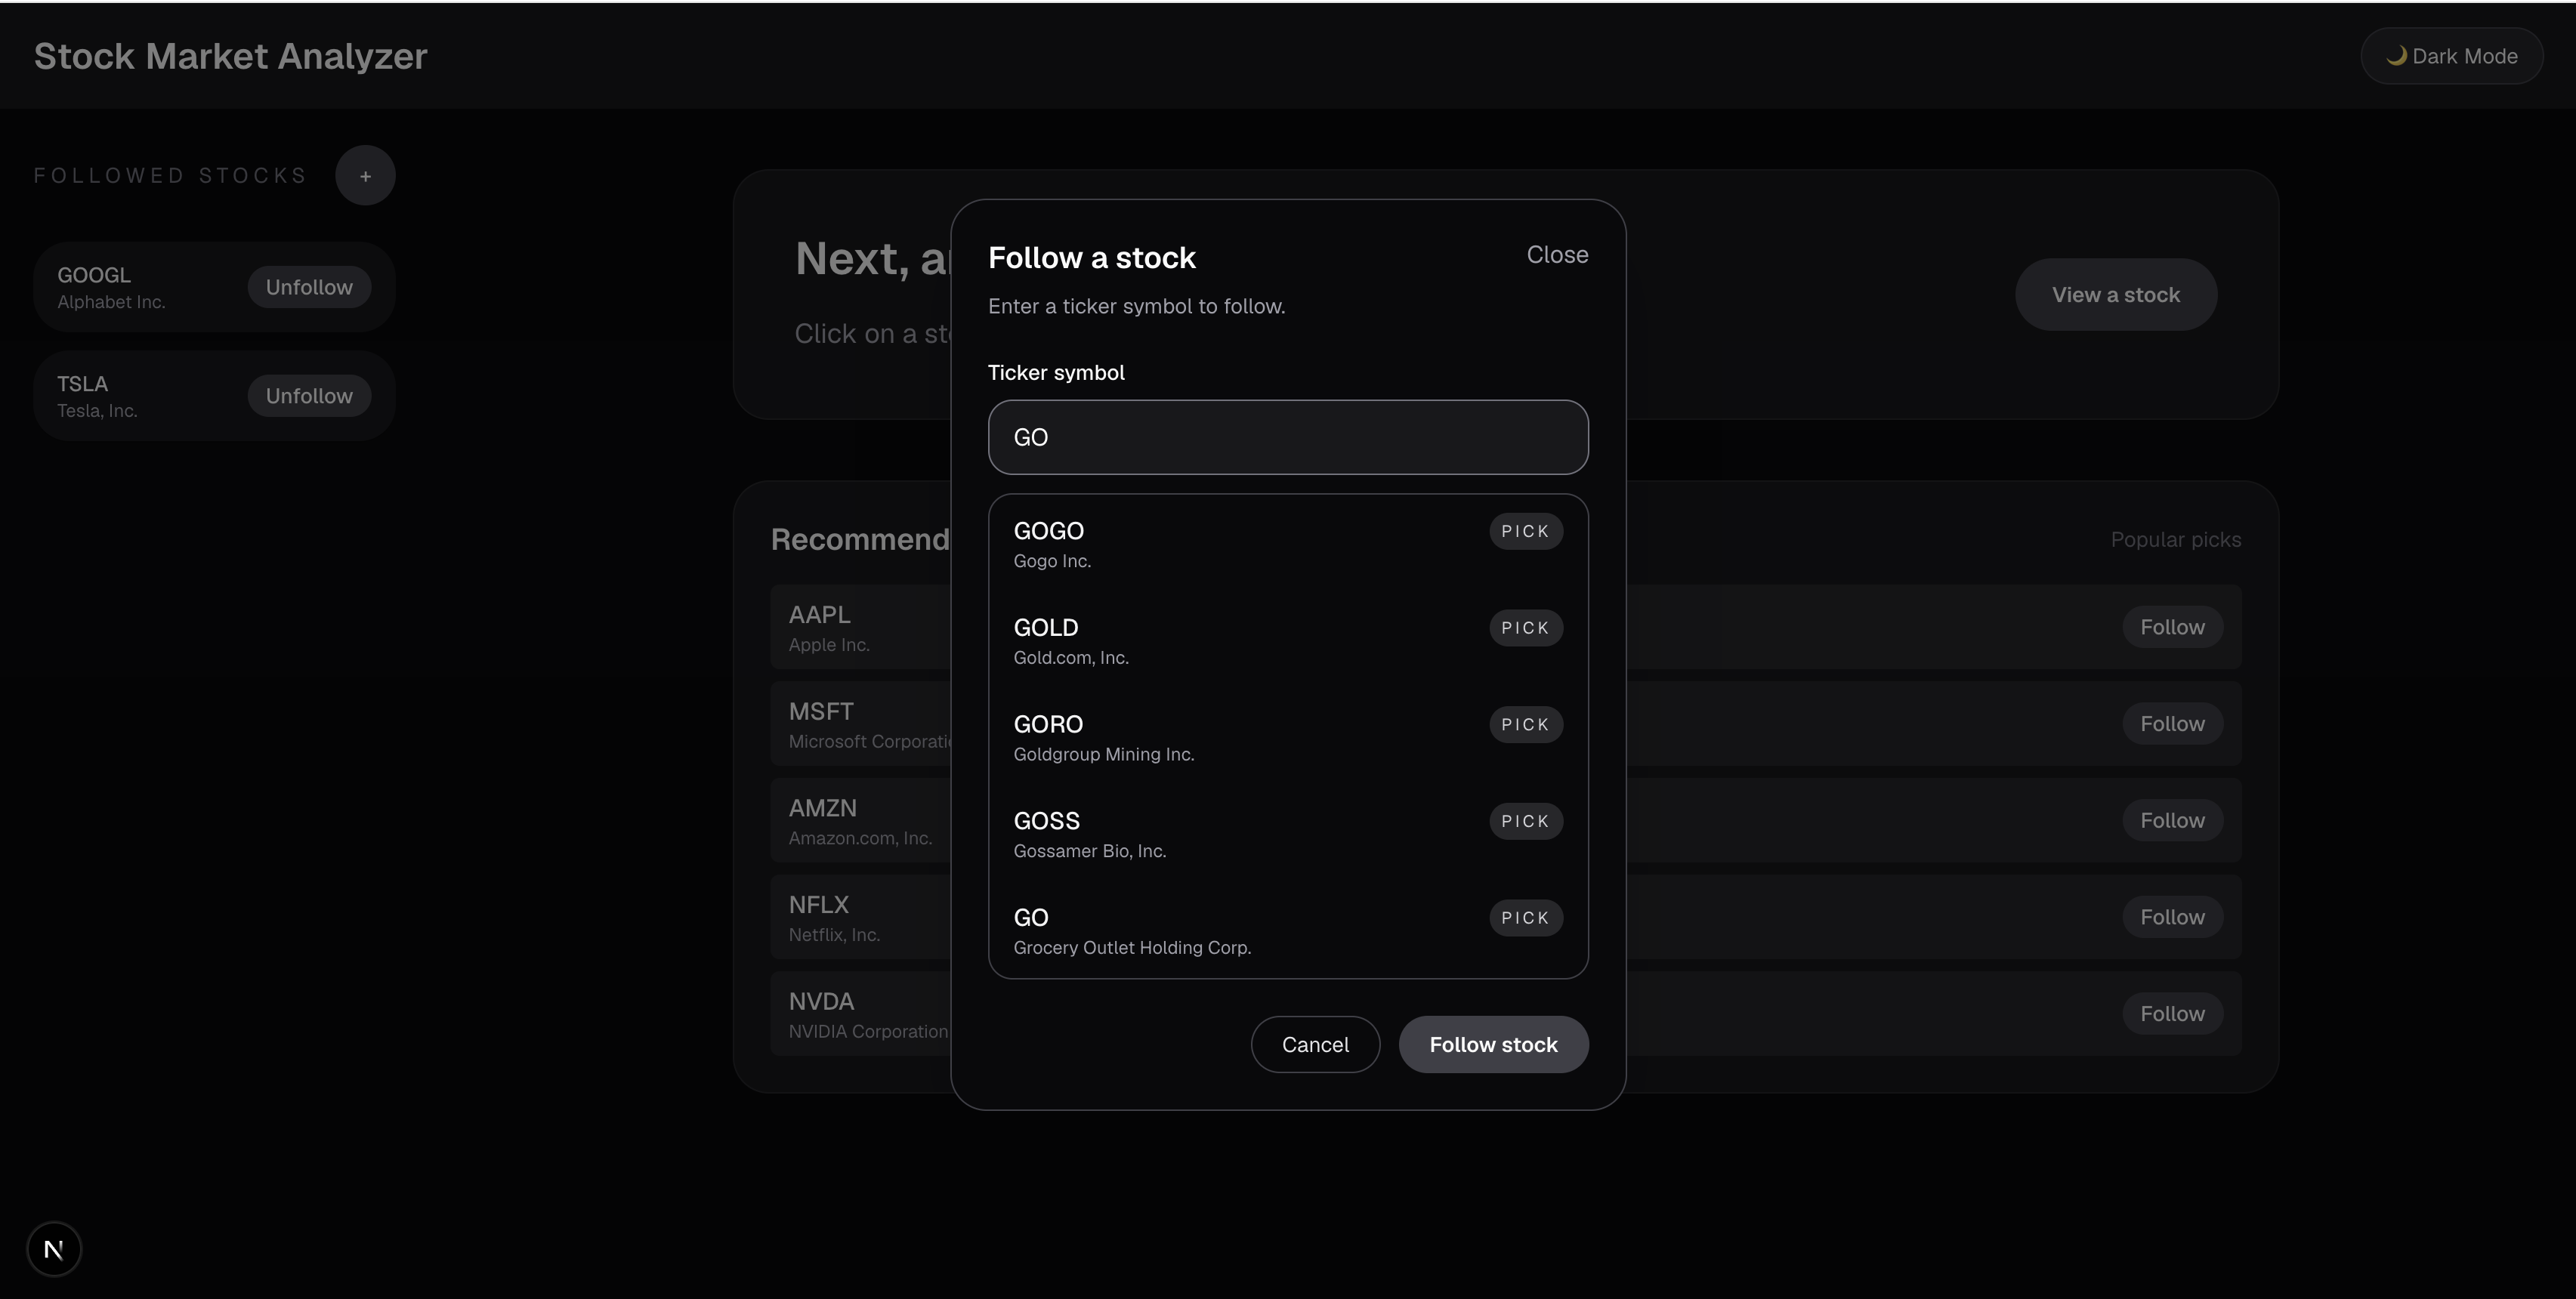
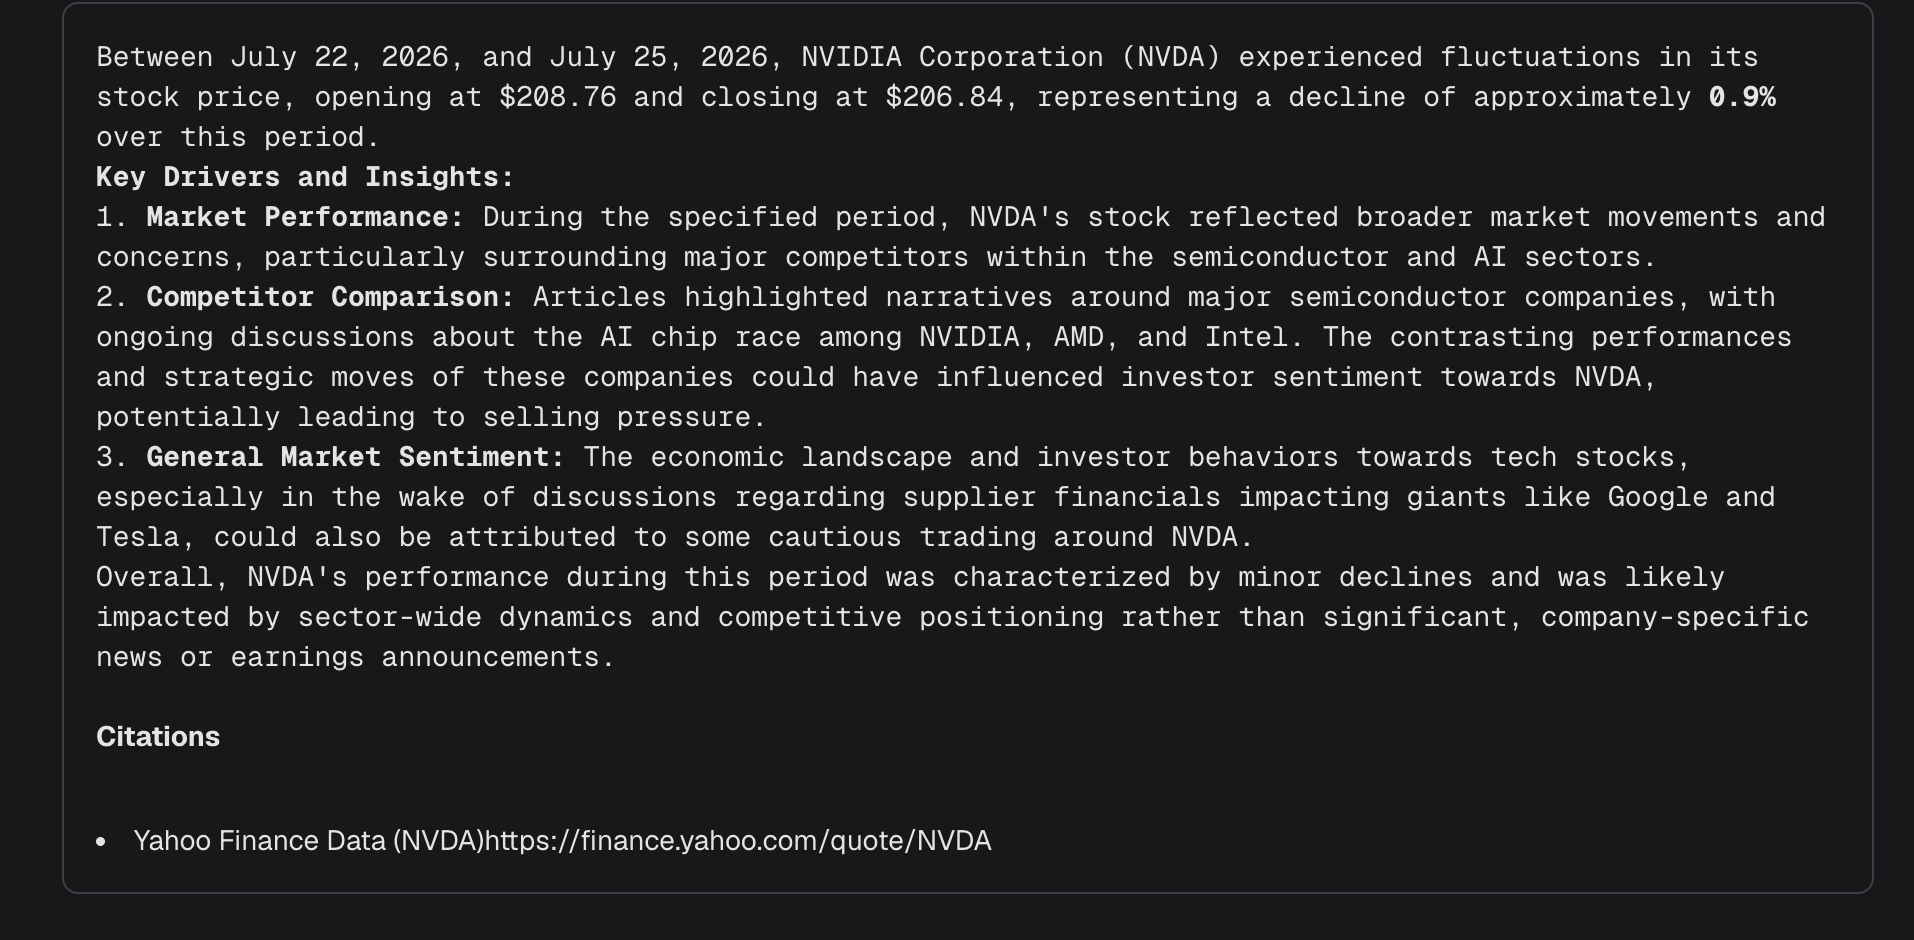
This project allows users to follow various companies' stock market graphs. For each company, the user can see a candlestick graph and select an interval to analyze. Afterwards, an AI model will be fed the data and allowed to search the news and search engines to gain a better idea of the situation. Finally, the AI will return not only an answer but the various sources that it searched to gain a better idea of the situation.
How we built it
We built the frontend with NextJS and the AI model using Python, using an openai model with a tool schema that let it execute various functions like web search.
Challenges we ran into
A challenge we ran into was the integration of the python into the javascript, as there were many things (open ai model) that couldn't be run by javascript.
Accomplishments that we're proud of
We are proud of how we solved the challenge above by creating a separate server for python to run using uvicorn host, and then reading that, creatively bridging the gap between javascript and python. We are also proud of our modifications to the AI to allow it to not only return an answer but also log down citations of the sources it used.
What we learned
We learned about certain design patterns for agents and for nextJS and react. We became a lot more familiar with useEffect and useState. For example, we now know how to exploit the nature of event listeners to affect useEffect.
What's next for Hindsight
We will likely add more features to this site such as a way to have long conversations with the AI, or to more refine the tool system to allow AI to search more places.


Log in or sign up for Devpost to join the conversation.