Inspiration I run six automated YouTube channels. Together they have passed a million views. Every part of that pipeline is automated — generation, rendering, metadata, scheduling, upload — and every part of it is open loop. The videos go out and nothing ever comes back. I had 949 videos on one channel and could not have told you which of them worked, or why.
The obvious answer is "look at your analytics", and that is where it falls apart. YouTube Studio shows you a list sorted by views, and on a channel with thirteen months of uploads that list is sorted by publish date wearing a disguise — older videos have had longer to accumulate, and they went out to a smaller channel. There is no view in Studio, or in any creator tool I could find, that answers "does posting at noon beat posting at 1am, controlling for the fact that my channel grew 6× in between?"
That question is answerable. It just needs the statistics done properly.
What it does Ingest the published catalog from the YouTube Data API. Score every video as a percentile against the 50 videos published nearest to it in time, which cancels channel growth, seasonality and video age. Test which metadata choices — length, title structure, posting hour, description, tags — actually shifted that score. Design the experiment that settles the biggest remaining question. Read the verdict once enough videos have published.
The unit of value is the experiment, not the dashboard.
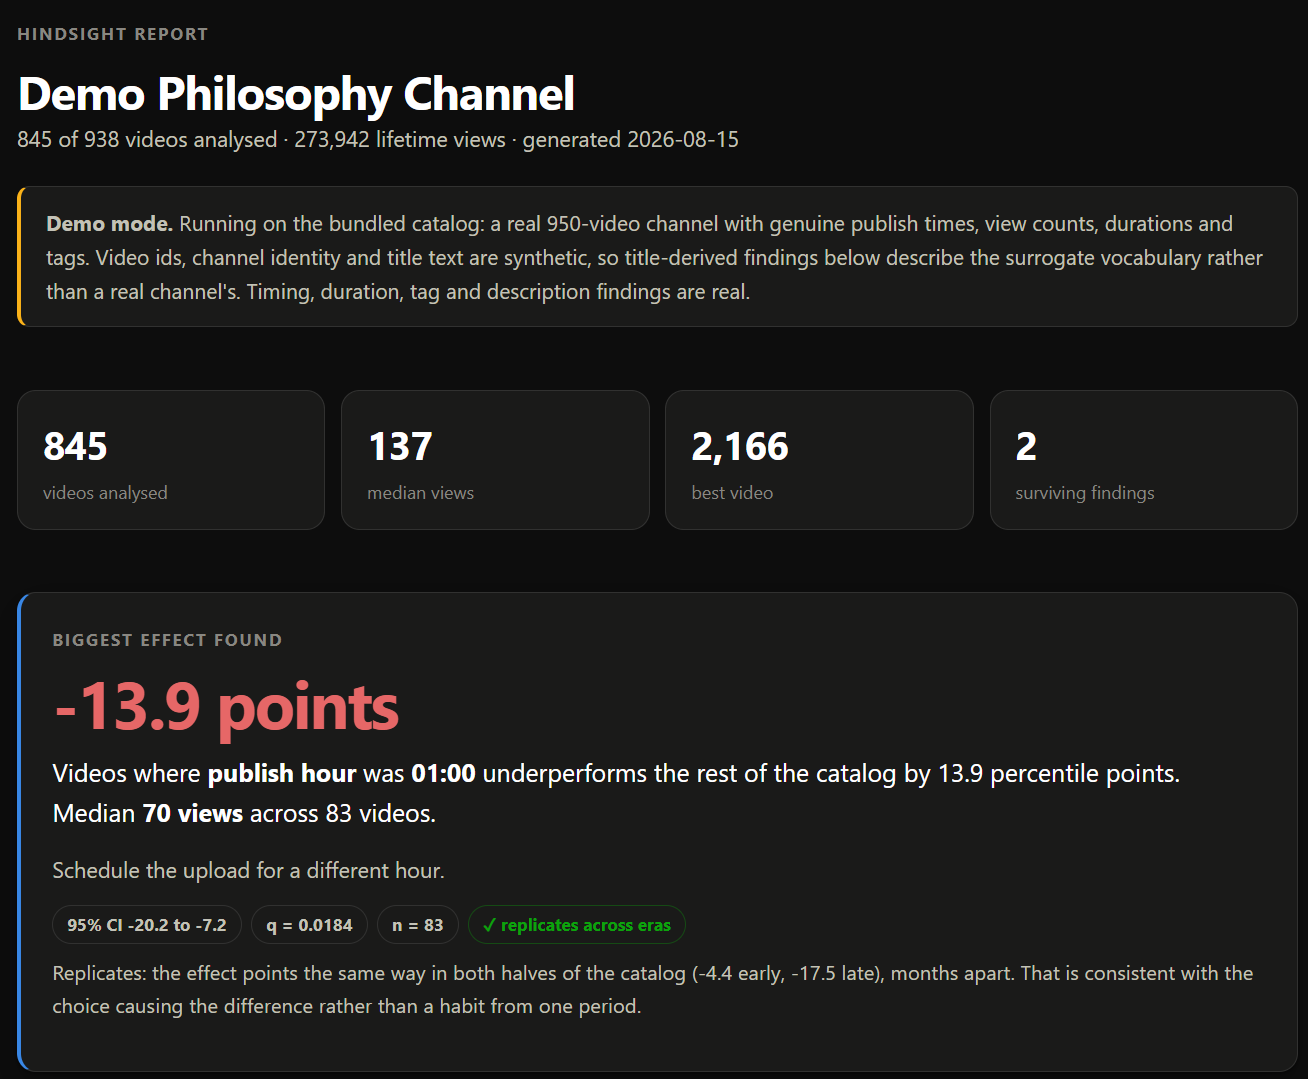
What it found Run live against a real 949-video channel with ~317,000 lifetime views (938 public, 845 clearing the analysis filters):
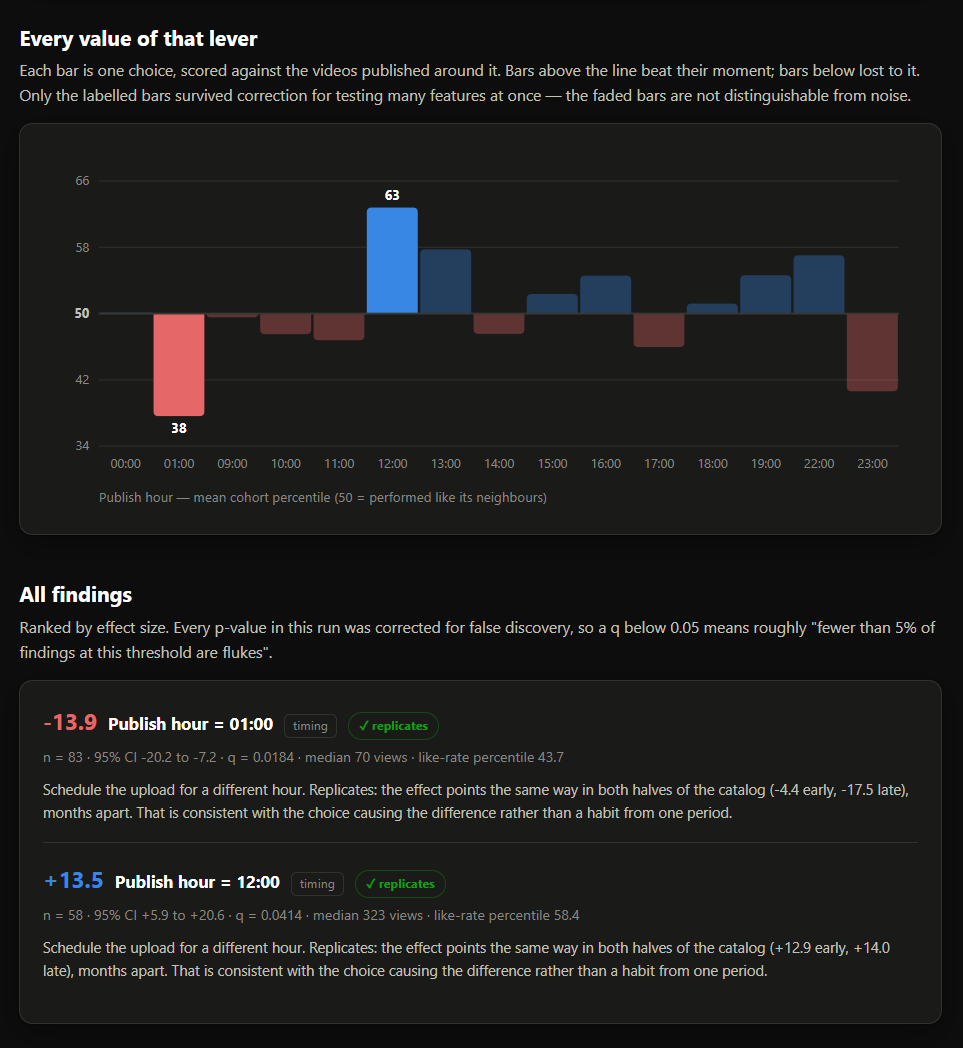
Publishing at 01:00 costs 13.9 percentile points — median 70 views (n=83, q=0.018) Publishing at 12:00 gains 13.5 percentile points — median 323 views (n=58, q=0.041) A 4.6× difference in median views from the hour of day alone, on a channel that had been publishing for over a year without noticing. Both survive correction for multiple testing, and both replicate independently on the older and newer halves of the catalog months apart.
It also found that every one of the 845 analysed videos carries the same five tags — a full year of uploads with that lever never once varied — and sized the experiment to test it.
Every number above is reproducible in one command, with no credentials: hindsight demo --tz 5.5. The channel publishes on UTC+5:30, and hours are reported in whatever timezone you pass — plain hindsight demo runs in UTC and reports the same two findings as 19:00 and 07:00.
How I built it Python 3.13, ~4,600 lines across thirteen modules, plus 175 tests. YouTube Data API v3 for ingestion, SQLite for an append-only catalog cache, Jinja2 for a self-contained HTML report with hand-generated inline SVG charts.
The statistics are implemented in the repo rather than imported:
Cohort-relative percentile scoring to make videos comparable across time Permutation testing (10,000 resamples), because view distributions are far too skewed for anything parametric Benjamini-Hochberg FDR correction across every test in a run — at ~40 buckets per analysis you would otherwise expect two false findings from noise alone Era-split replication to catch effects that are really artifacts of a period rather than properties of a choice Power analysis to size experiments, inverted to answer "what can I detect within 90 days at my upload rate?" rather than "how long until I can detect 5 points?" numpy makes the resampling fast; it does not supply the methods.
Challenges Making comparison honest. The first version ranked videos by views and produced confident nonsense — it had rediscovered the passage of time. Cohort scoring was the fix, and tests/test_cohort.py::TestGrowthCancellation now encodes that claim as a falsifiable test: a synthetic catalog where views grow 10× and a feature has a known effect, asserting raw counts give the wrong answer and percentiles give the right one.
Not lying with statistics. Testing forty features means finding two "significant" results from pure noise every run. FDR correction was non-negotiable, and the era-split check came from asking what a sceptic would say about the timing finding — that the channel only posted at 1am during one bad stretch. It didn't; the effect replicates.
Three kinds of nothing. The hardest design decision was refusing to collapse "measured, no effect", "never varied", and "varied too thinly to measure" into a single "no finding". A tool that collapses them looks at 949 identically-tagged videos and concludes tags don't matter. Separating them is what turns the analysis into a to-do list.
Sobering sample sizes. The power calculation initially returned "272 days" and I nearly hid it. Instead it became a feature: experiments are sized to a time budget, and the report shows exactly what each budget can resolve. The honest number is more useful than a flattering one.
Accomplishments It found something real, on a real channel, that I did not know and can act on tomorrow. And it runs for anyone in one command with no credentials — hindsight demo executes the entire pipeline against a bundled anonymised catalog of genuine performance data.
What I learned That most creator analytics answers the wrong question. Showing what happened is easy and nearly useless; the hard and valuable thing is isolating which decision caused it, and being honest about the confidence level.

Log in or sign up for Devpost to join the conversation.