-
-
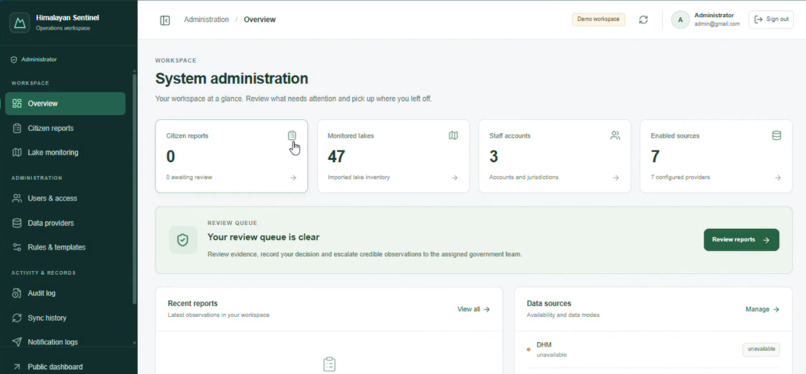
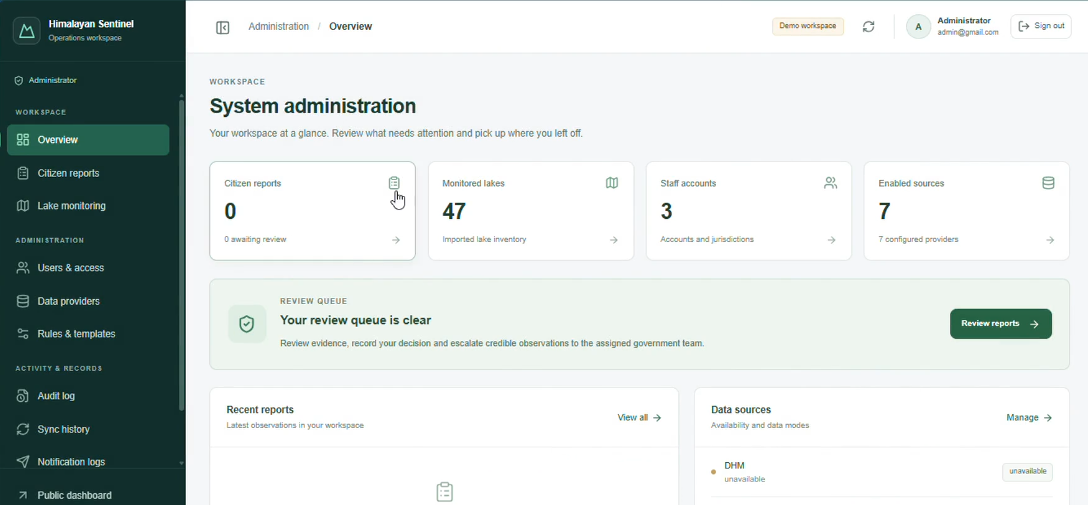
Admin Dashboard
-
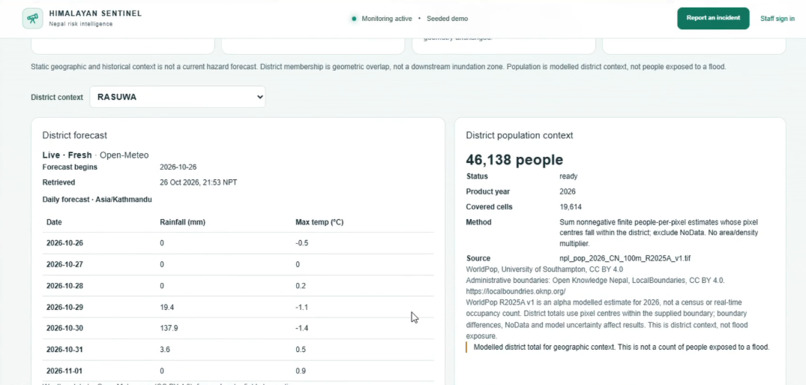
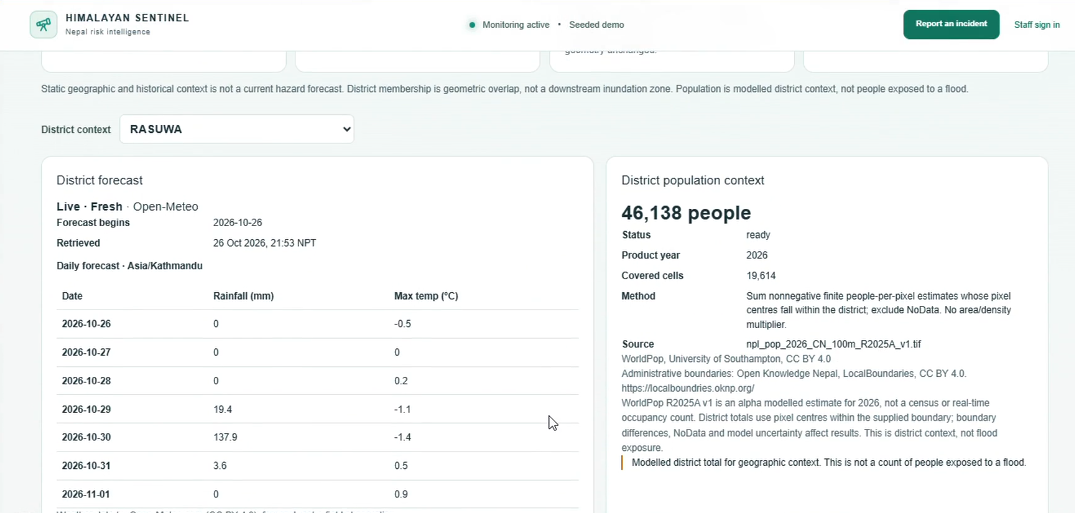
District Stats
-
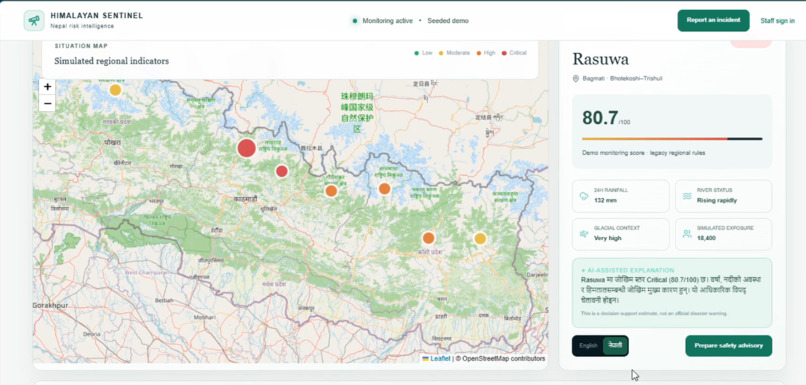
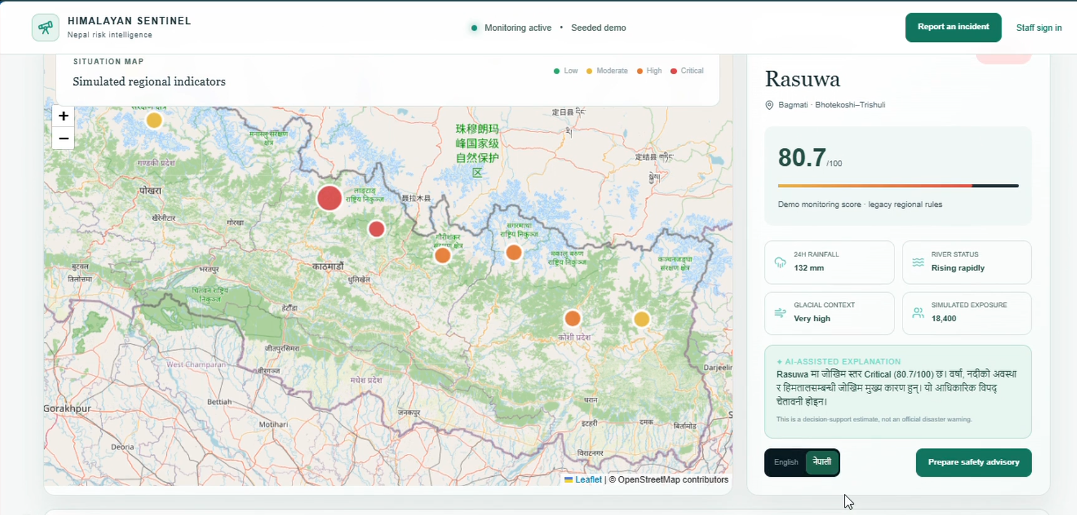
Lake explorer
-
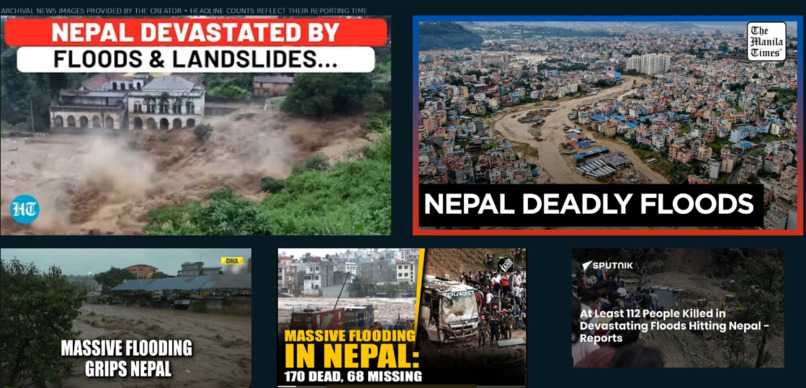
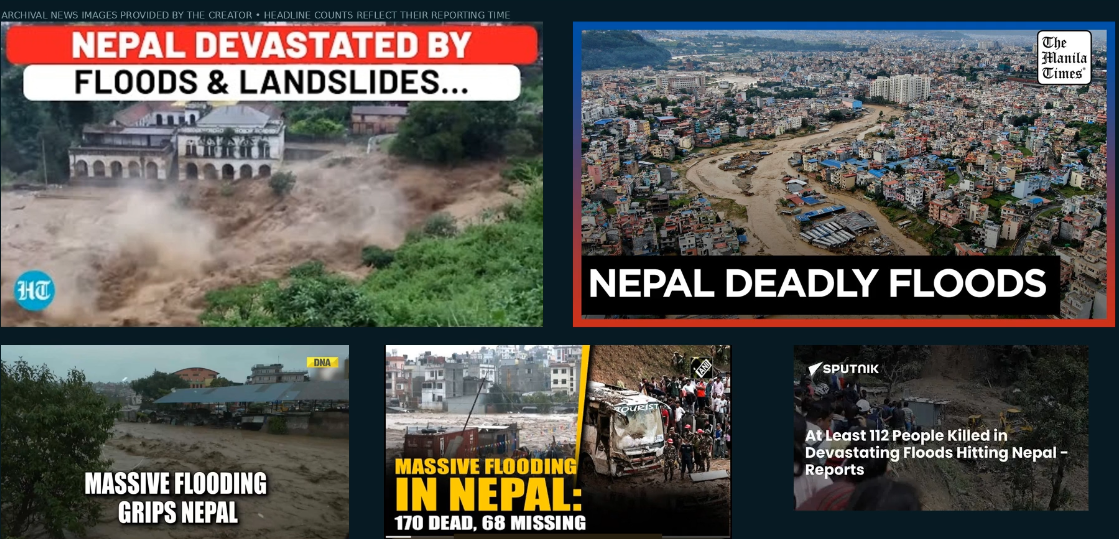
News Headlines
Inspiration
Flooding in Nepal has shown how quickly communities can lose access to homes, roads, and essential services. It inspired me to explore how software could make disaster-related information easier to understand and use.
Weather forecasts, glacial lake inventories, historical flood records, and population estimates each provide part of the picture. Himalayan Sentinel brings these sources into a shared interface, with an emphasis on understanding where information comes from and what it can reliably tell us.
The guiding principle is simple: evidence first, human decisions.
What it does
Himalayan Sentinel is a disaster risk intelligence prototype focused on Nepal.
Users can:
- Explore district-level weather forecasts and modelled population context.
- Inspect glacial lake inventories and historical glacial lake outburst flood records.
- Navigate interactive maps and filter lake records.
- Review source descriptions, timestamps, coverage, and limitations.
- Explore simulated regional indicators that demonstrate how risk information could be communicated.
- Access a citizen reporting interface and a staff operations workspace.
The demonstrated workflow allows a user to select a district, inspect its forecast and population context, and explore relevant geographic evidence.
The operations workspace provides an overview of the report queue, provider availability, and underlying dataset records. The broader intended workflow connects citizen observations with administrator review and government-led decisions about public notices.
How I built it
I used an AI-assisted development workflow with Codex to help translate the project concept into application components and refine the interface.
The project combines a web dashboard with geographic and environmental data. The evidence view includes ICIMOD lake inventories and historical flood records, district boundaries, Open-Meteo forecasts, and WorldPop population estimates.
A central design decision was to make data provenance visible. Source descriptions and timestamps appear alongside the information they describe, so users can assess its relevance and freshness.
The interface also distinguishes historical evidence, live forecasts, modelled population context, and simulated demonstration indicators.
Challenges I ran into
The biggest challenge was combining datasets with different formats, dates, geographic coverage, and meanings.
A historical lake record does not establish a current emergency. A district population estimate does not tell us how many people are exposed to a flood. A weather forecast alone cannot reliably predict a glacial lake outburst.
These distinctions shaped both the interface and the project scope. I also needed to handle unavailable integrations transparently and keep a complex dashboard understandable.
Accomplishments that I’m proud of
- Bringing several kinds of environmental evidence into one navigable interface.
- Connecting district selection with weather and population context.
- Making geographic records accessible through interactive maps.
- Displaying source information and limitations alongside the data.
- Developing a foundation for community reporting and human-reviewed disaster communication.
What I learned
I learned that a useful disaster-related application needs more than an attractive map or a risk score. It needs clear data definitions, visible uncertainty, and a review process people can understand.
Working with AI-assisted development also reinforced the importance of breaking a large idea into smaller, verifiable features and checking generated work against the actual requirements.
What’s next for Himalayan Sentinel
The next priorities are to demonstrate and test the complete report-to-notice workflow, improve data validation, expand reliable integrations, and obtain feedback from people working in disaster preparedness.
Further development would also focus on accessibility, Nepali-language communication, and evaluating analytical methods against historical events before making predictive claims.
Current limitations
Himalayan Sentinel is an experimental prototype, not an official emergency warning service.
Regional monitoring scores and exposure figures shown in the demonstration are simulated. Population estimates provide district context, and historical records do not constitute current hazard forecasts. Some integrations are unavailable in the demo.
The current video demonstrates evidence exploration and the operations interface; it does not demonstrate the complete notice approval and publication workflow.
Built With
- css
- fastapi
- next.js
- open-meteo
- openai
- postgis
- postgresql
- python
- react
- tailwind
- typescript
