-
-
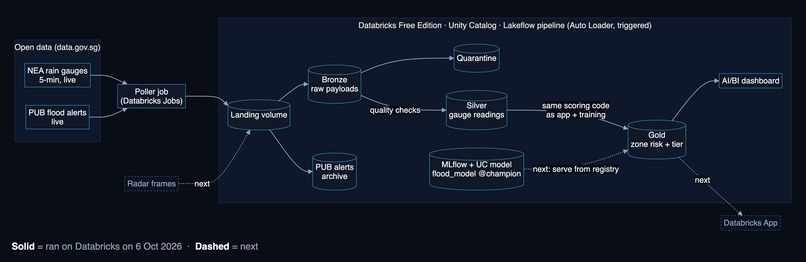
Databricks architecture
-
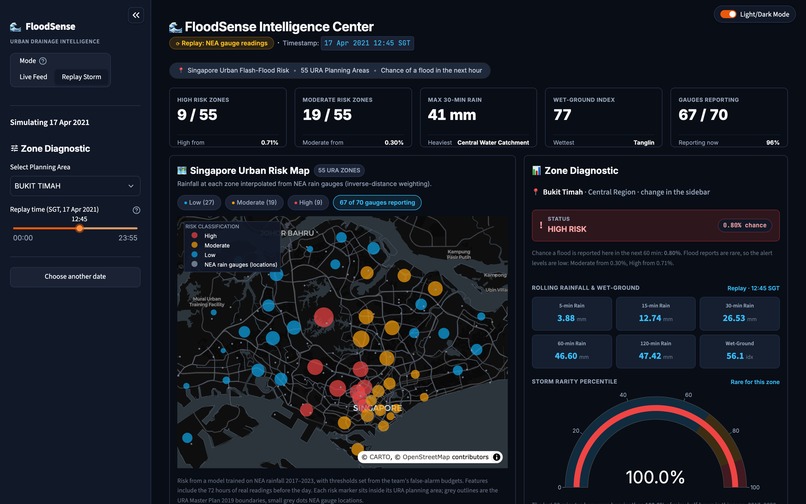
Replay of 17 Apr 2021
-
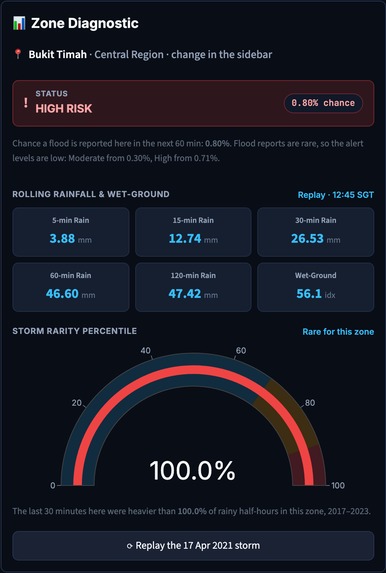
Zone diagnostic
-
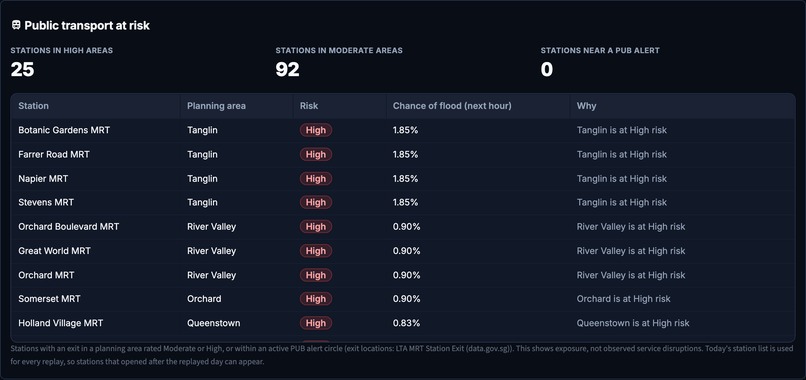
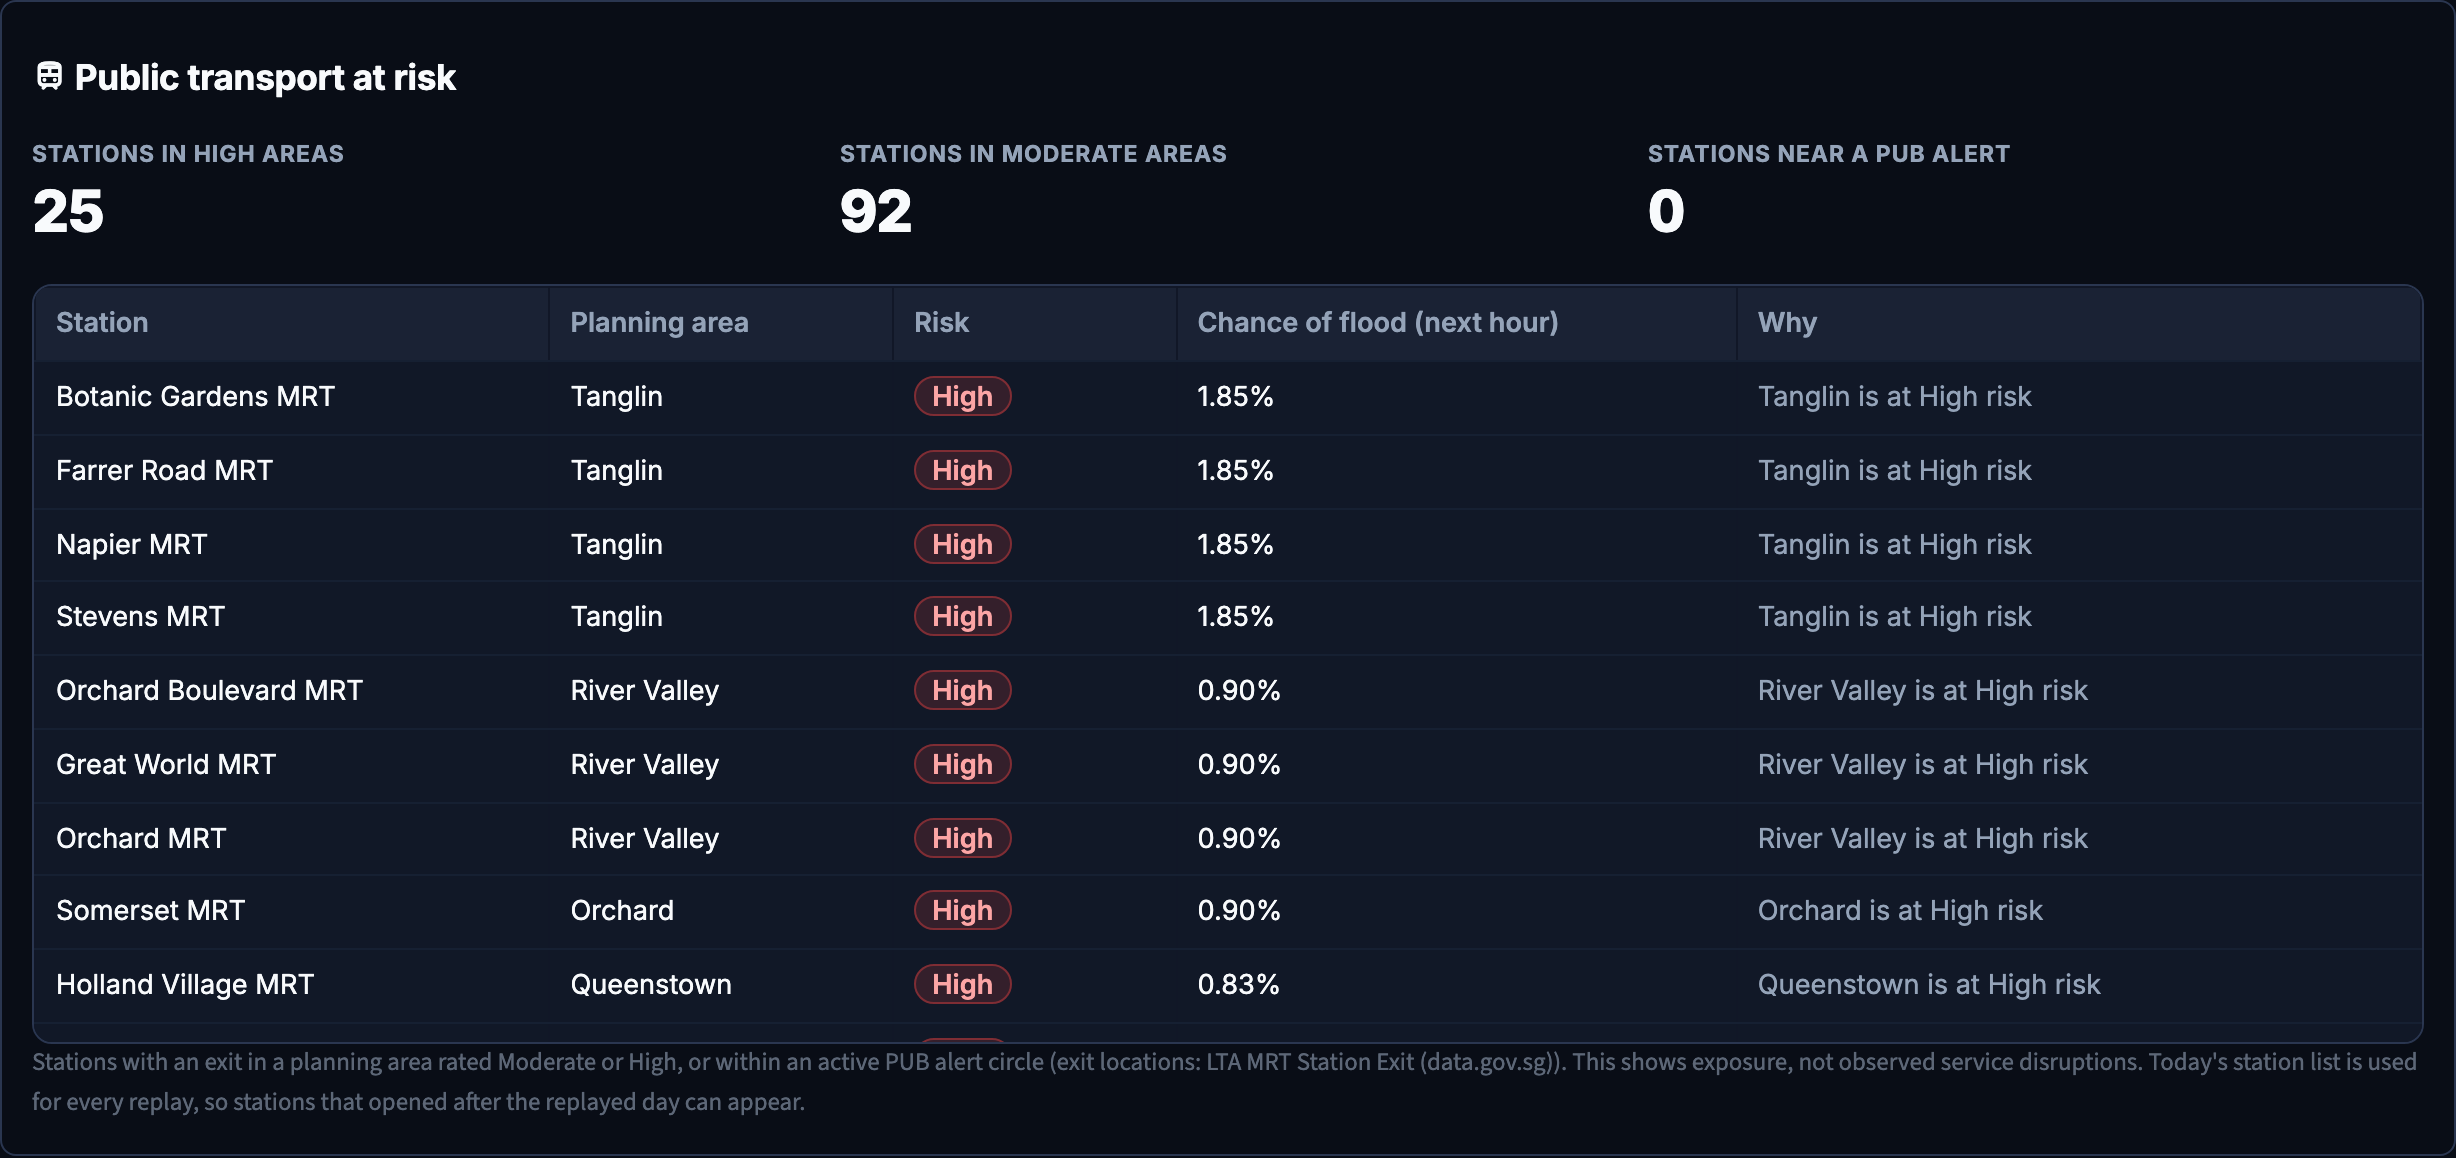
25 MRT stations in High-risk areas at 12:45
-
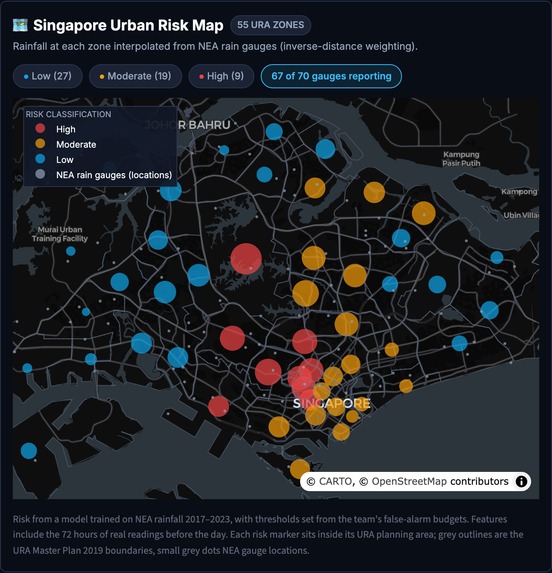
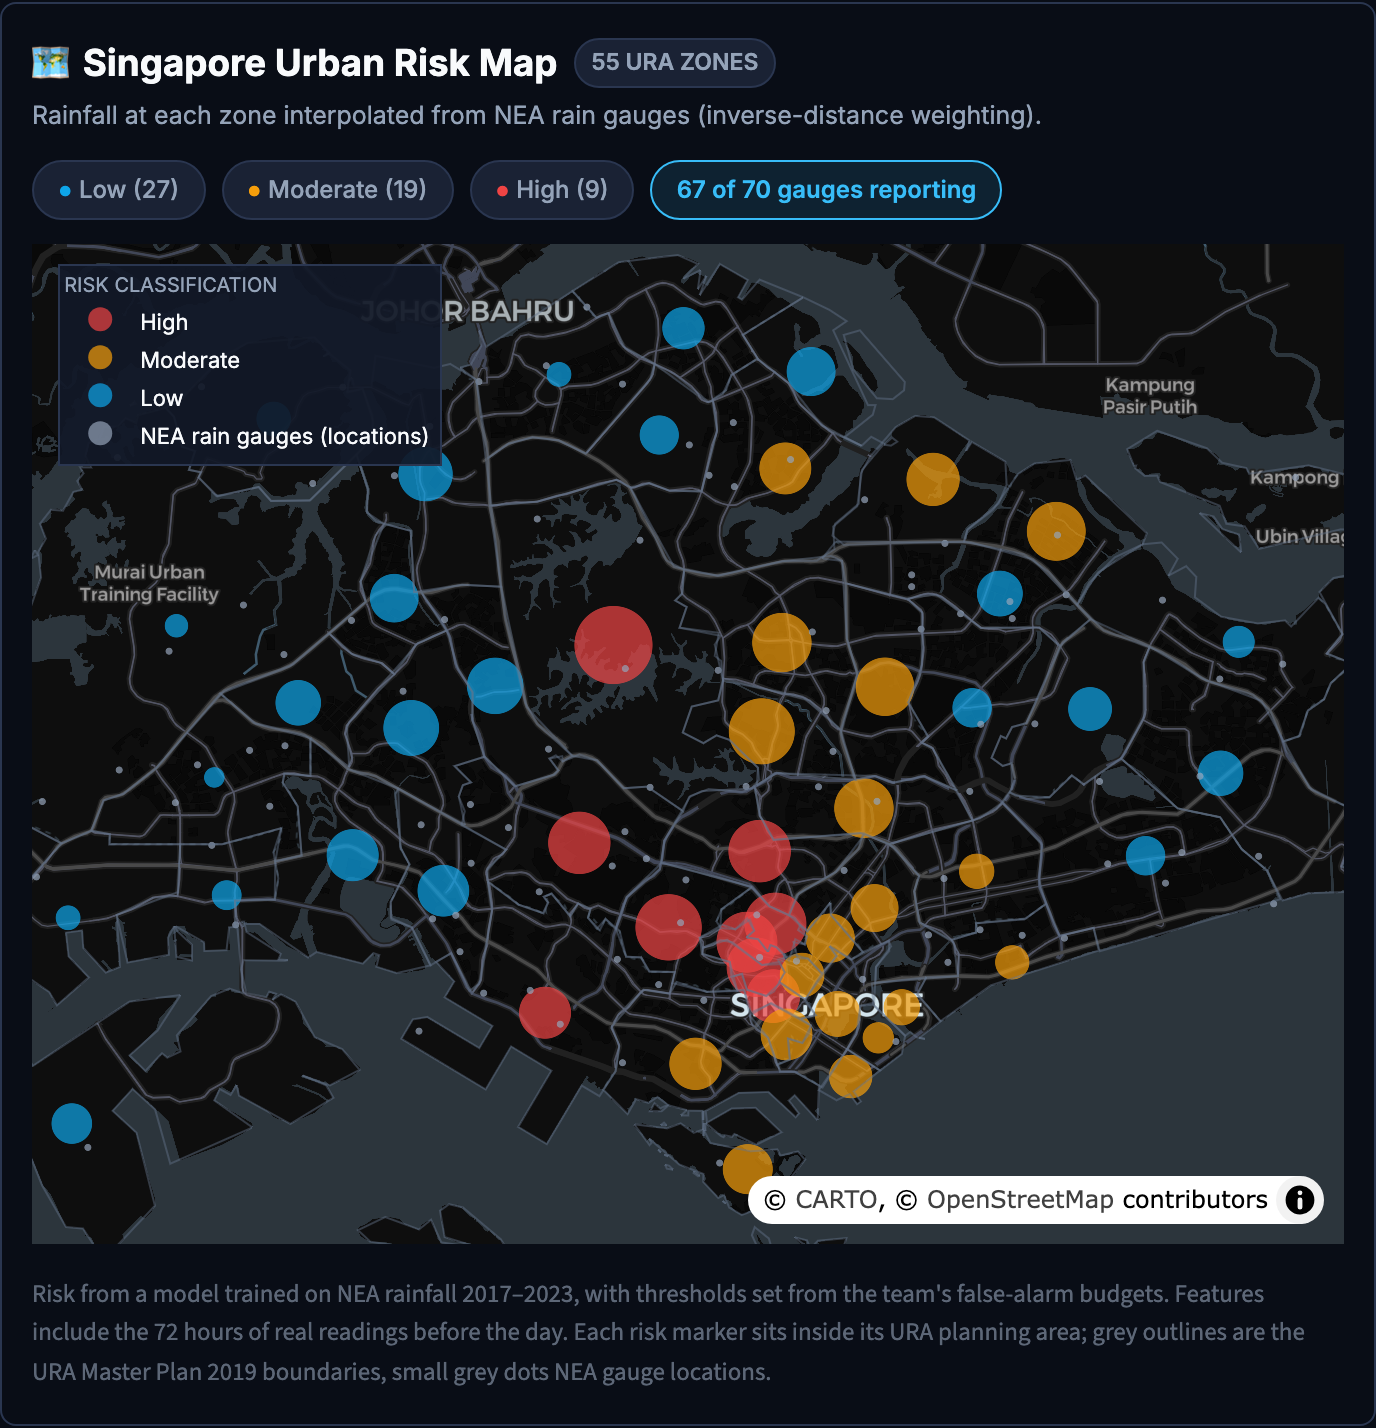
Risk map
-
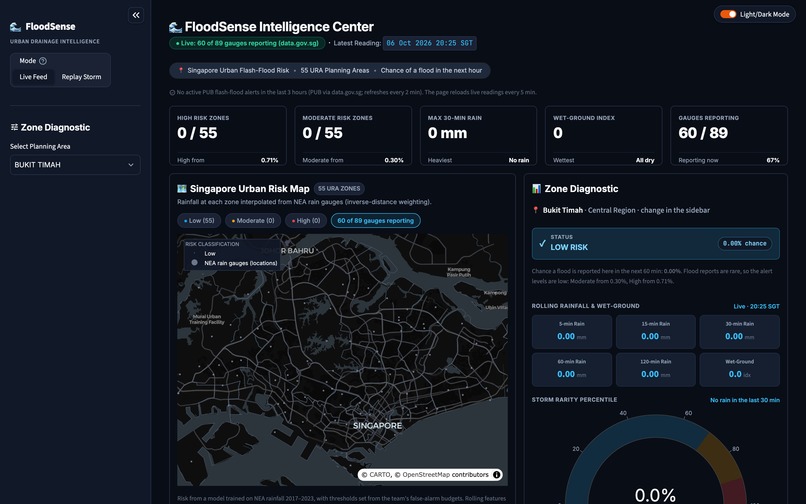
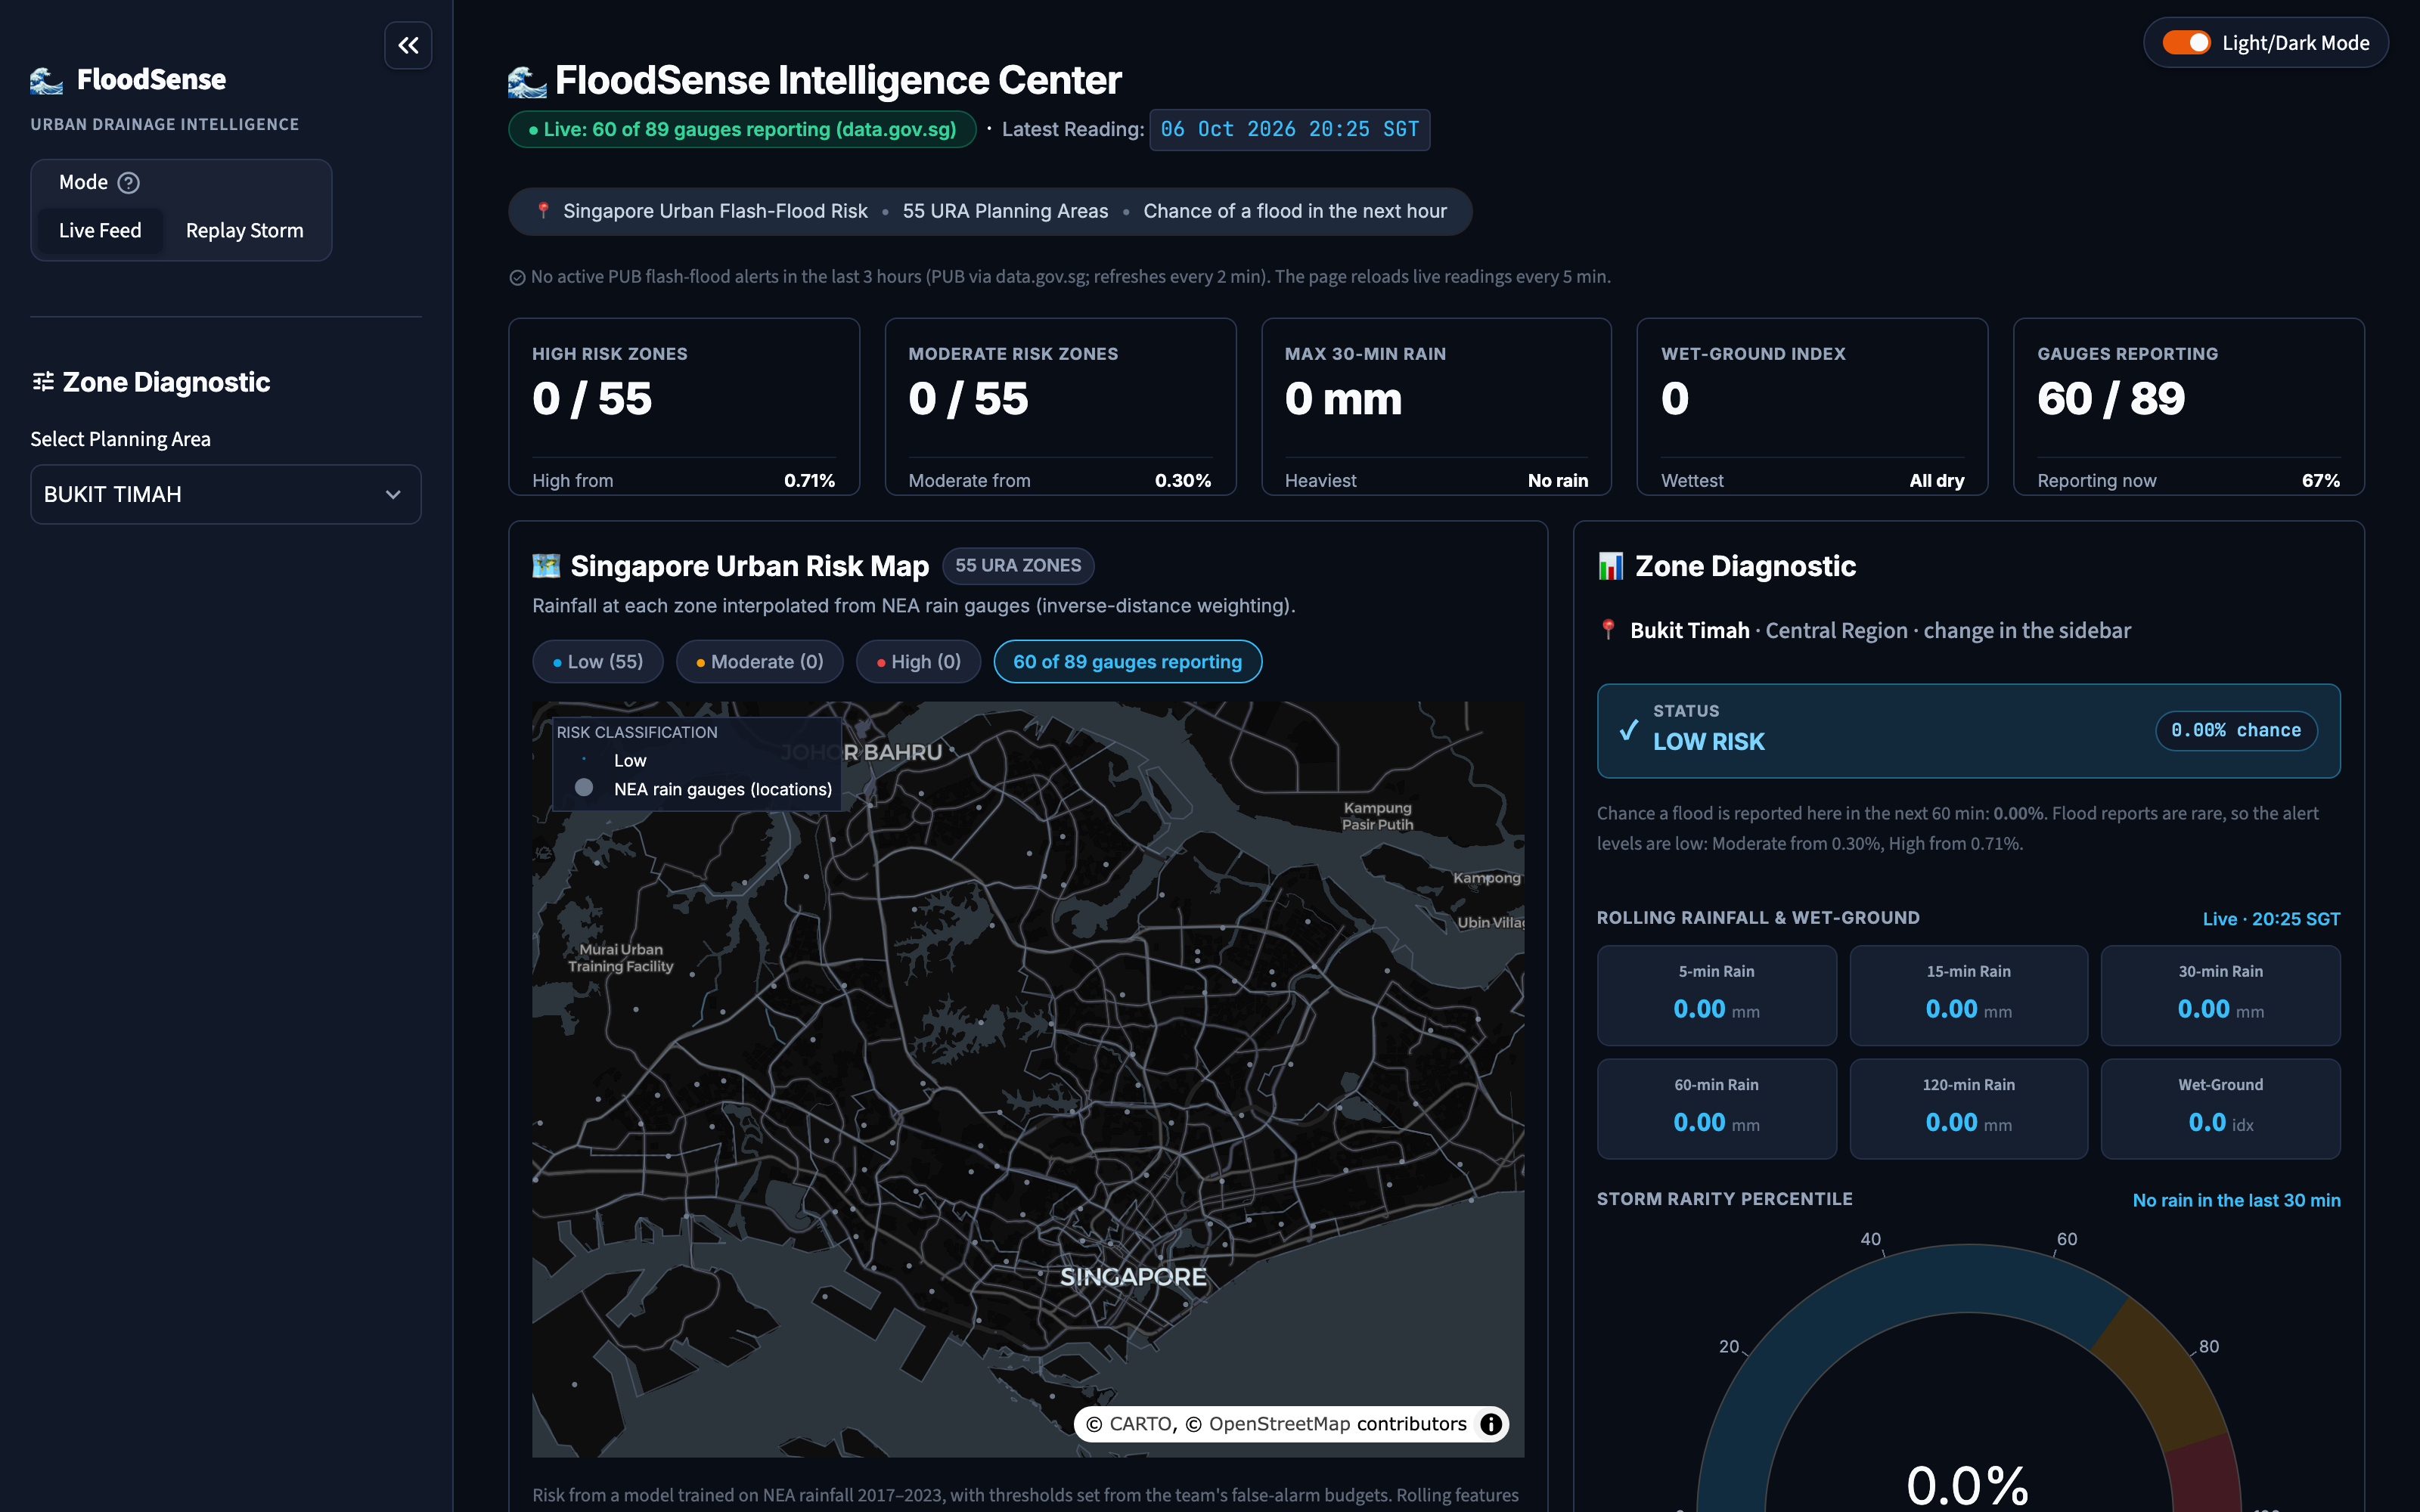
Live feed
-
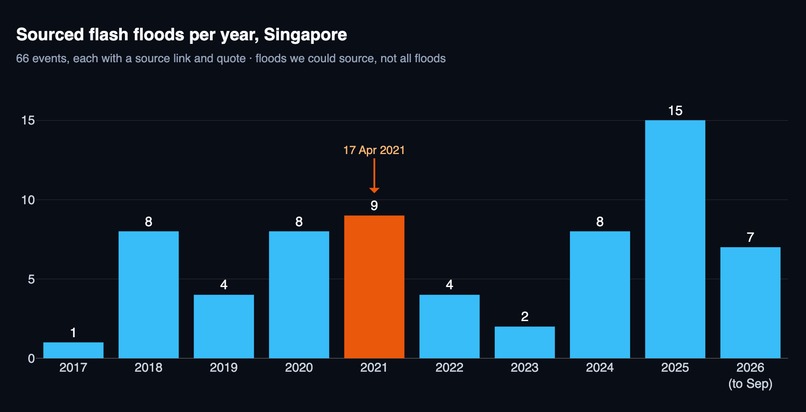
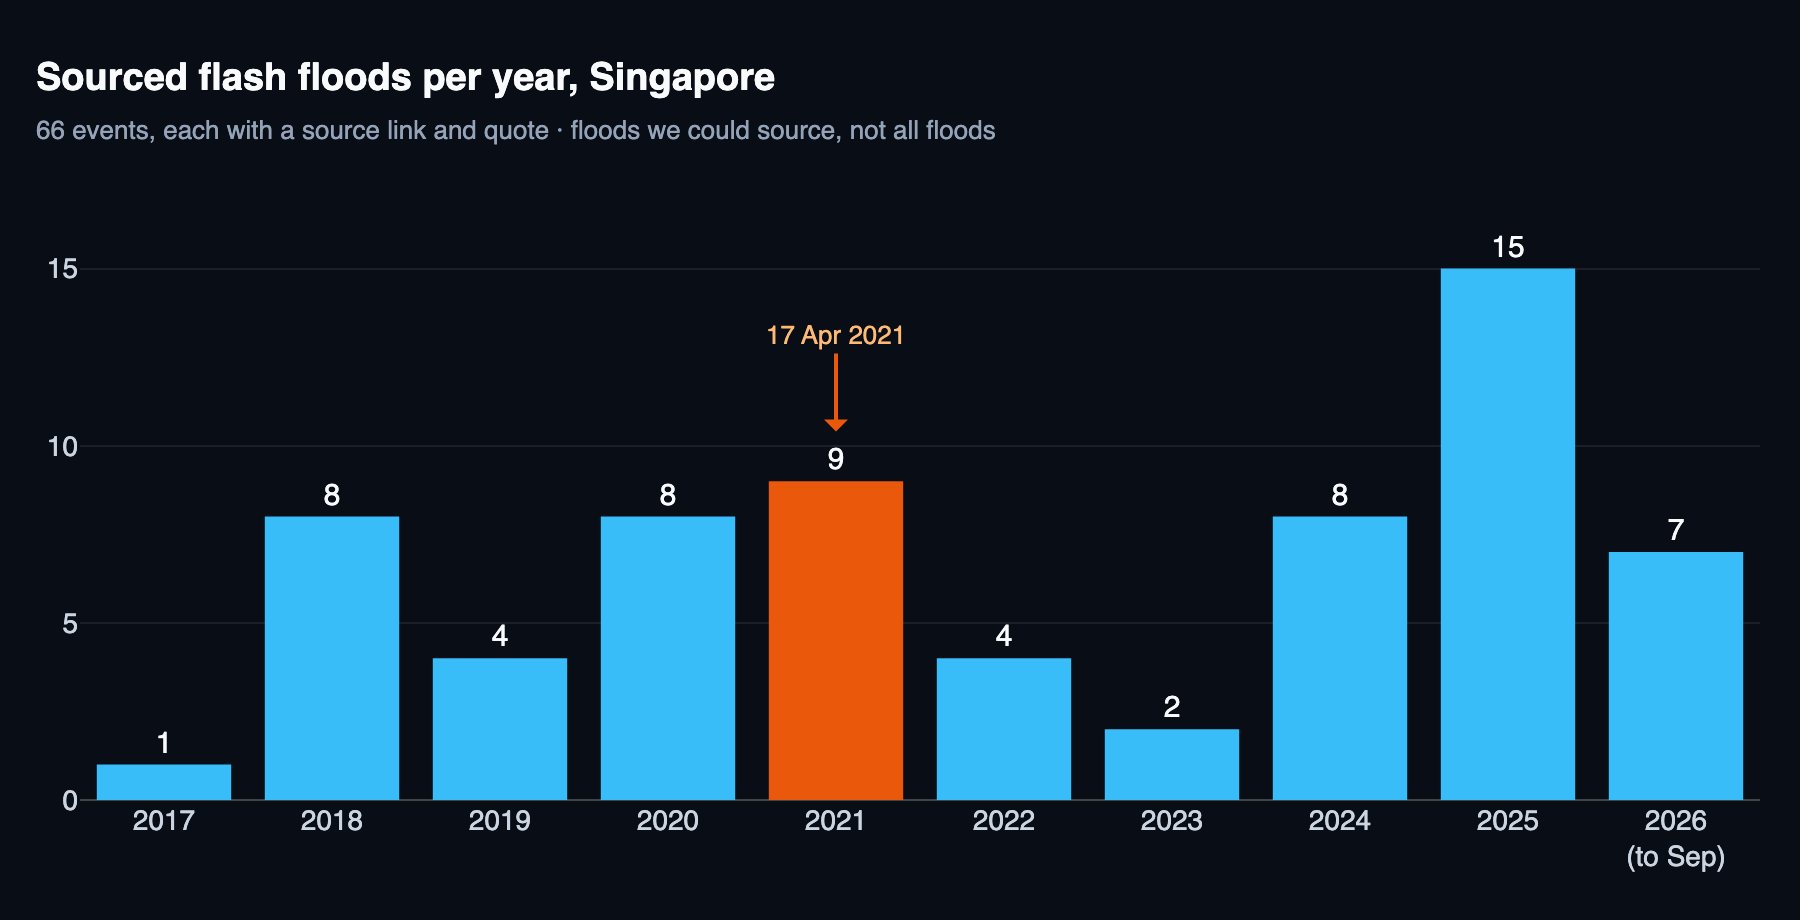
66 sourced flash floods, 2017 to Sep 2026
-
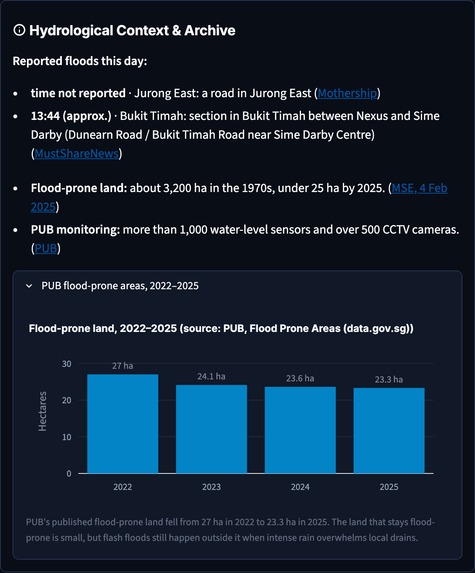
PUB flood-prone land
-
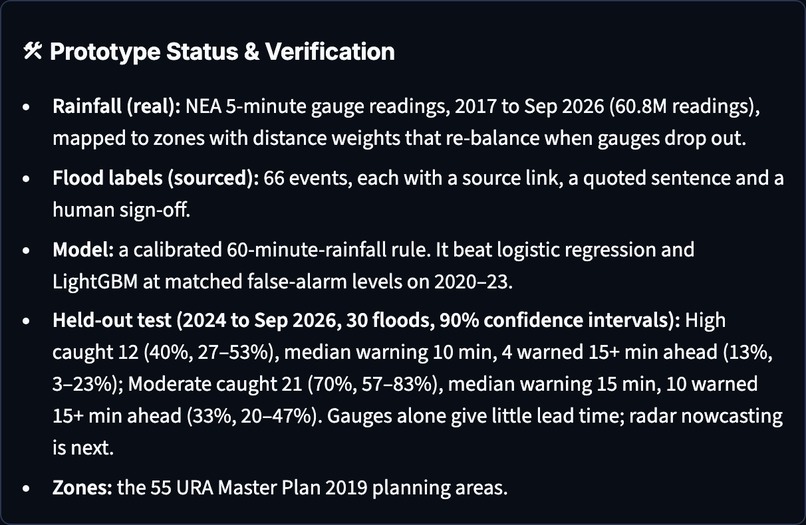
Held-out test results with 90% confidence intervals
-
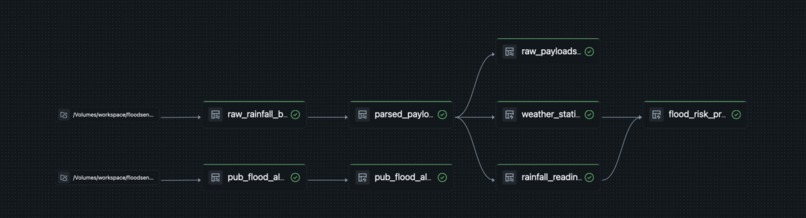
Lakeflow pipeline on Databricks
-
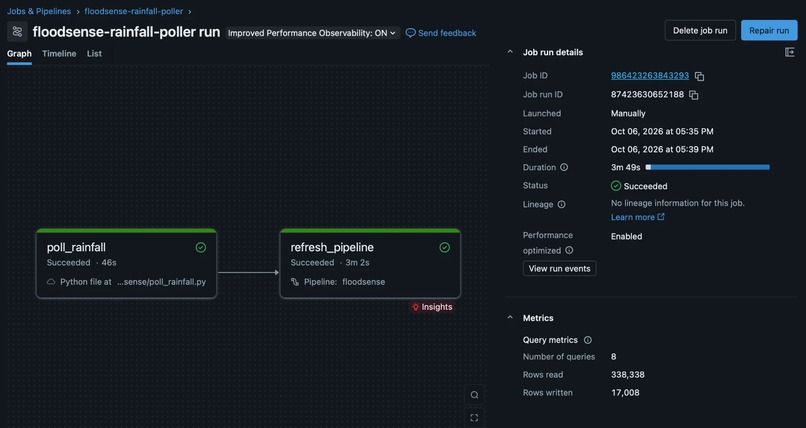
Poller job run
-
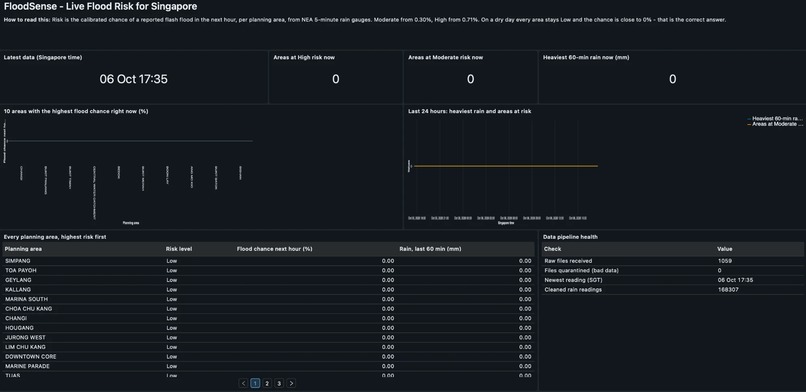
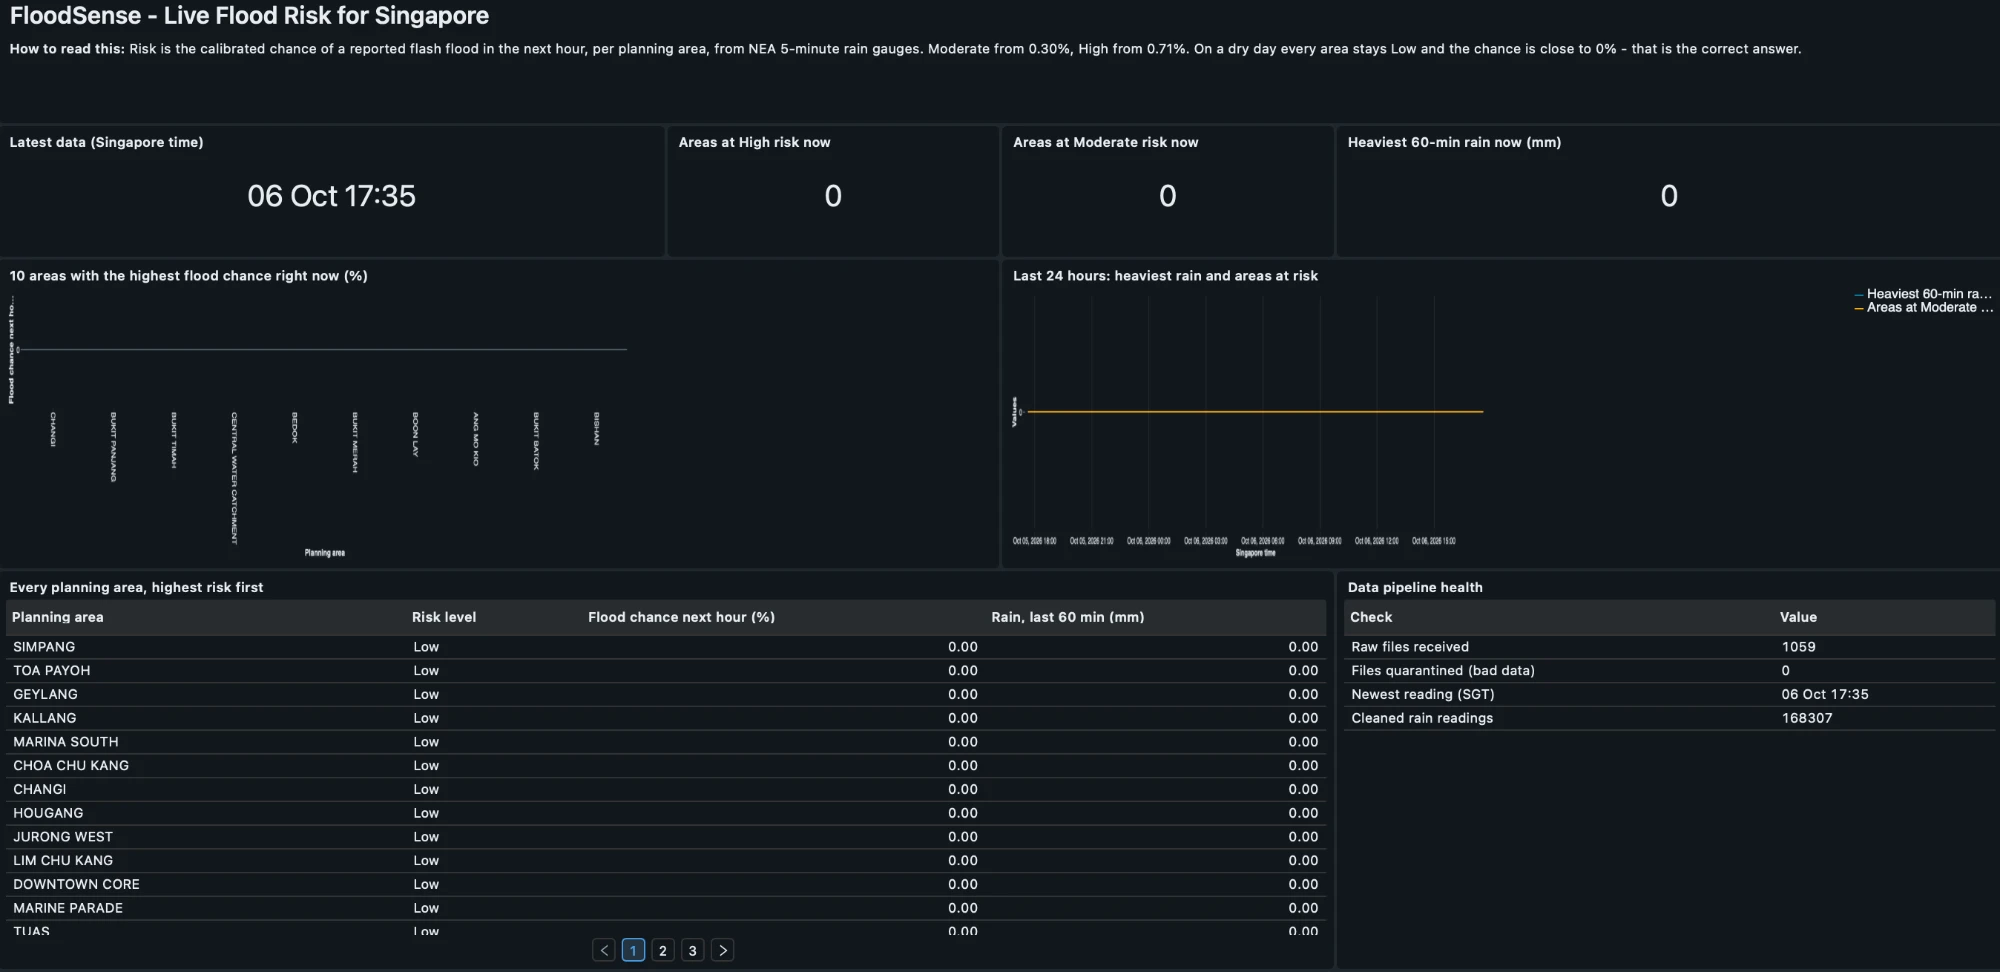
AI/BI dashboard on the gold table
-
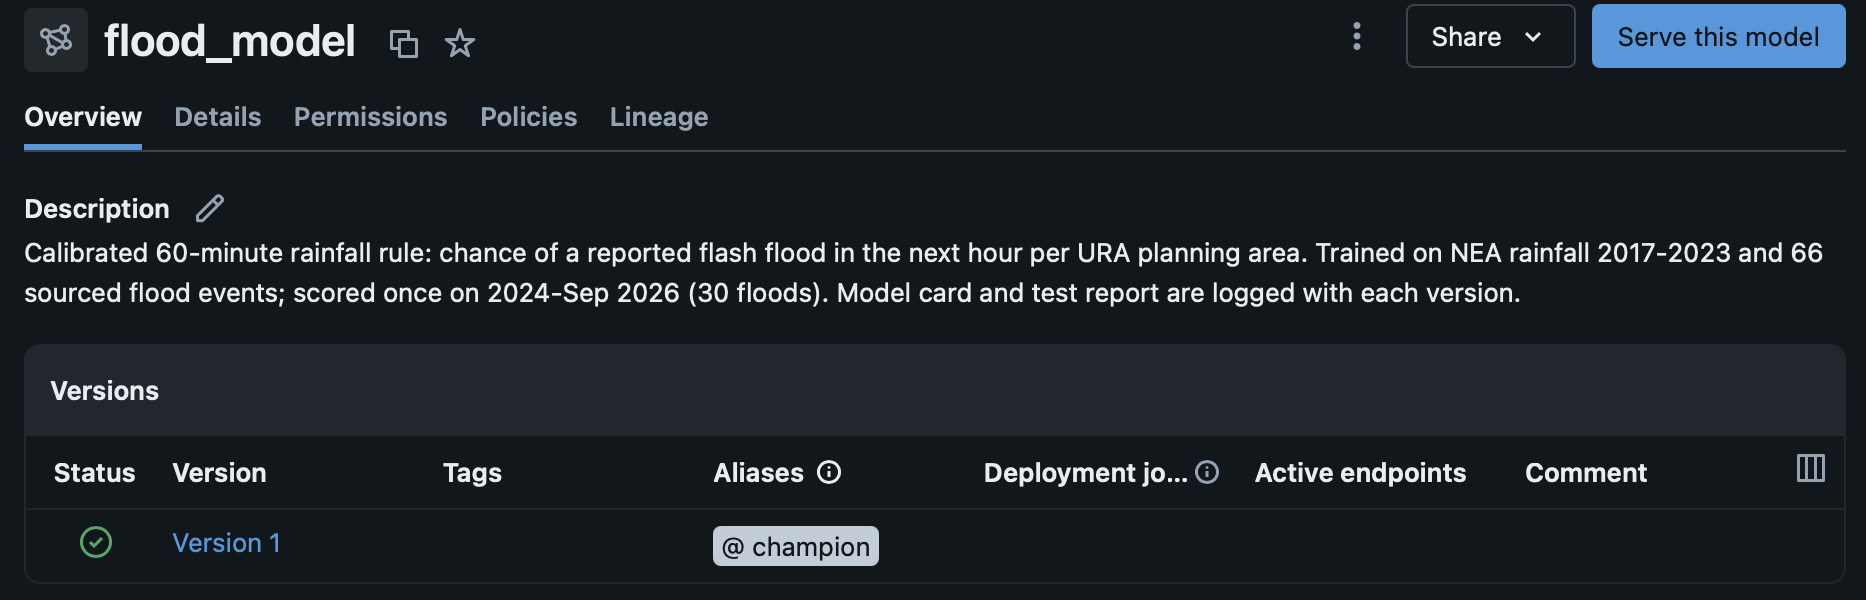
The model registered in Unity Catalog
Inspiration
On 17 April 2021, 161.4 mm of rain fell on western Singapore in three hours, 91% of April's average for the whole month. Dunearn Road flooded, and the water was gone within about 30 minutes. In 2025, Singapore had its wettest March on record.
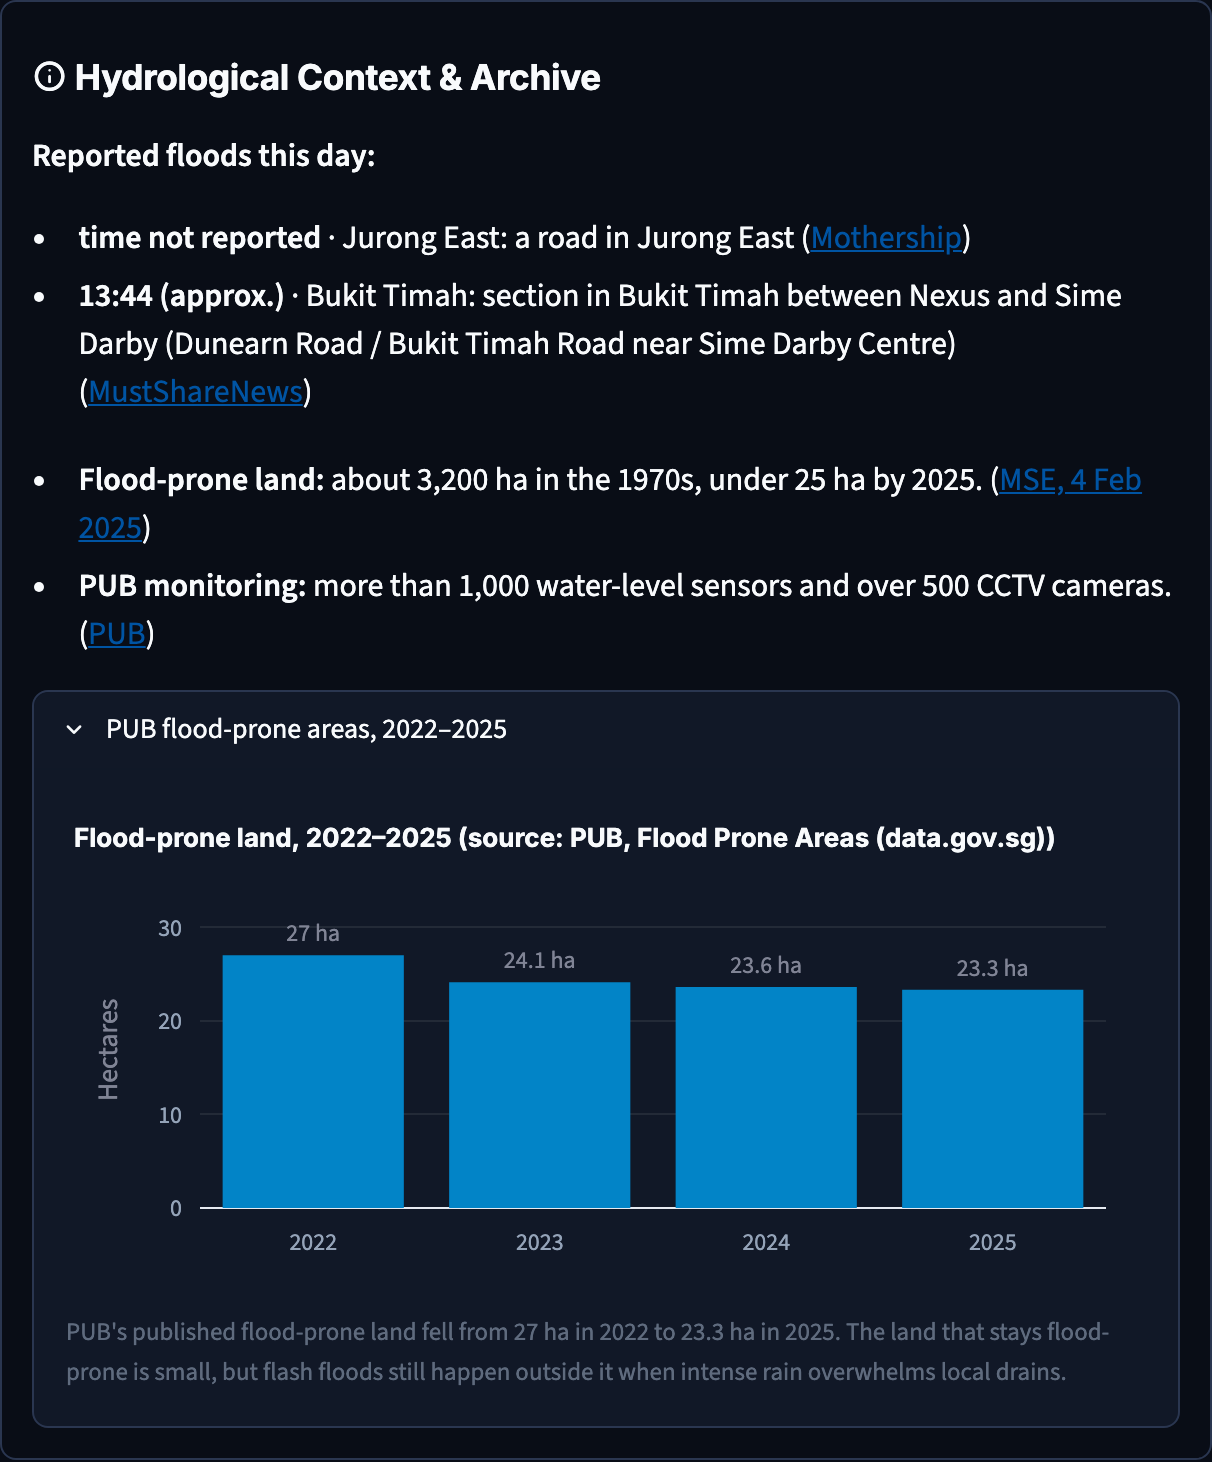
PUB's drainage system is world-class. Flood-prone land fell from about 3,200 ha in the 1970s to 23.3 ha in 2025. But public flood alerts are mostly regional, or fire once water in a drain is already rising. For a flash flood that clears in half an hour, that's late. We wanted to answer a simpler question for residents, drivers and town councils: will my area flood in the next hour, how likely is it, and why?
What it does
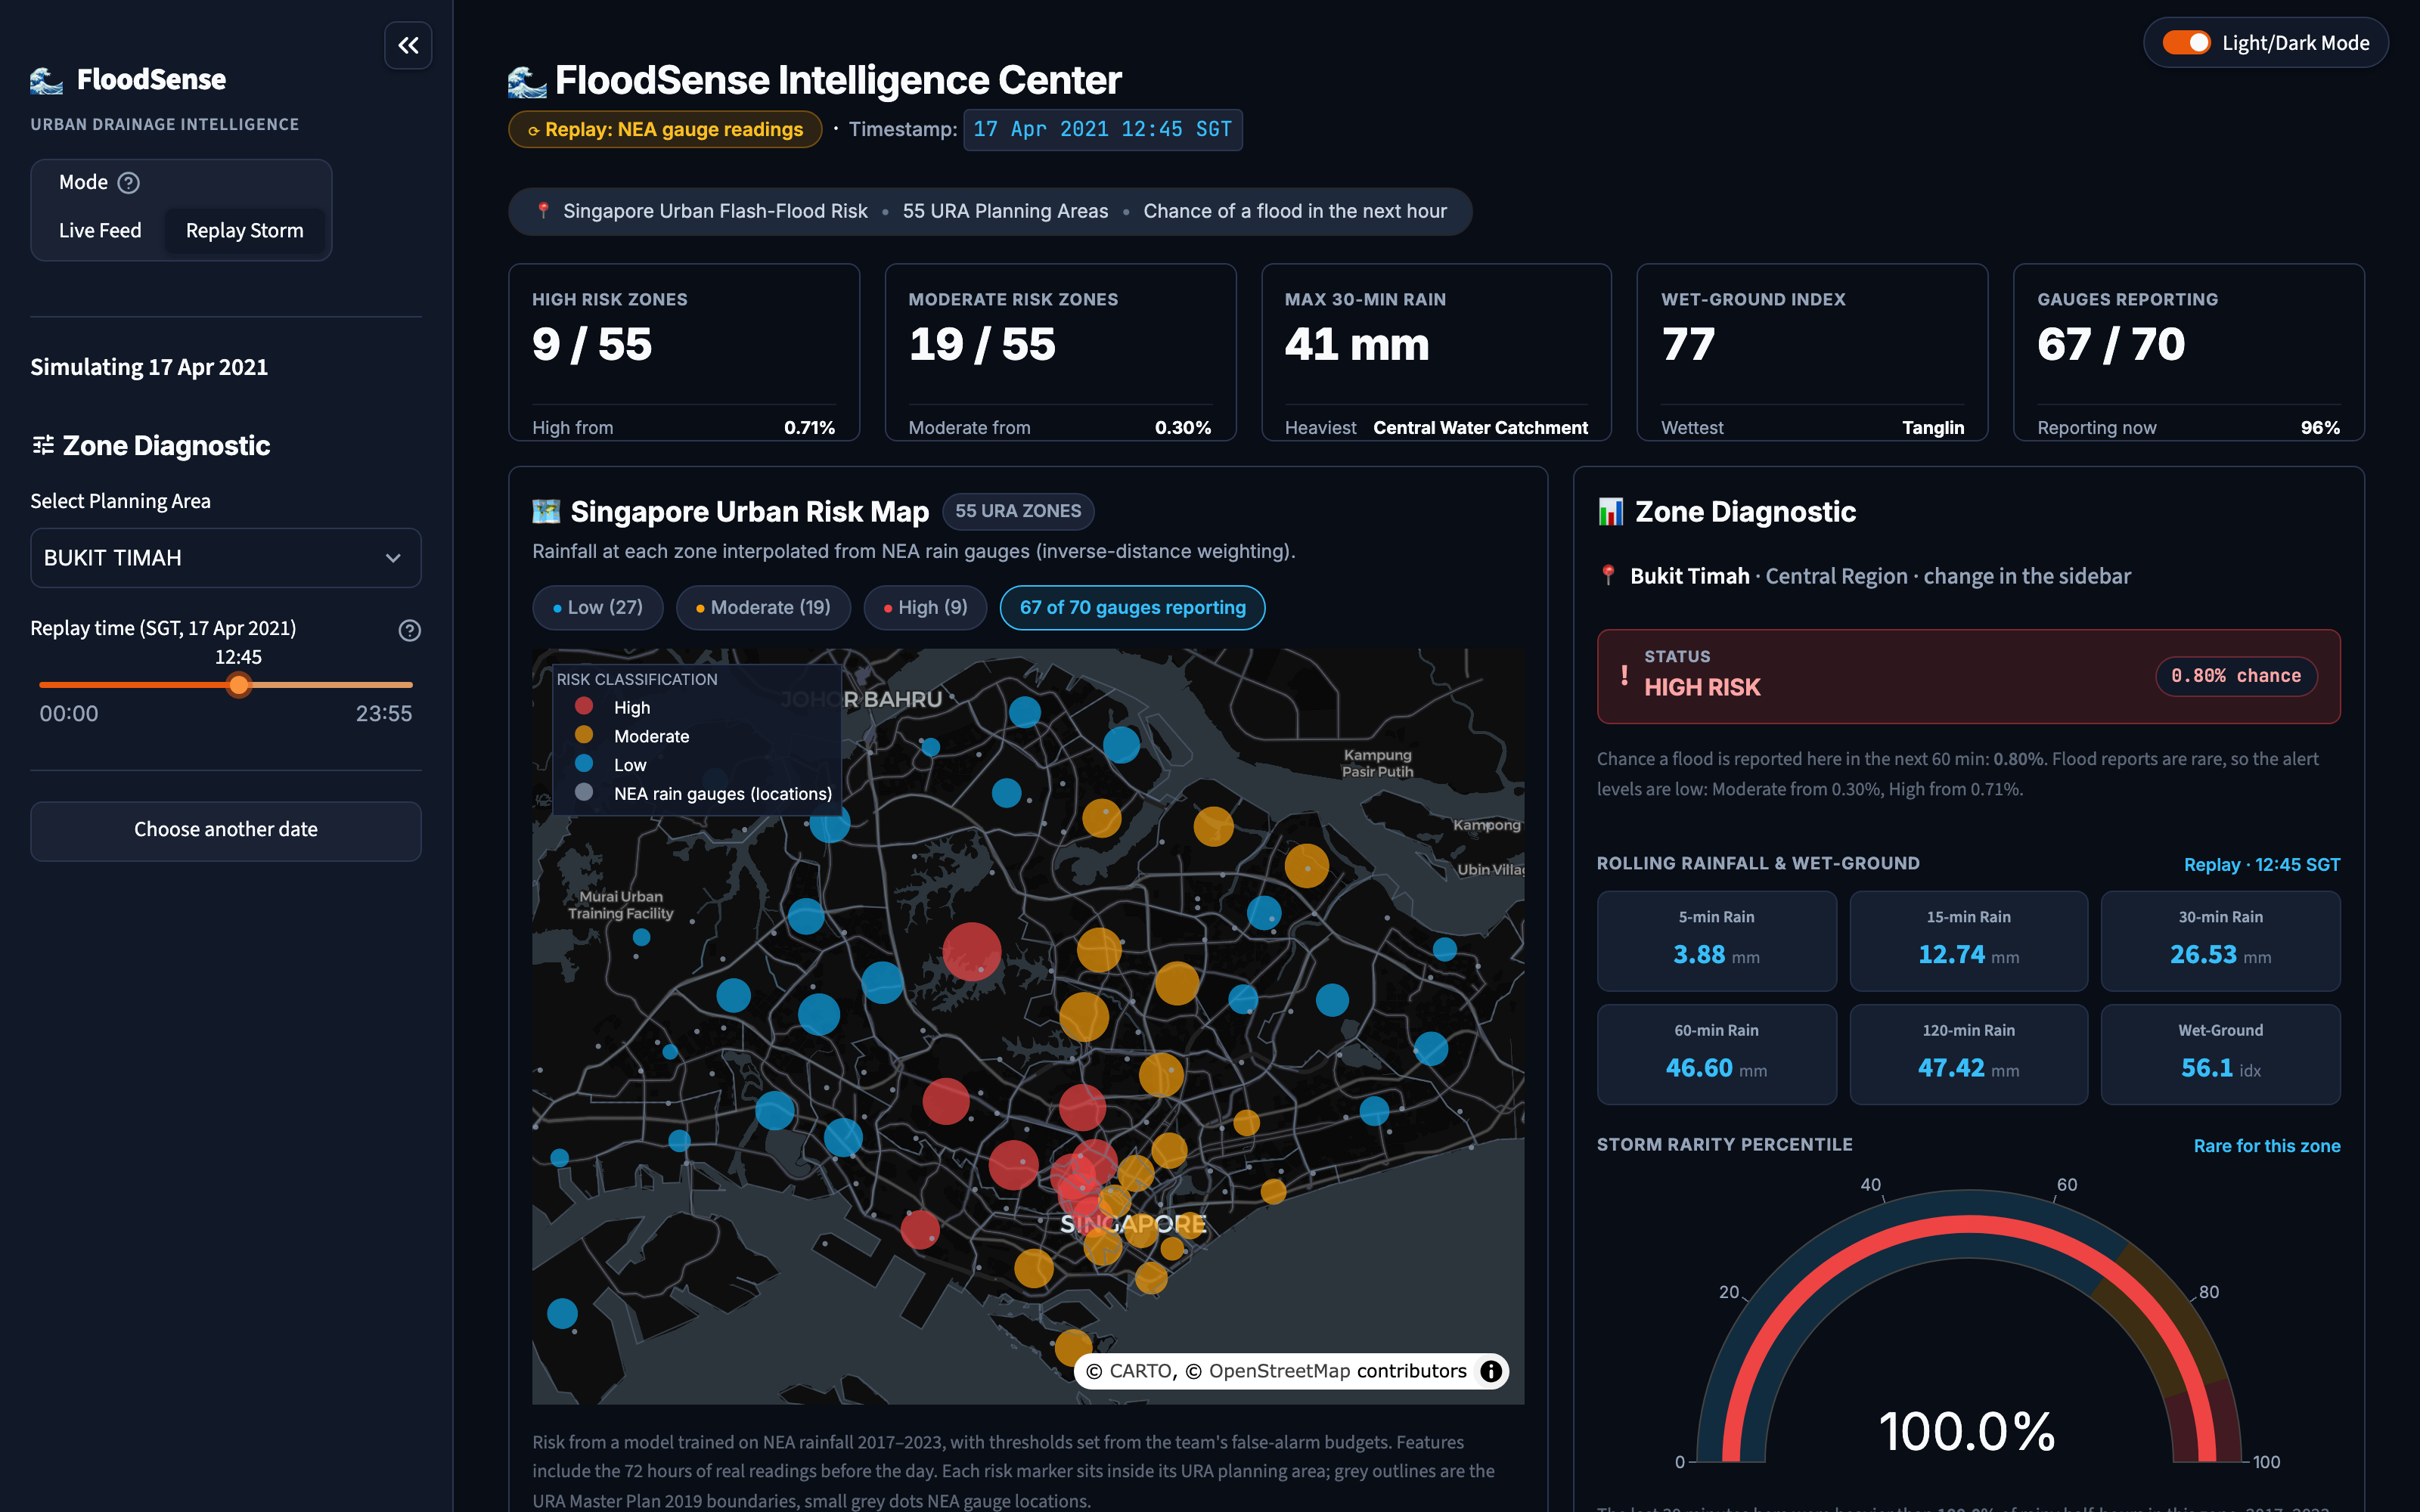
FloodSense gives each of Singapore's 55 URA planning areas a calibrated chance of a reported flash flood in the next hour, every 5 minutes, from NEA's live rain gauges.
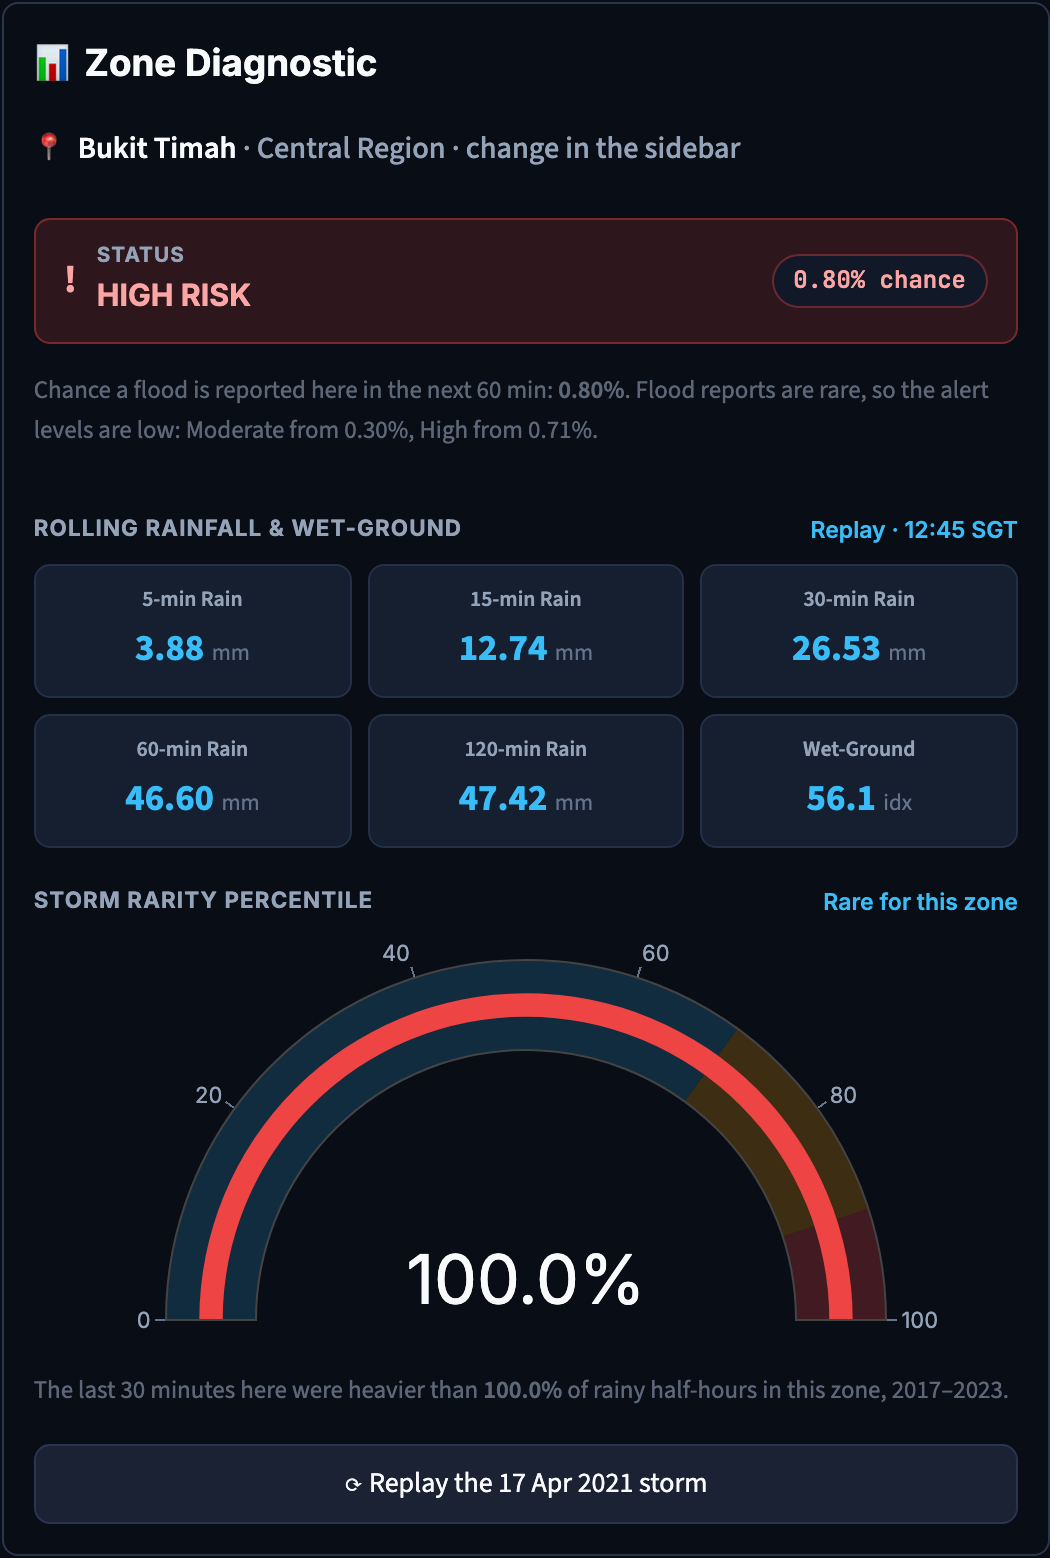
- Risk map: Low / Moderate / High for every zone, with the reason in plain words (e.g. "Bukit Timah: HIGH, 47 mm in the last hour, its rarest on record").
- PUB's live flood alerts appear beside our own risk.
- Public transport at risk: MRT/LRT stations with an exit in a Moderate or High area.
- Replay any day since 2017 using the real 5-minute readings. On 17 April 2021, Bukit Timah goes High at 12:45, about an hour before the Dunearn Road flood was reported.
- PUB's flood-prone-area trend for 2022–2025, for context.
How we built it
- Data (all open, from data.gov.sg):
- 60.8 million NEA 5-minute rainfall readings (2017 to Sep 2026), from the historical collection, the real-time API and a gap-fill for sparse days
- URA Master Plan 2019 planning-area boundaries
- PUB Flood Prone Areas (2022–2025)
- PUB's real-time flood alerts
- LTA MRT station exits
- Labels: we built 66 flood events by hand. Each has a source link, a quoted sentence naming the place and time, and a human sign-off. Imprecise report times become partial labels, not invented exact ones.
- Features: inverse-distance-weighted rain per zone. When a gauge drops out, it is left out and the rest are re-weighted, so missing data is never treated as dry. We also compute rolling 5- to 120-minute totals, a 72-hour wet-ground index and per-zone storm rarity.
- Model:
- Rules, logistic regression and LightGBM competed at matched false-alarm levels, using year-by-year forward-chaining validation.
- A Platt-calibrated 60-minute rainfall rule won.
- Alert thresholds come from false-alarm budgets we fixed before touching the test set.
- The 2024–2026 test years were scored once.
- Databricks (Free Edition):
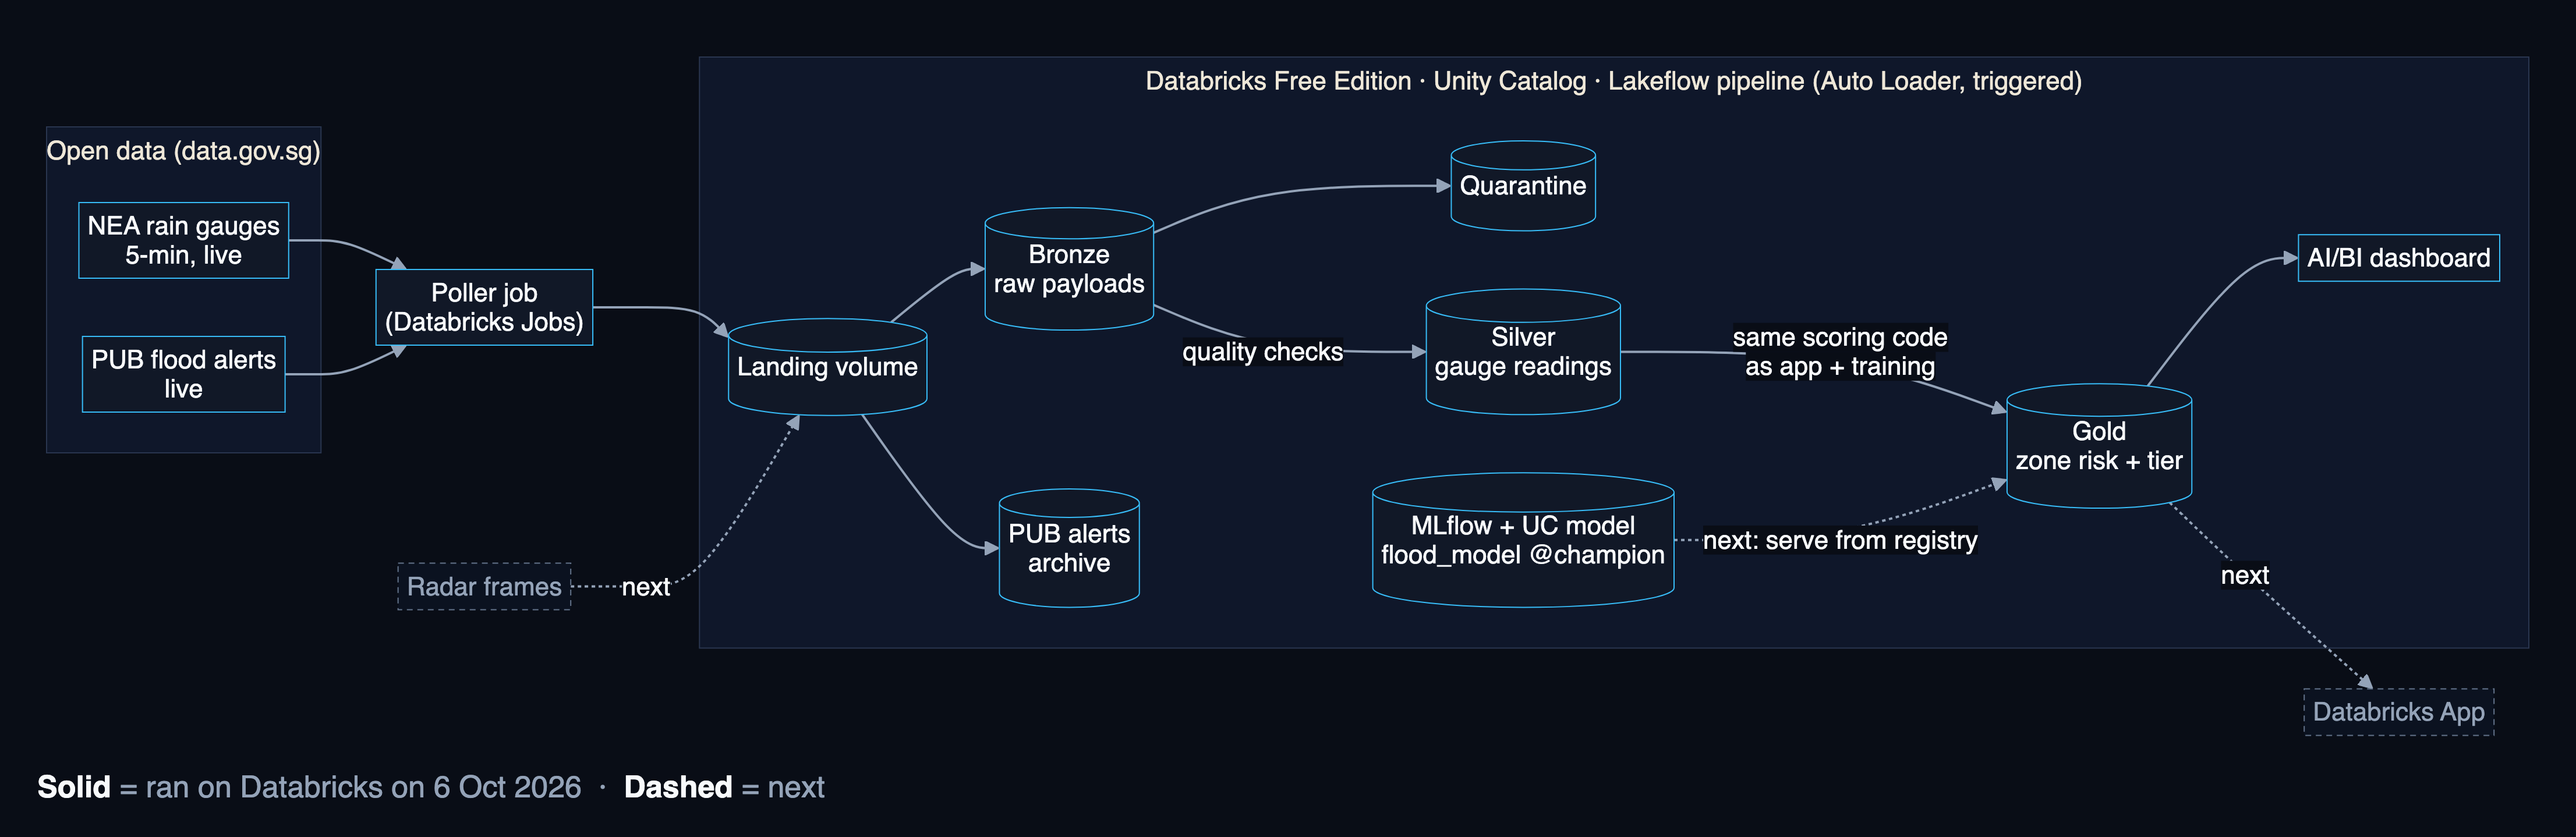
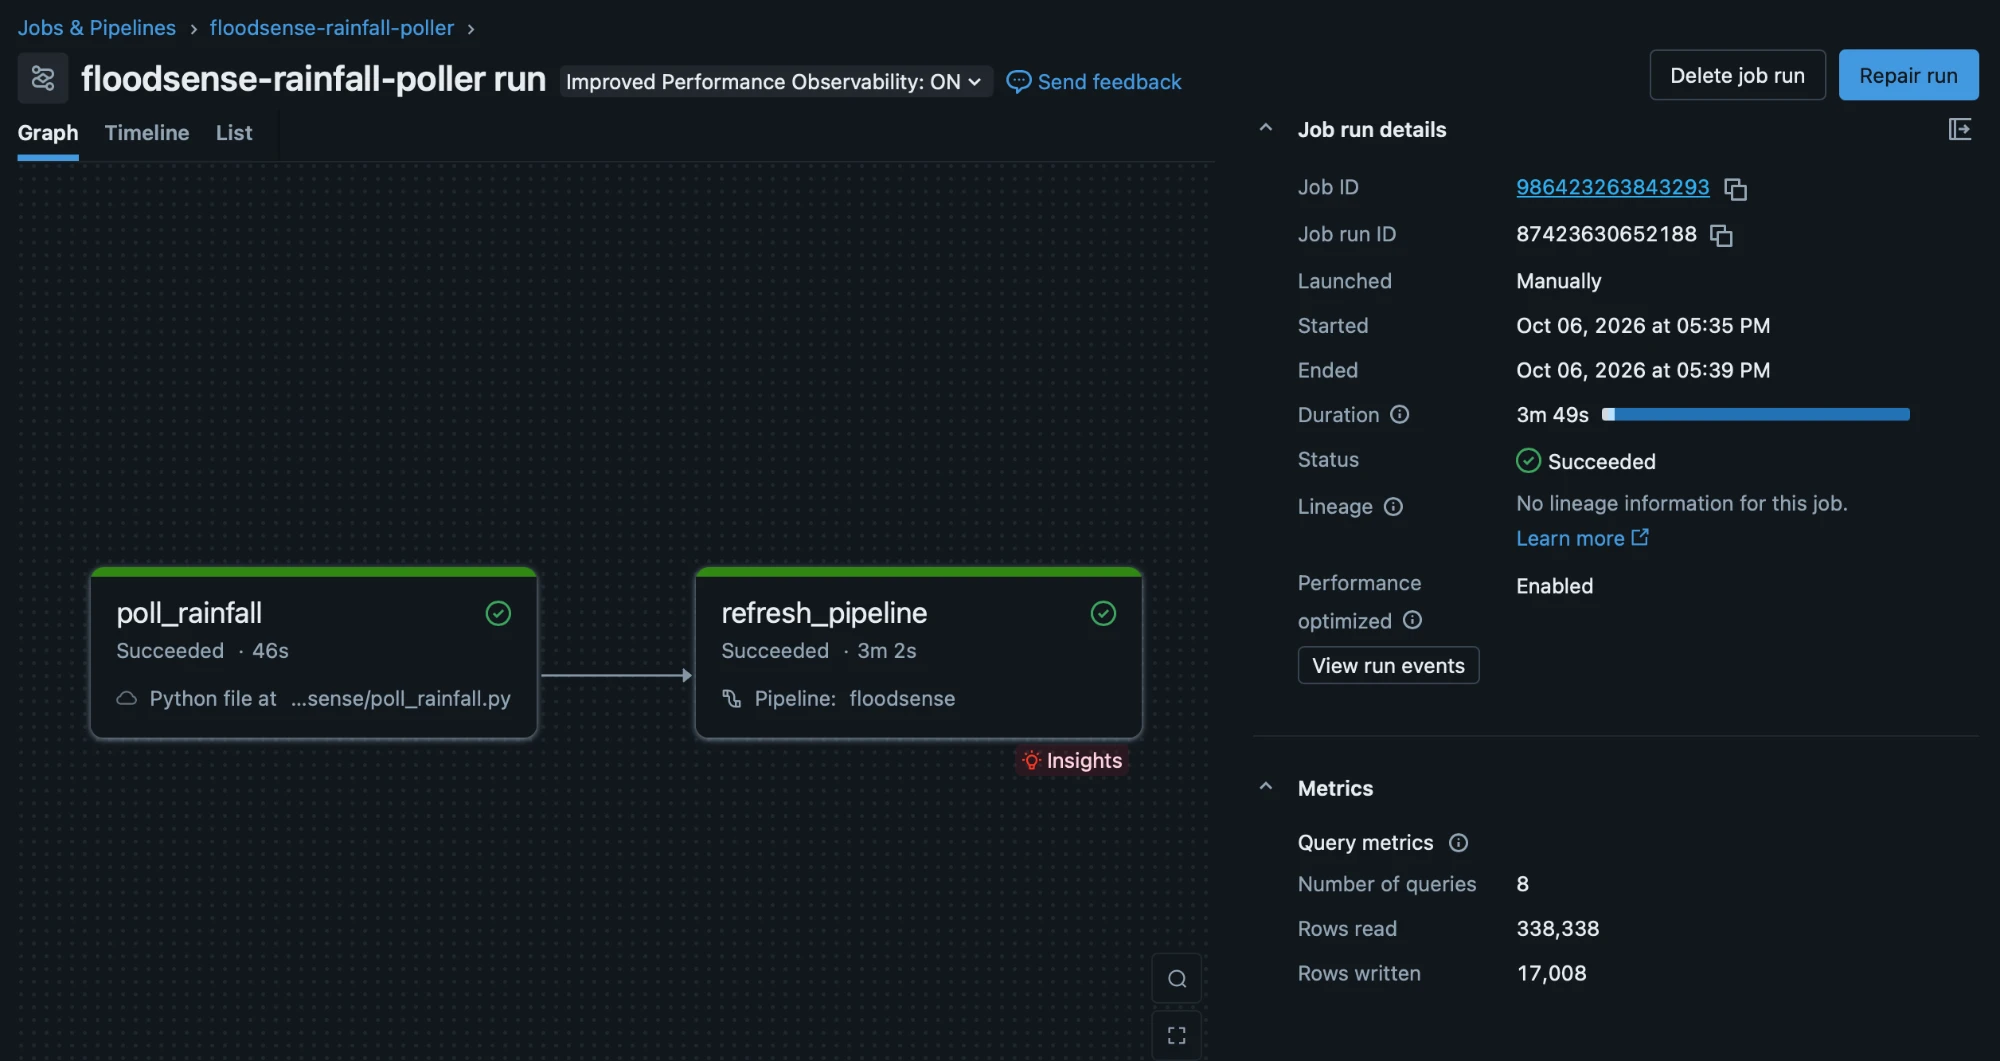
- A scheduled poller job lands live NEA readings and PUB alerts in a Unity Catalog volume.
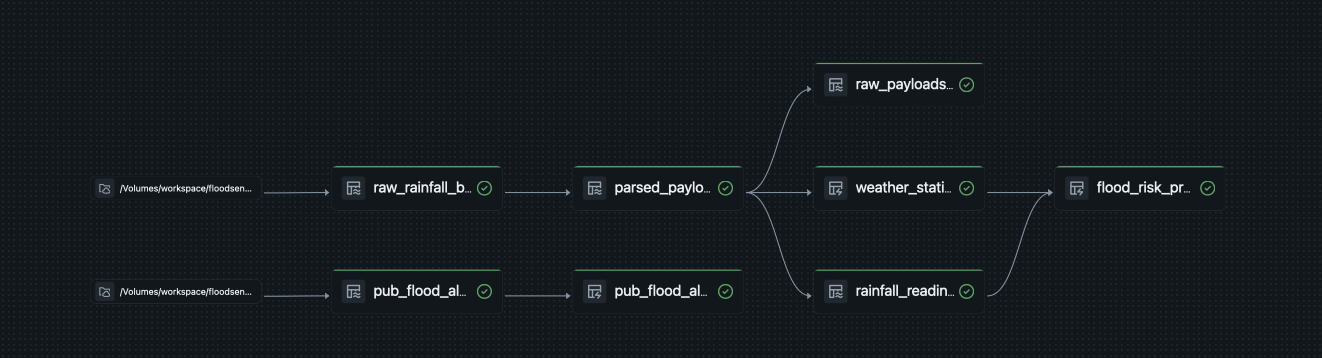
- One Lakeflow pipeline (Auto Loader) takes them through bronze → silver (quality checks and quarantine) → gold (zone risk), using the same scoring code as the app.
- An AI/BI dashboard reads gold.
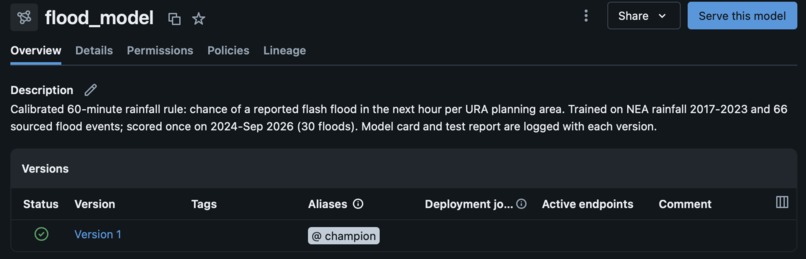
- The model is versioned in MLflow and registered in Unity Catalog.
- A parity test proves Databricks reproduces local scoring row for row.
- App: Streamlit with live and replay modes, plus light and dark themes.
- Engineering: CI with ruff, mypy and 190+ tests, including data-contract tests that check what the data actually contains.
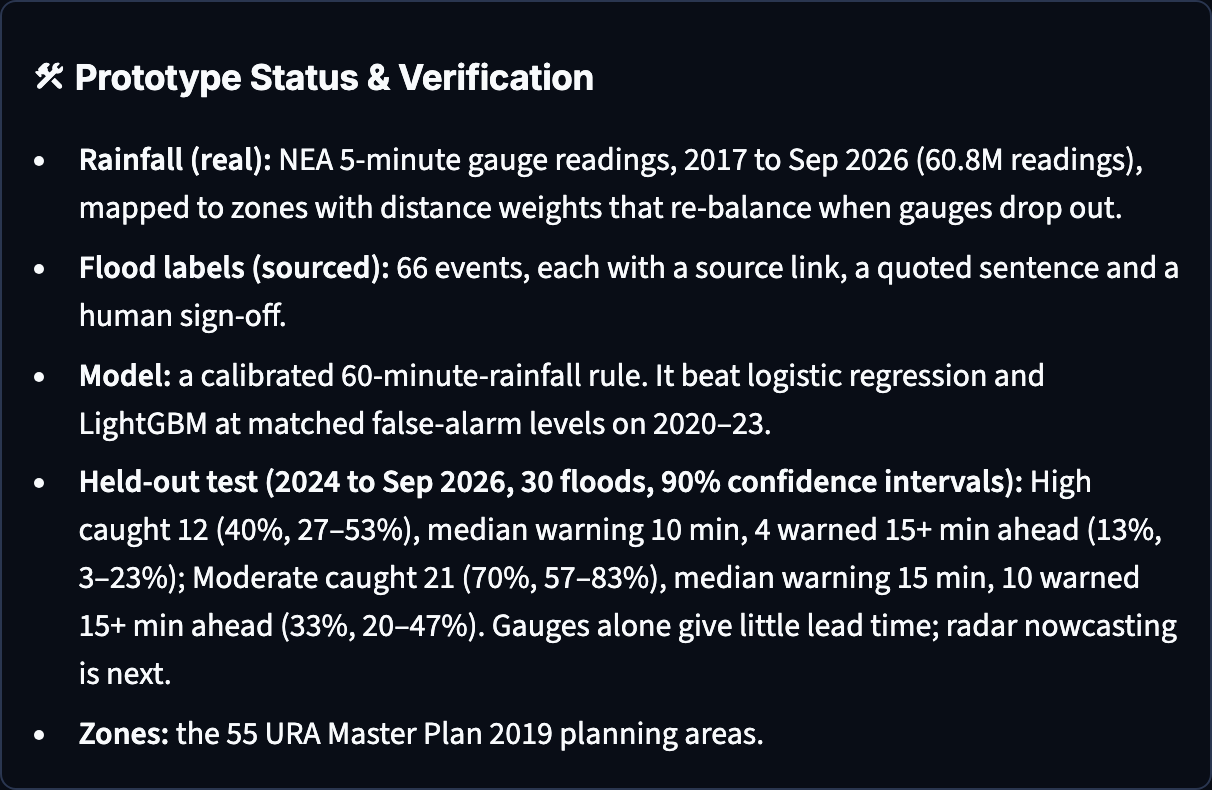
Results (held-out test, 2024 to Sep 2026, 30 floods, scored once)
| Alert level | Floods caught (90% CI) | Median warning | False alarms per zone-year |
|---|---|---|---|
| Moderate | 70% (57–83%) | 15 min | 7.3 |
| High | 40% (27–53%) | 10 min | 1.6 |
Challenges we ran into
- Floods are extremely rare. We had only 36 floods to train on. LightGBM and logistic regression overfit, and the simplest model was the most robust. We ship it and say so.
- Honest labels are hard. Flood reports are scattered across PUB posts and news, often with only a date. We verified each by hand, and we rejected and documented the ones we couldn't verify.
- Missing isn't dry. NEA's record has gaps, including most of August 2018. We gap-filled from the API and never let a missing gauge read as zero rain.
- Databricks runs differ from local runs. Our first workspace runs caught two bugs the local run hadn't:
- an Auto Loader option name
- gold being computed before silver was ready We also hit a timezone shift risk from Spark's naive timestamps. A parity test now guards all three.
- The live alert feed keeps no history. PUB's alert API returns nothing for past dates, so we can't train on it yet. We archive every alert from now on.
What we learned
- With rare events, evaluation design matters more than model choice: matched false-alarm budgets, forward-chaining validation, and a test set scored once.
- Saying what's not built yet is as important as what is. Gauges alone give about 10–15 minutes of warning. The most impactful next step is radar nowcasting, which would warn before the rain arrives.
- Running the same scoring code in the app, in training and on Databricks prevents silent drift.
What's next
- Radar nowcasting, for longer warning times.
- Zone susceptibility (which zones flood more), tide for coastal zones.
- The app reading gold directly, and the model served from the Unity Catalog registry.
- LTA live disruption feeds and bus stops.
- An LLM-assisted pipeline that drafts flood events from news and PUB alerts, with human sign-off.
Built With
- apache-spark
- auto-loader
- data.gov.sg
- databricks
- databricks-ai-bi-dashboards
- databricks-jobs
- databricks-sql
- delta-lake
- github-actions
- lakeflow-declarative-pipelines
- lightgbm
- mlflow
- nea-rainfall-api
- numpy
- pandas
- playwright
- plotly
- pydantic
- pytest
- python
- scikit-learn
- shapely
- streamlit
- unity-catalog
- ura-master-plan-2019

Log in or sign up for Devpost to join the conversation.