Inspiration
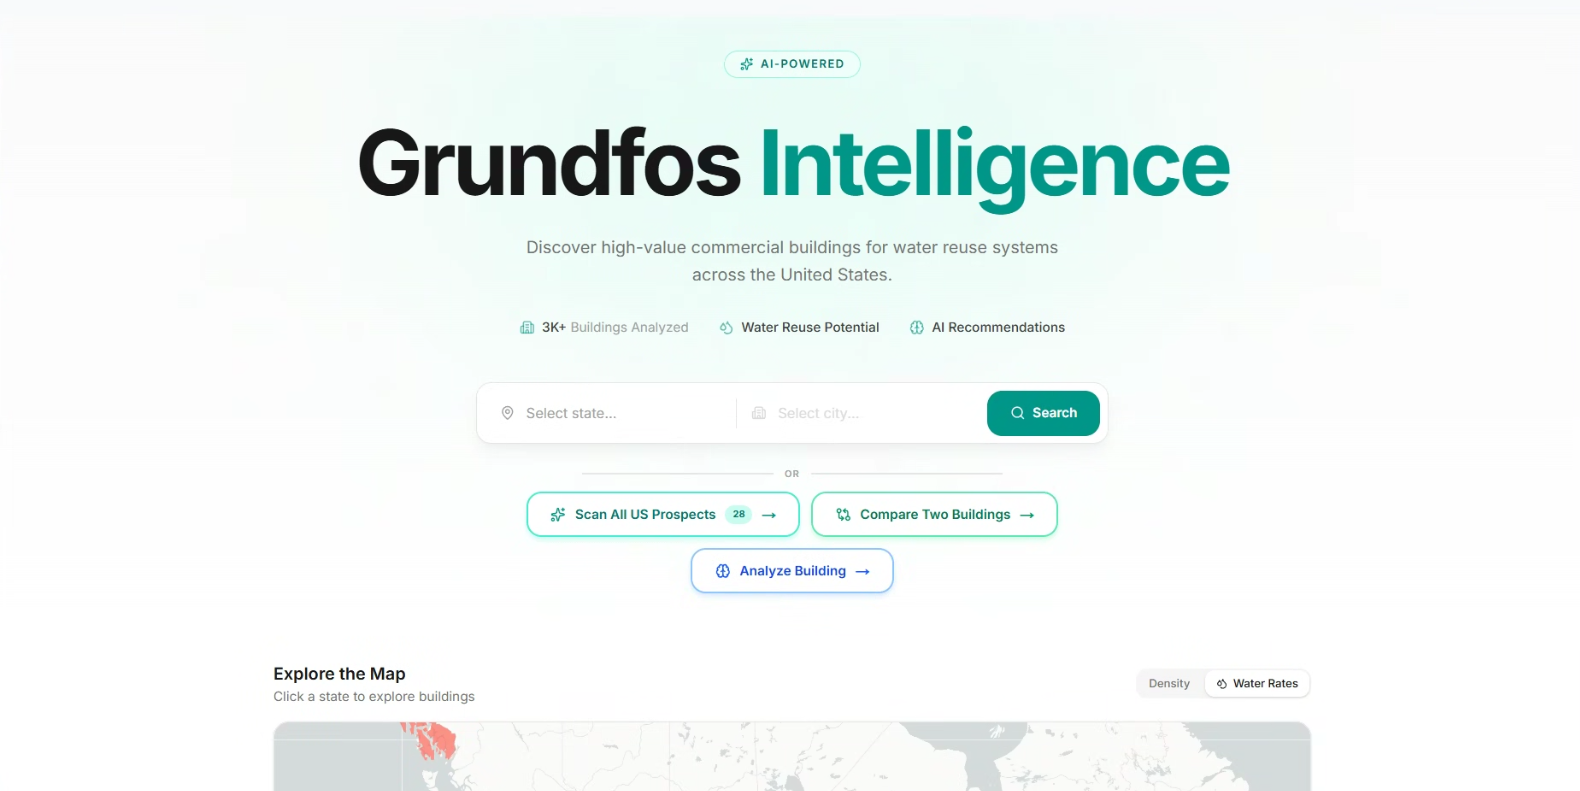
Water is the most overlooked sustainability frontier in commercial real estate. Walking through Dallas, you see massive warehouse rooftops, hospital complexes, and data center campuses — millions of square feet of surface area getting rained on every year while the same buildings pay thousands of dollars monthly in water utility bills. Grundfos posed the exact right question: why can't we find these buildings systematically?
The answer was that no one had built the tool yet. That gap inspired RainUSE Nexus.
What We Learned
The deeper we went, the more we realized this was not a technology problem — it was a data synthesis problem. The signals already exist across six public datasets. Nobody had connected them into a single score.
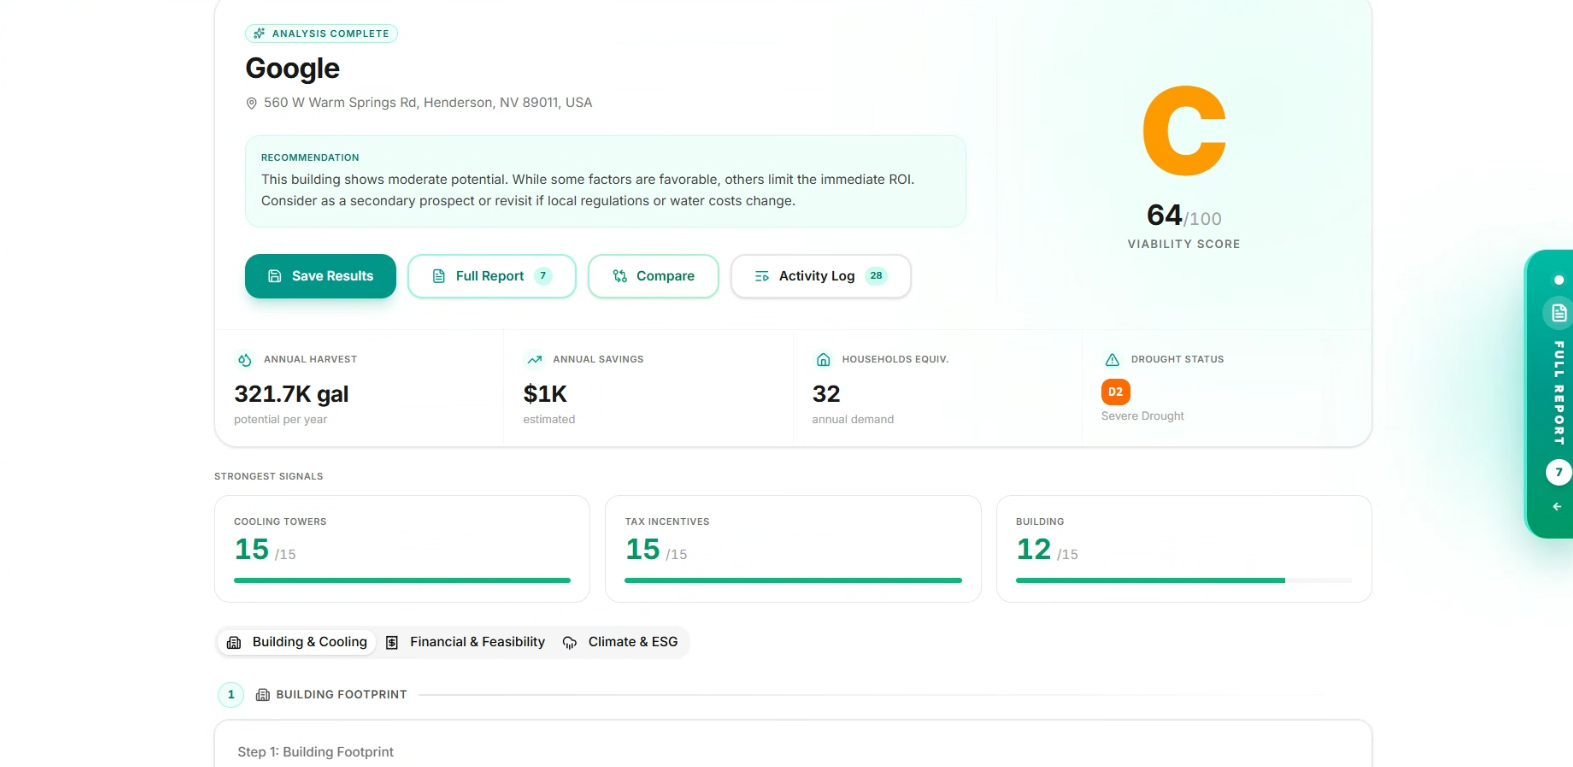
We learned that the viability of a rainwater harvesting installation is determined by three independent forces pulling at once — physical opportunity, financial incentive, and corporate urgency — and that a building only becomes a HOT lead when all three align simultaneously.
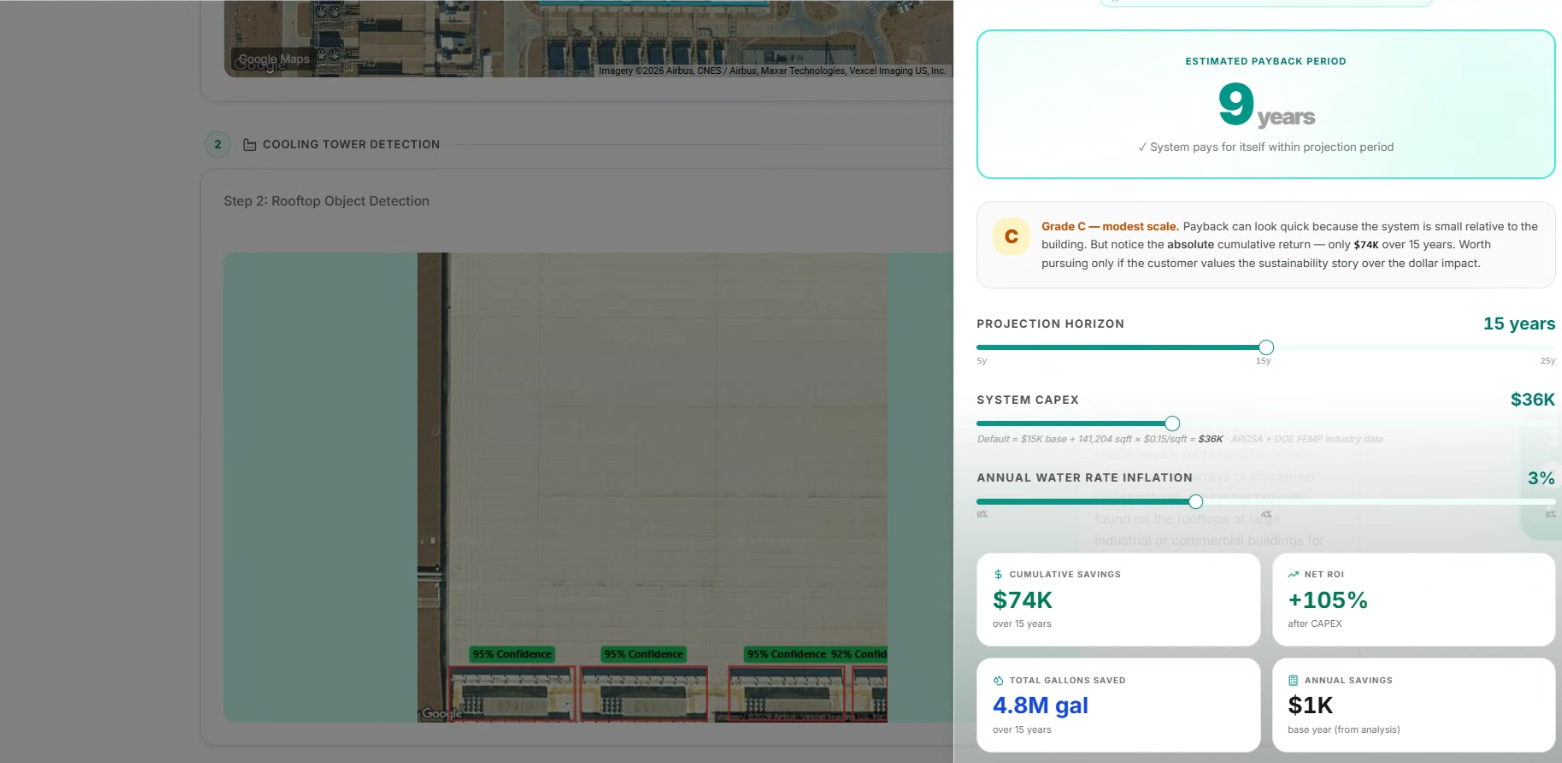
We also learned that the most powerful number in the whole system is not the viability score itself. It is the payback period — the single number a CFO needs to approve a capital expenditure.
How We Built It
The scoring engine is built on a weighted composite formula across three pillars:
$$V = (P_1 \times 0.35) + (P_2 \times 0.40) + (P_3 \times 0.25)$$
Pillar 1 — Physical Score $P_1$
$$P_1 = \text{RoofScore} \in {60, 80, 100} \text{ based on sqft tier}$$
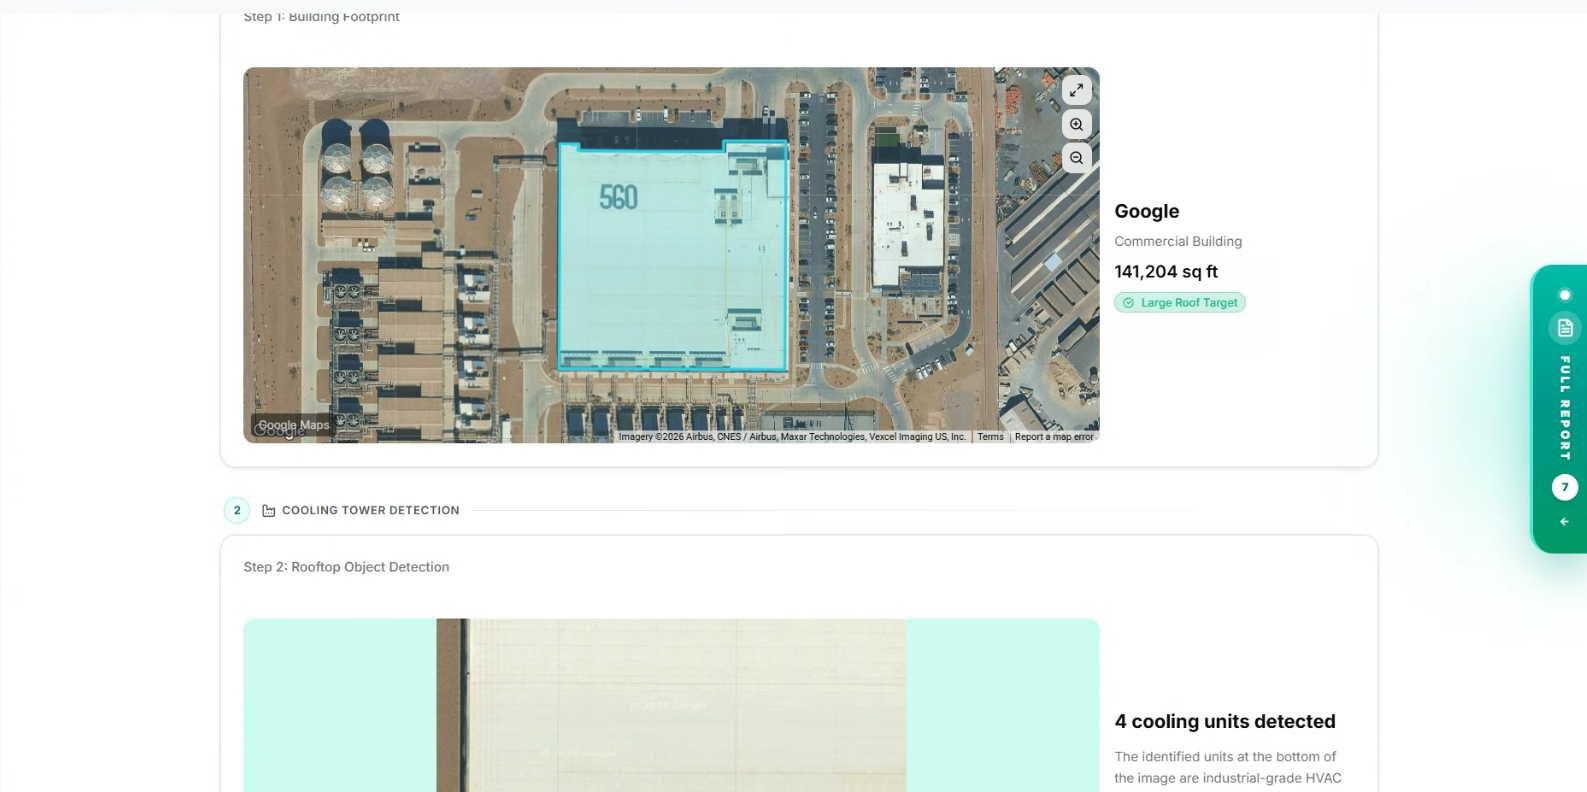
Roof catchment areas are identified using satellite imagery and computer vision, flagging buildings where:
$$A_{roof} > 100{,}000 \text{ ft}^2$$
Pillar 2 — Financial Score $P_2$
$$P_2 = \frac{U + S + R + T}{4}$$
Where:
- $U$ = utility rate score
- $S$ = sewage discharge score
- $R$ = rain yield score
- $T$ = tax incentive score
Each variable is min-max normalized using:
$$\text{Score} = \frac{x - x_{min}}{x_{max} - x_{min}} \times 100$$
Annual water yield is calculated using the DOE formula:
$$Y_{gal} = A_{roof} \times R_{in} \times 0.623 \times 0.85$$
The simple payback period presented to the CFO:
$$\text{Payback (yrs)} = \frac{\text{CAPEX}}{\left(\frac{Y_{gal}}{1000} \times W_r + \frac{Y_{gal}}{1000} \times S_r\right) - \text{OPEX}}$$
Where $W_r$ = water rate (\$/kgal) and $S_r$ = sewage rate (\$/kgal).
Pillar 3 — Corporate / ESG Score $P_3$
$$P_3 = \frac{E + L + C}{3}$$
Where:
- $E$ = ESG urgency score (deadline proximity tier)
- $L$ = LEED certification score
- $C$ = climate risk score from WRI Aqueduct 4.0
Final Score
$$\boxed{V = (P_1 \times 0.35) + (P_2 \times 0.40) + (P_3 \times 0.25)}$$
| Score Range | Lead Tier |
|---|---|
| $V \geq 80$ | 🔴 HOT |
| $65 \leq V < 80$ | 🟠 WARM |
| $V < 65$ | 🔵 COLD |
Challenges We Faced
Data normalization across incompatible sources was the hardest problem. Water rates are published as monthly bills, rainfall as annual inches, climate risk as a 0–5 stress index, and LEED as categorical levels. Converting all of these to a common 0–100 scale without losing relative differences required careful min-max normalization:
$$\text{Score}i = \frac{x_i - x{min}}{x_{max} - x_{min}} \times 100$$
And deliberate tier decisions for categorical variables like LEED and ESG urgency where linear scaling does not apply.
The dependency on satellite imagery created a pipeline sequencing challenge. CV detection of roof area and cooling towers had to happen before any score could be calculated, making physical detection the critical path of the entire system.
Defining what a HOT lead actually means for a Grundfos sales rep not a data scientist forced us to reframe every metric in business language:


Log in or sign up for Devpost to join the conversation.