

Inspiration
This project was inspired by Google's recent study on gender bias. https://www.forbes.com/sites/kimelsesser/2019/03/05/google-finds-gender-bias-against-men-really/#792a64dda6a9. Their findings showed that men were paid more than women and proceeded to equalize the salaries, but did not collect any data on years of experience, years to promotion, as well as other diversity organization statistics.
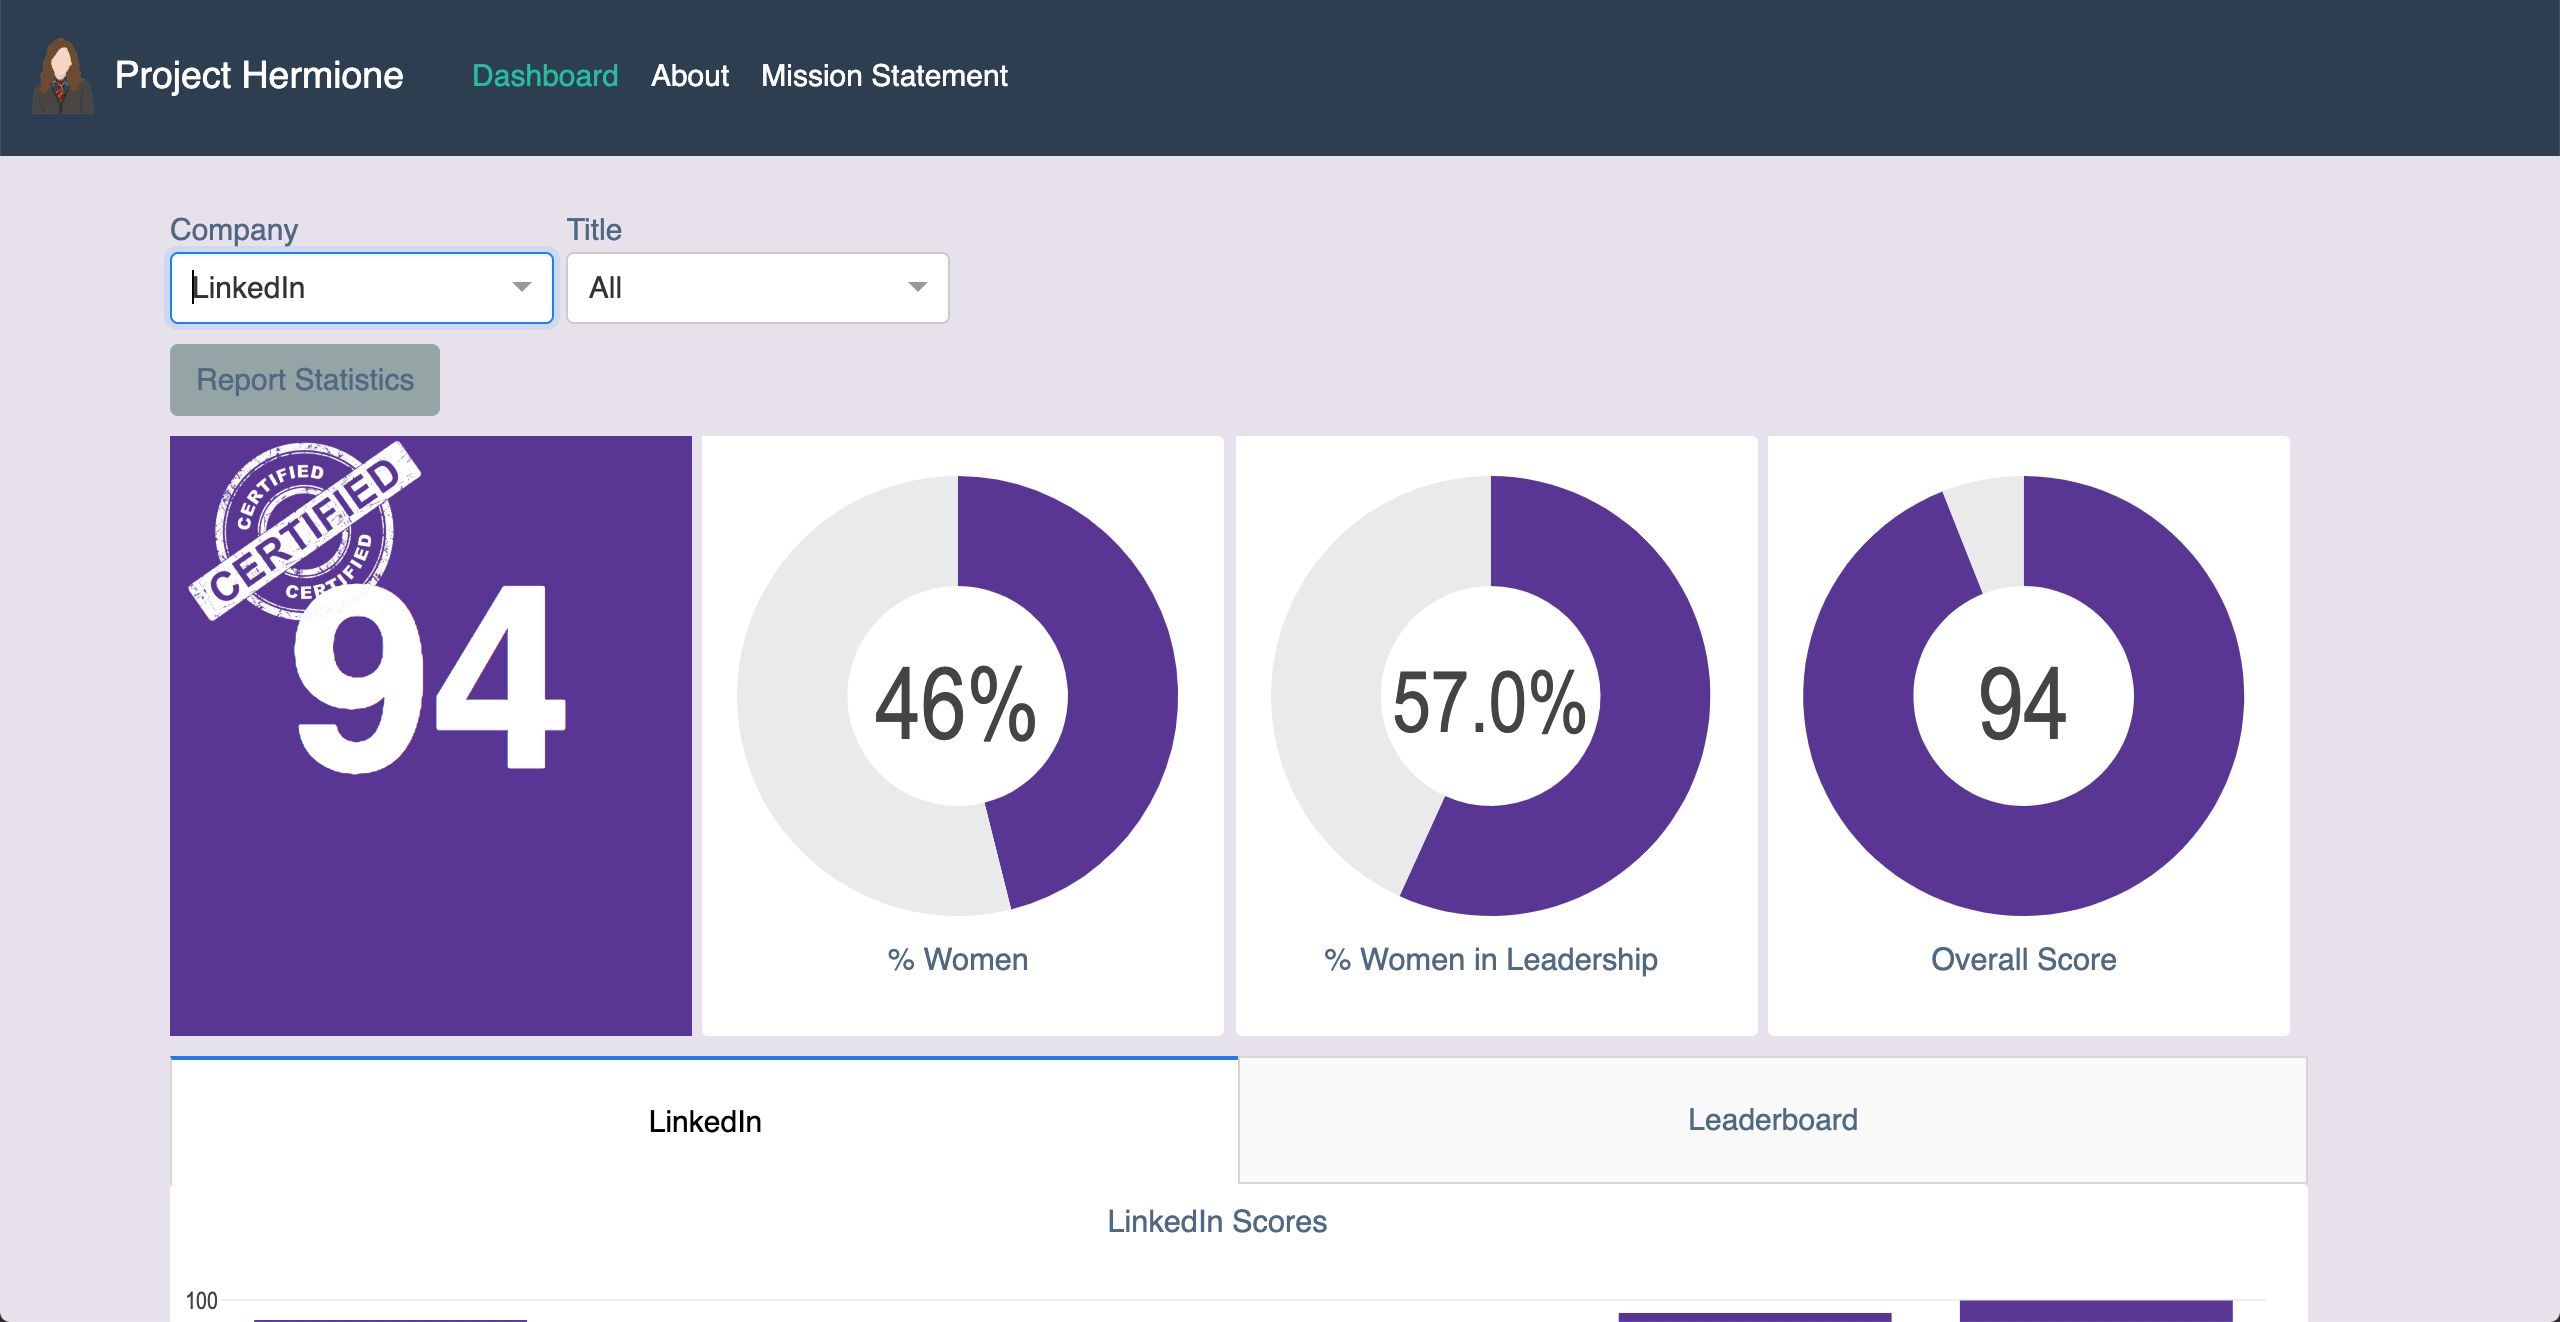
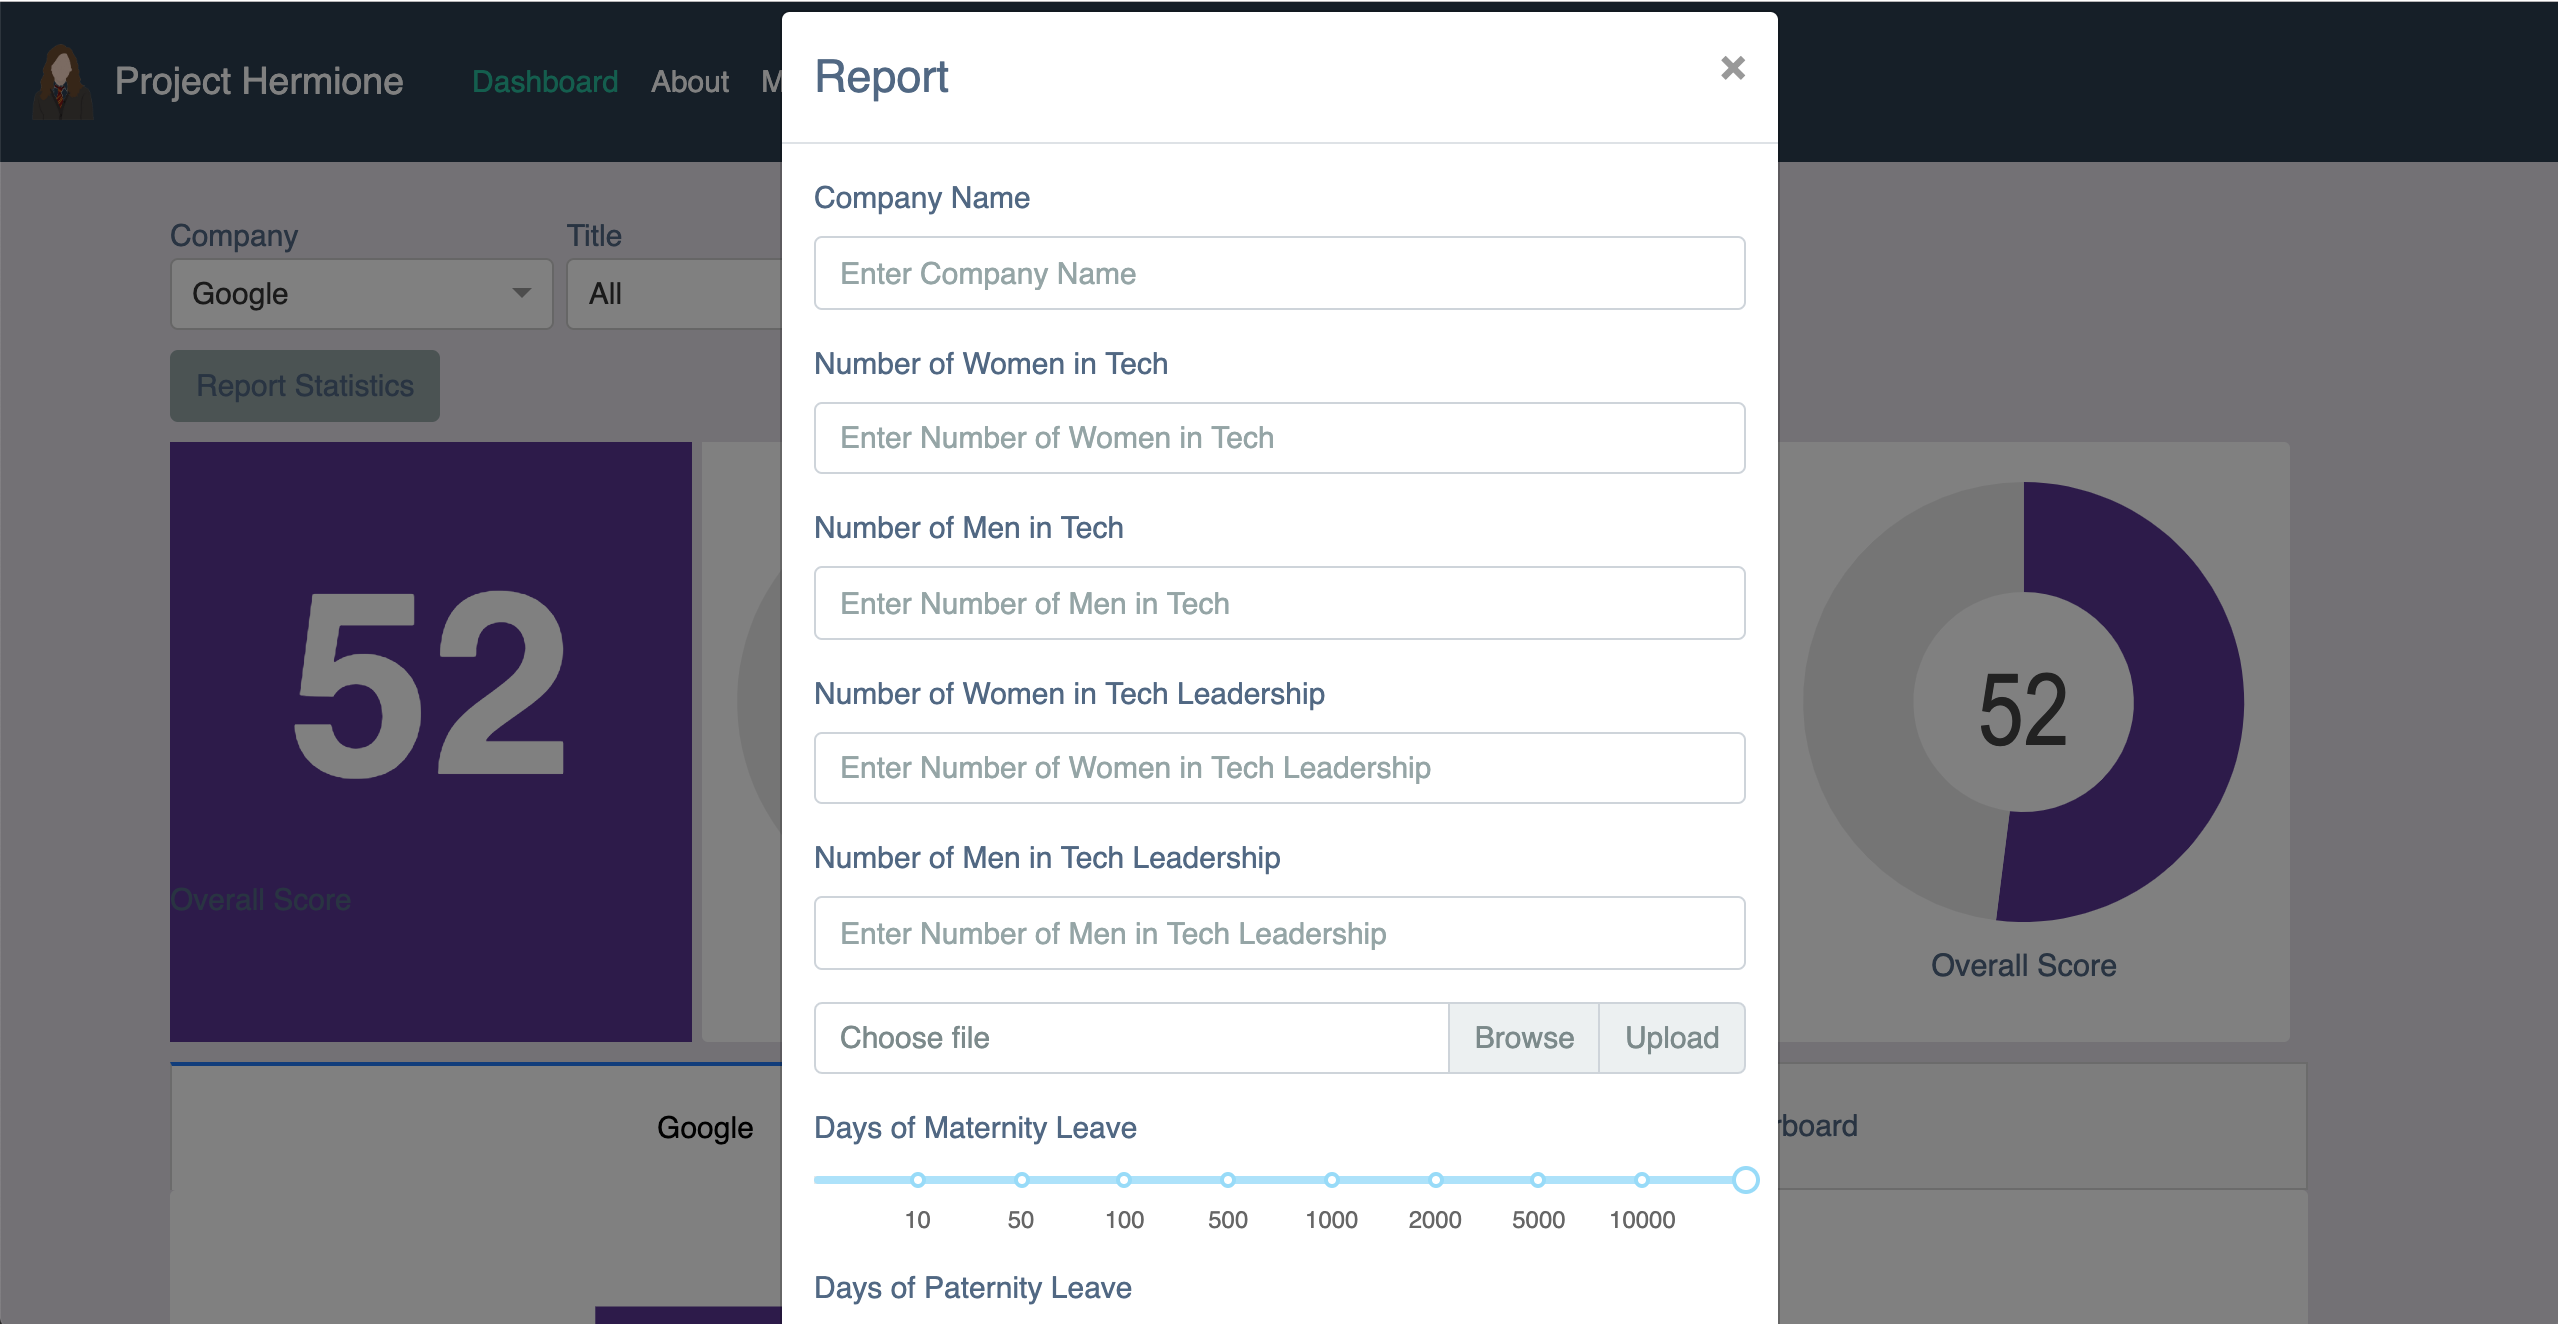
What it does
Companies can submit their data on to the app and get certified while being able to see how other companies rank. In a field where data ubiquitous, it seems ironic that we do not have much data on gender diversity.
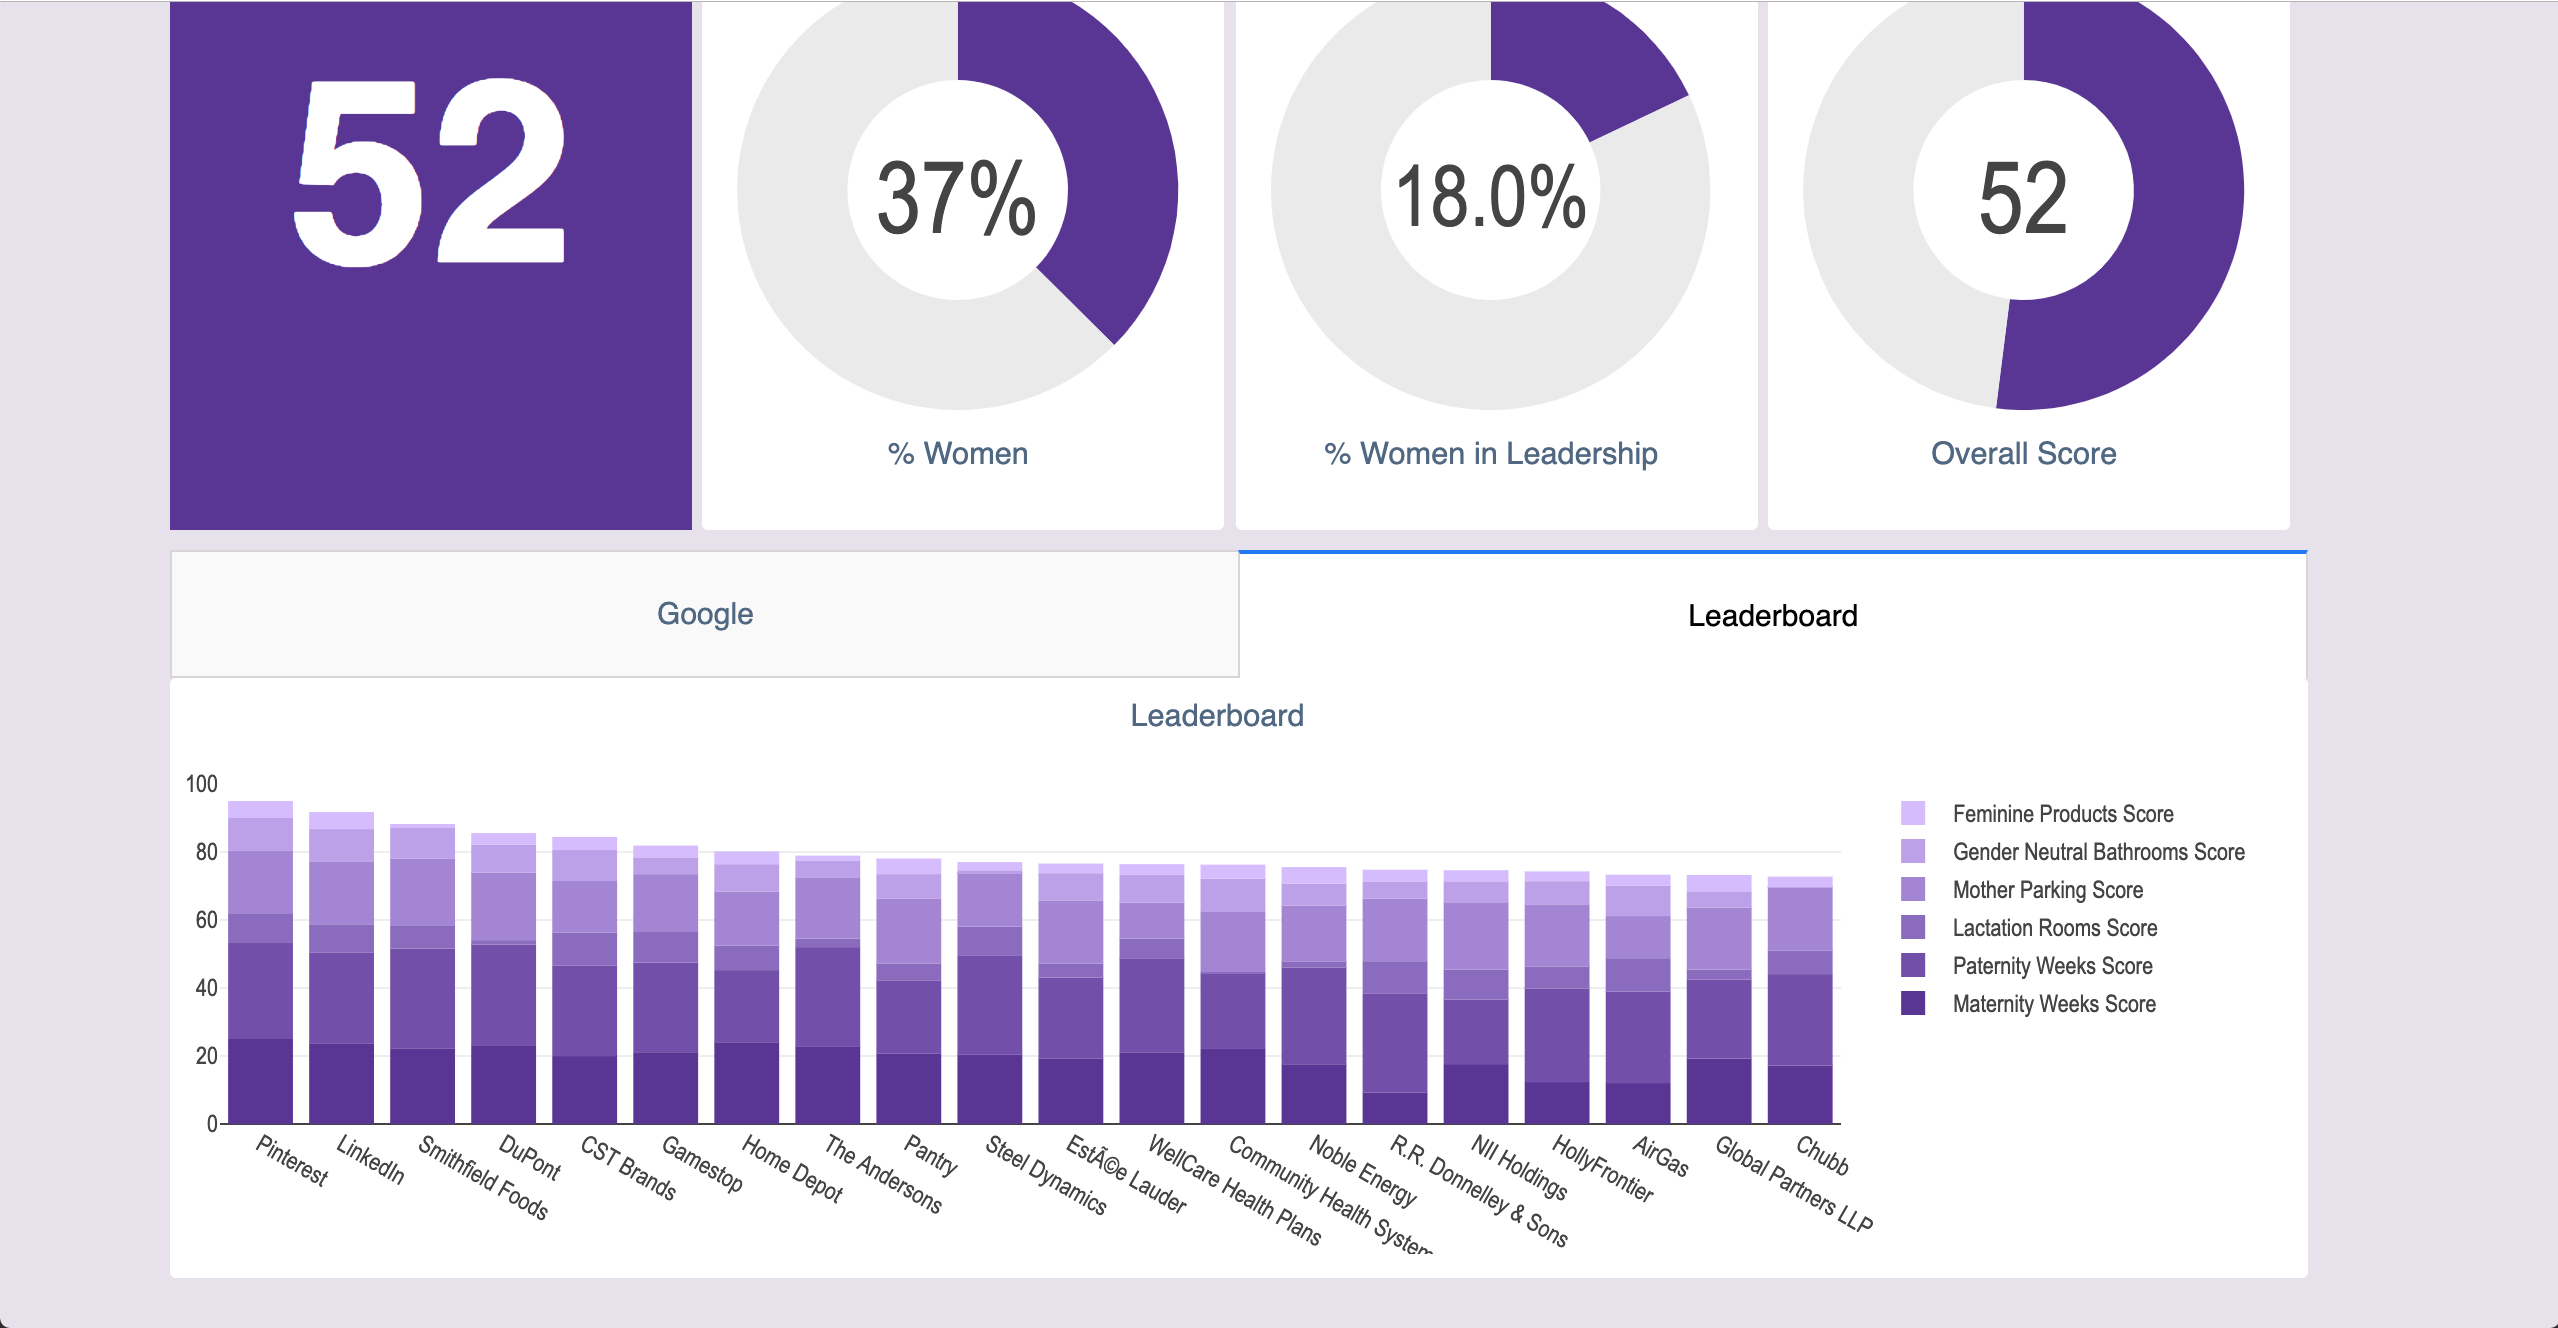
How we built it
Built on python flask with a mysql backend. The charts are generated using dash (built on flask, d3.js, and react)
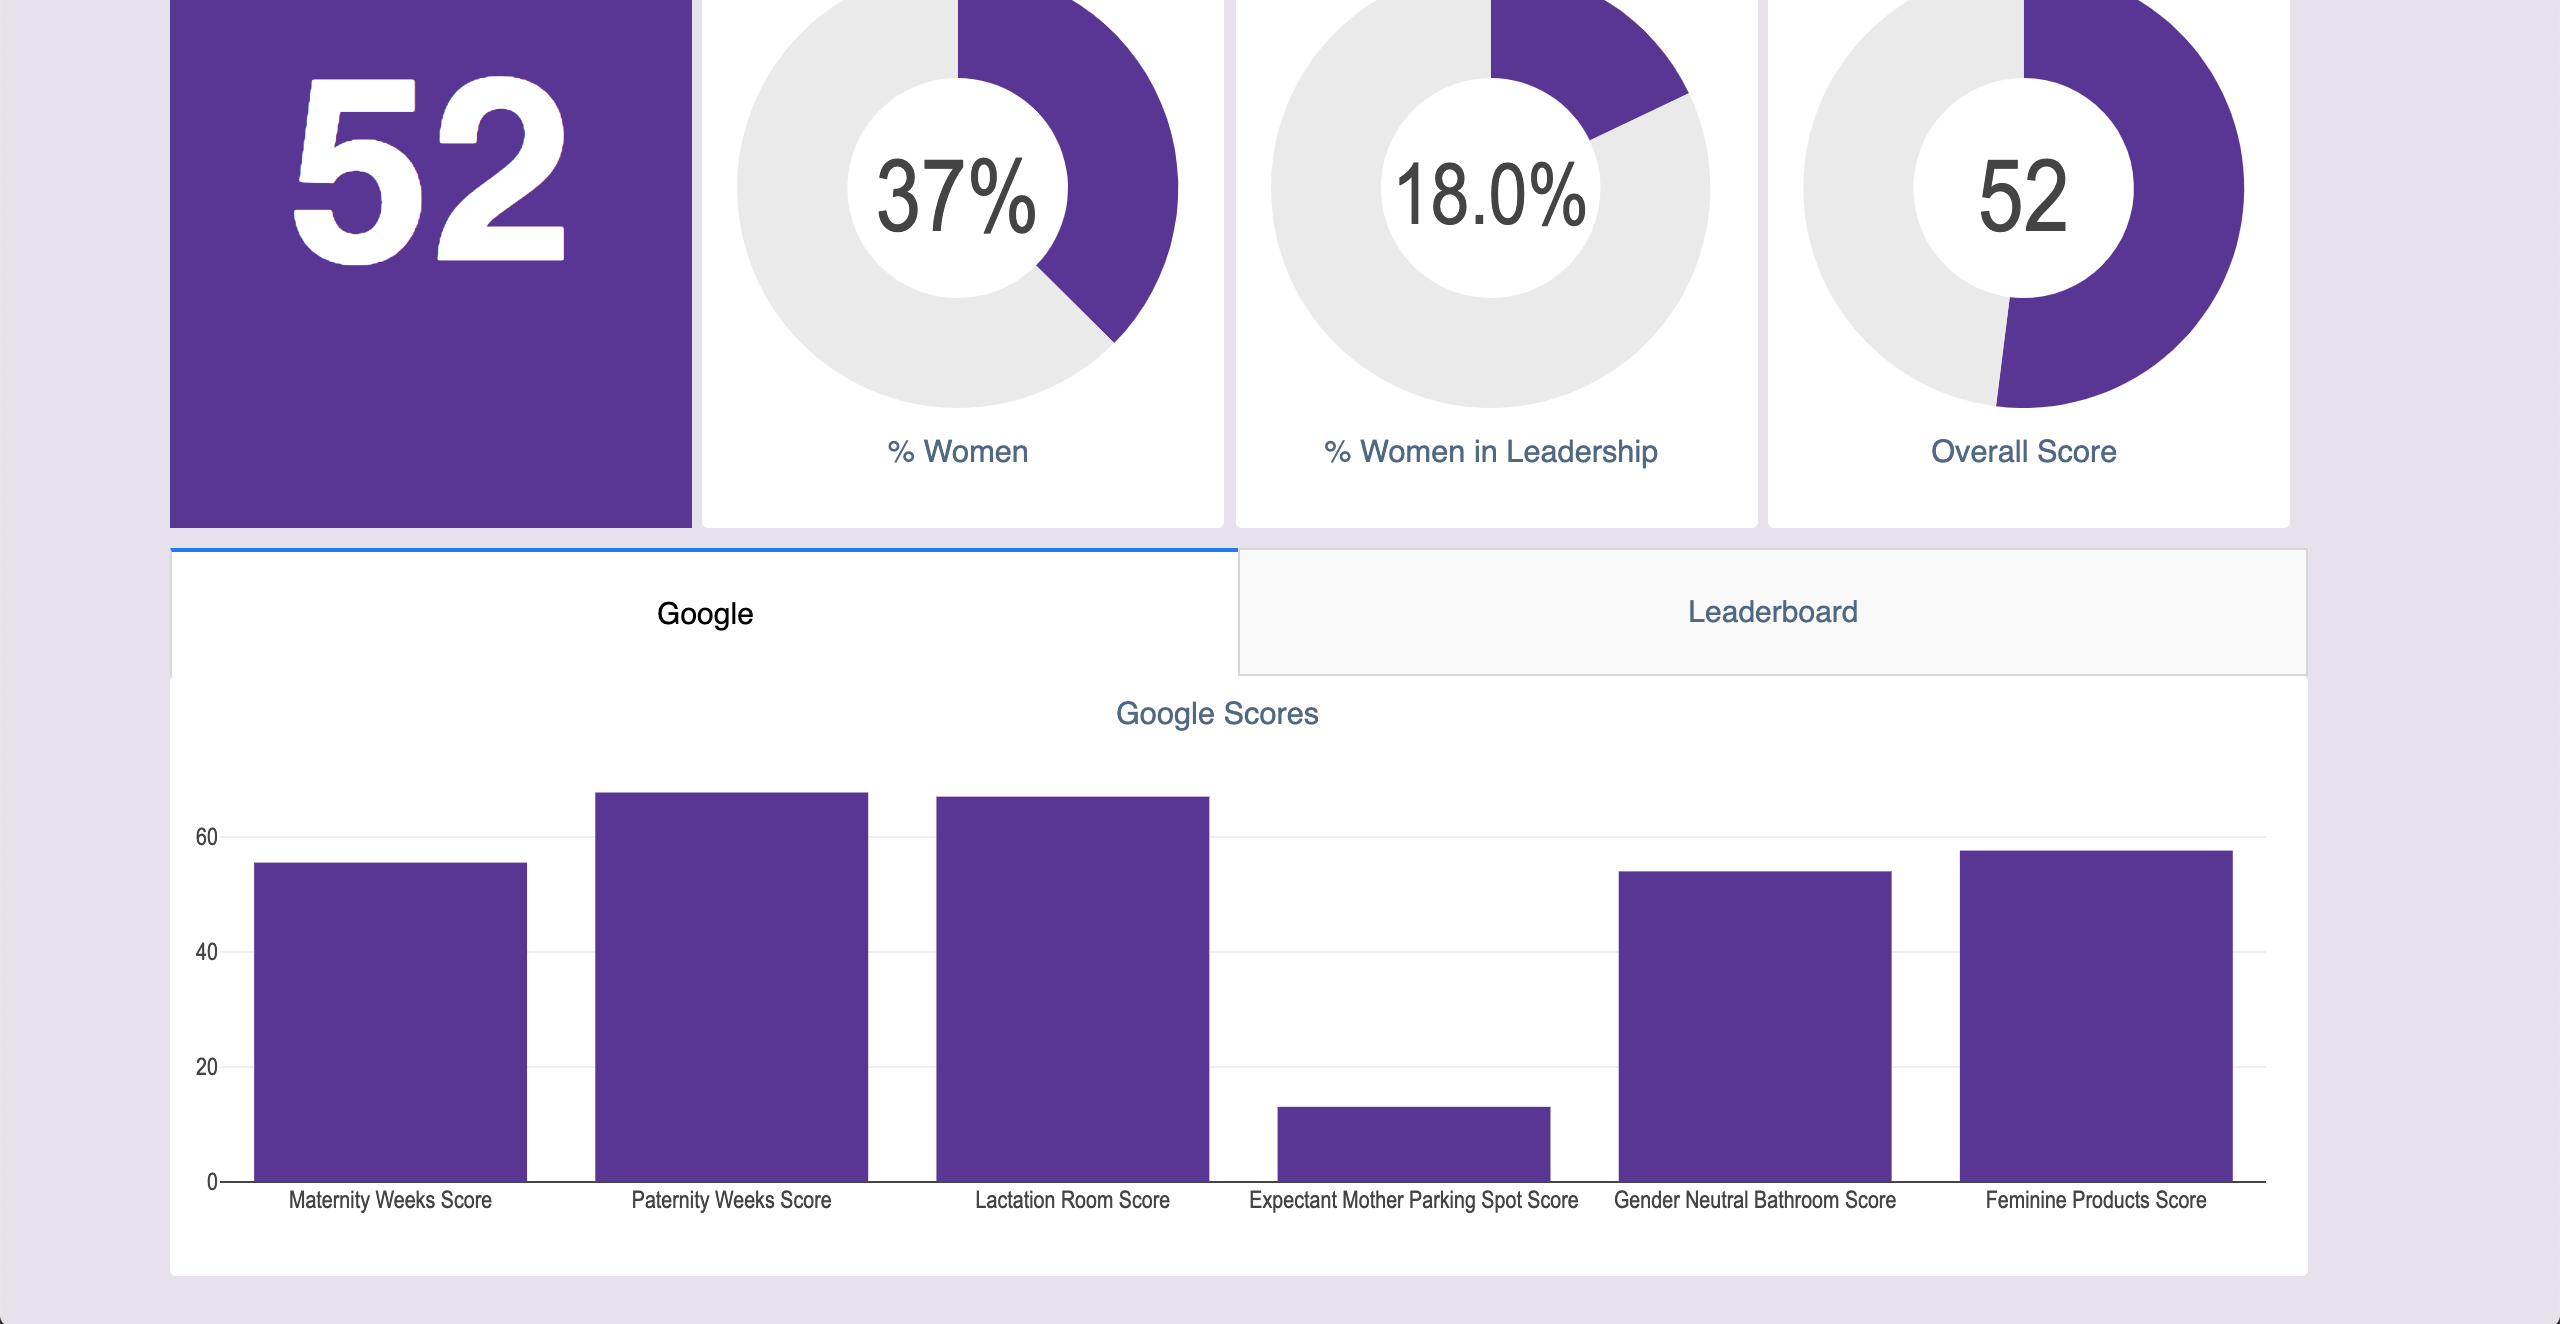
Challenges we ran into
Deciding which metrics to measure, also learning curve for getting Dash to work
Accomplishments that we're proud of
It works!
What we learned
Hacking is fun! And sleep is for the weak!
What's next for Hermione
Deployment so companies can get started on posting their statistics

Log in or sign up for Devpost to join the conversation.