-
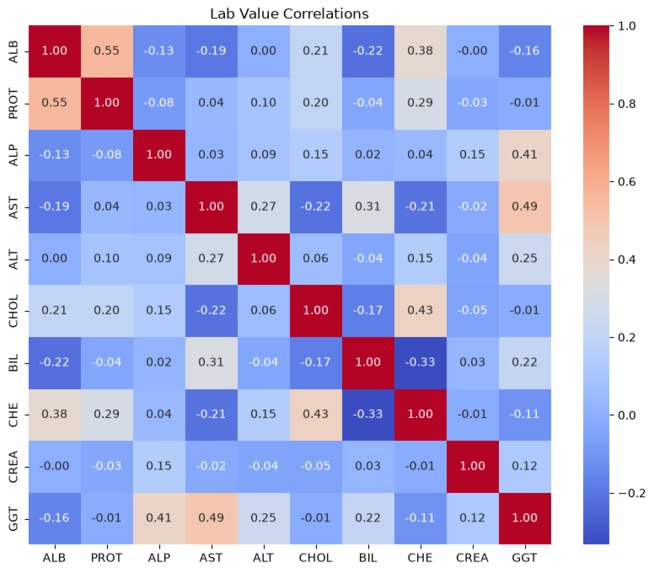
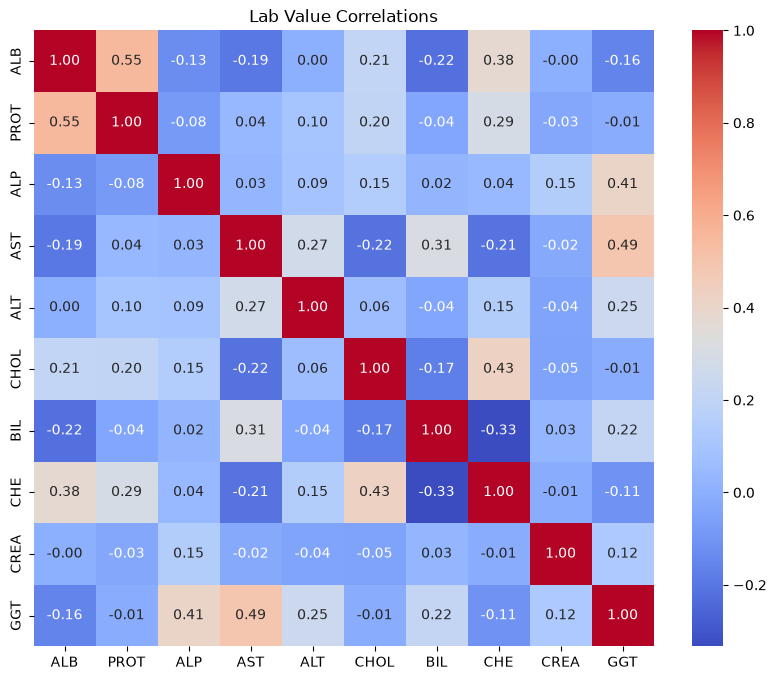
Correlation Heatmap
-
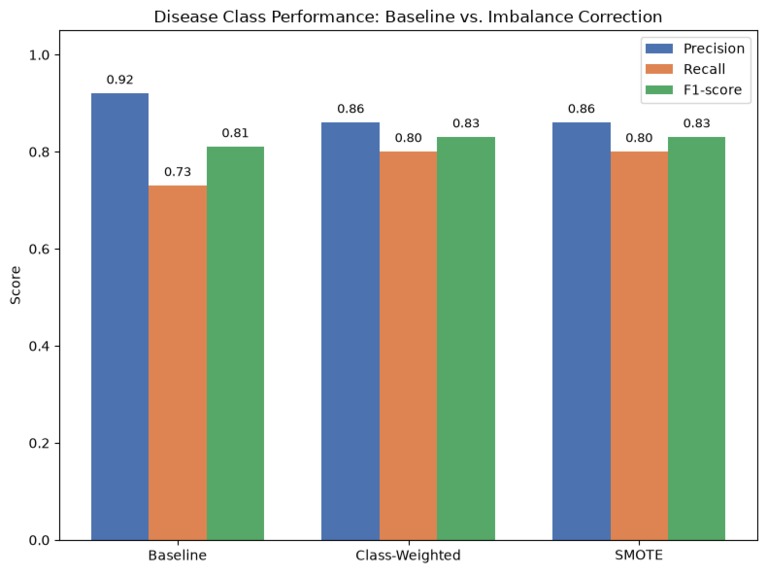
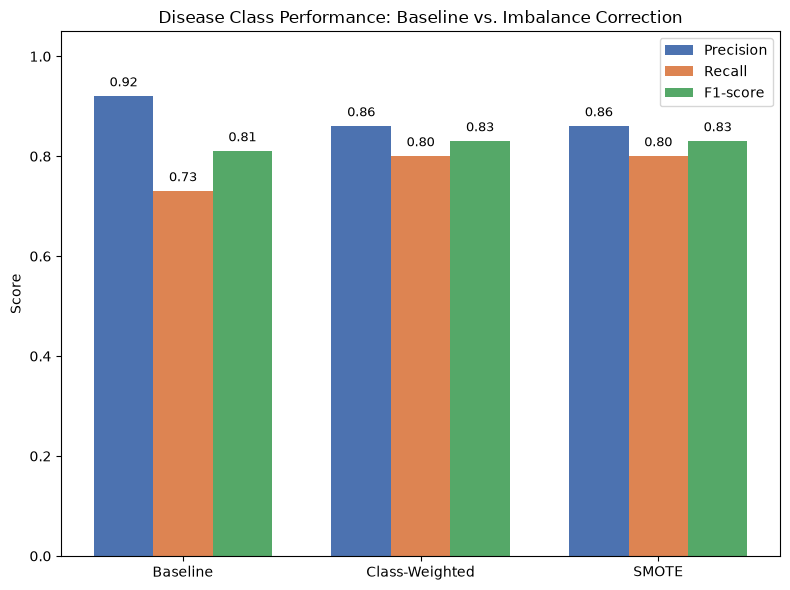
Model comparison bar chart (Disease recall across all three models)
-
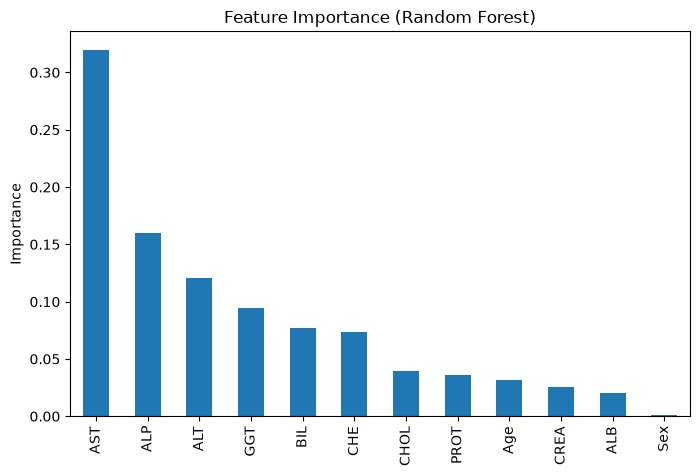
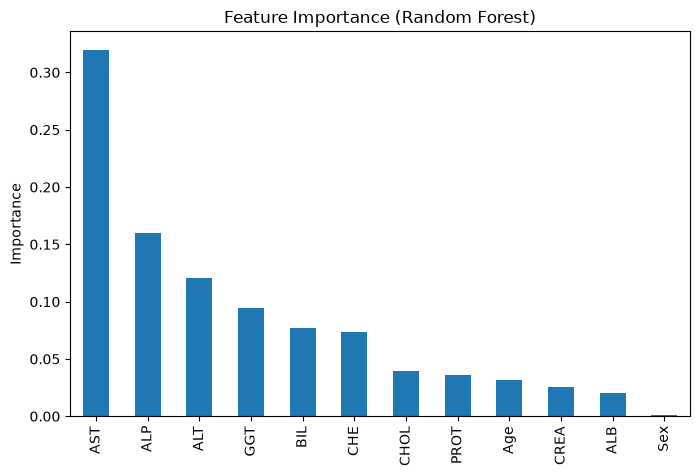
Feature Importance Chart for AST/ALP ranking
-
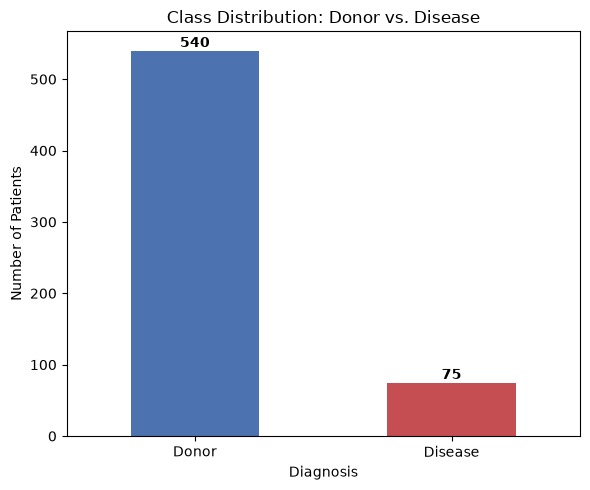
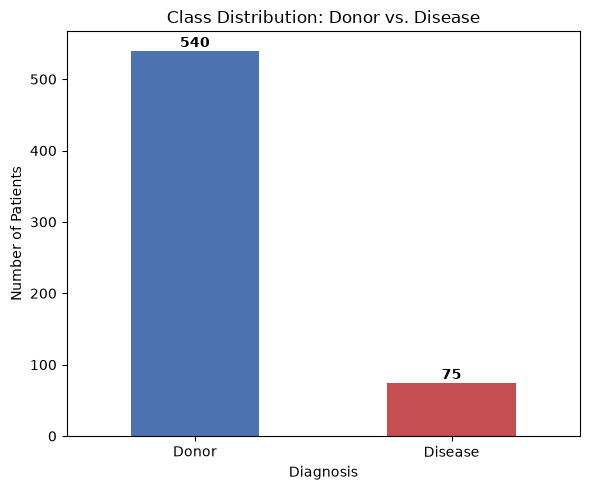
Class Distribution Bar Chart
Inspiration
In healthcare, that number can lie. A model that predicts "healthy" for everyone can hit 88% accuracy on this dataset while catching zero actual disease cases. I wanted to build something that confronts that problem directly, using real clinical lab data where the stakes of a missed diagnosis are made explicit.
What it does
This project classifies patients as blood donors or liver disease patients using ten standard blood panel values (liver enzymes, protein markers, cholesterol, etc.). It's a binary classification model built on a severely imbalanced dataset — disease cases make up only ~12% of the 615 patient records — so the real work isn't just fitting a model, it's making sure that model can actually detect the minority class it's supposed to catch.
How I built it
- Diagnosed missing data before analysis Rather than dropping incomplete rows, I traced where missing lab values fell — and found they were concentrated almost entirely in disease patients (a classic "sicker patients had incomplete panels" pattern). Used group-wise median imputation to avoid diluting disease-patient values with healthy-majority statistics.
- Established an honest baseline. A standard logistic regression hit 96% accuracy but only 73% recall on disease cases — meaning ~27% of sick patients would've been misclassified as healthy.
- Compared two imbalance-correction methods head-to-head: class-weighted logistic regression vs. SMOTE (synthetic oversampling). Both lifted disease recall to 80%, converging on identical results — itself a finding, suggesting the real bottleneck is minority-class sample size, not algorithm choice.
- Validated against real research. Random Forest feature importance ranked AST and ALP highest, matching published findings on this exact dataset — external confirmation that the model is picking up genuine clinical signal, not noise.
Challenges I ran into
- With only 75 disease cases total, every modeling decision (train/test split, imputation, resampling) had to account for how easily the minority class could be accidentally erased or diluted.
- Interpreting why two different imbalance techniques produced identical results required going beyond "it worked" into understanding the sample-size ceiling underneath both methods.
What I learned
That accuracy is often the wrong metric to lead with, that missingness patterns can carry real diagnostic information, and that a "good enough" result (recall improving from 0.73 to 0.80) is still worth analyzing carefully rather than chasing an artificially perfect score.
What's next
Bootstrapped confidence intervals to account for the small sample size, SHAP values for more rigorous feature attribution, and testing whether the same approach generalizes to an external patient cohort.
Built With
- classification
- data-science
- healthcare
- imbalanced-data
- jupyter-notebook
- logistic-regression
- machine-learning
- pandas
- python
- random-forest
- scikit-learn
- smote


Log in or sign up for Devpost to join the conversation.